

What Is Agentic AI Observability: A Complete Guide
The evolution of Artificial Intelligence is currently undergoing a paradigm shift: moving from passive chatbots that simply "answer" to autonomous agents that "act." While traditional Large Language Models (LLMs) operate in single-turn exchanges, agentic AI possesses the agency to reason, orchestrate multi-step workflows, and interact with external environments independently. However, this newfound autonomy introduces a "Black Box" risk. When an agent enters an infinite loop or misinterprets a tool's output, developers often lack the visibility to pinpoint where the logic diverged.
Agentic AI observability emerges as the critical solution to this challenge. It represents a transition from monitoring simple inputs and outputs to capturing the entire execution trajectory. By providing a "glass-box" view of an agent’s internal reasoning, organizations can transform unpredictable autonomous processes into transparent, auditable, and cost-efficient workflows. This guide explores the foundational pillars, essential tools, and evaluation frameworks required to ensure that agentic systems remain reliably aligned with human intent.
What is Agentic AI Observability
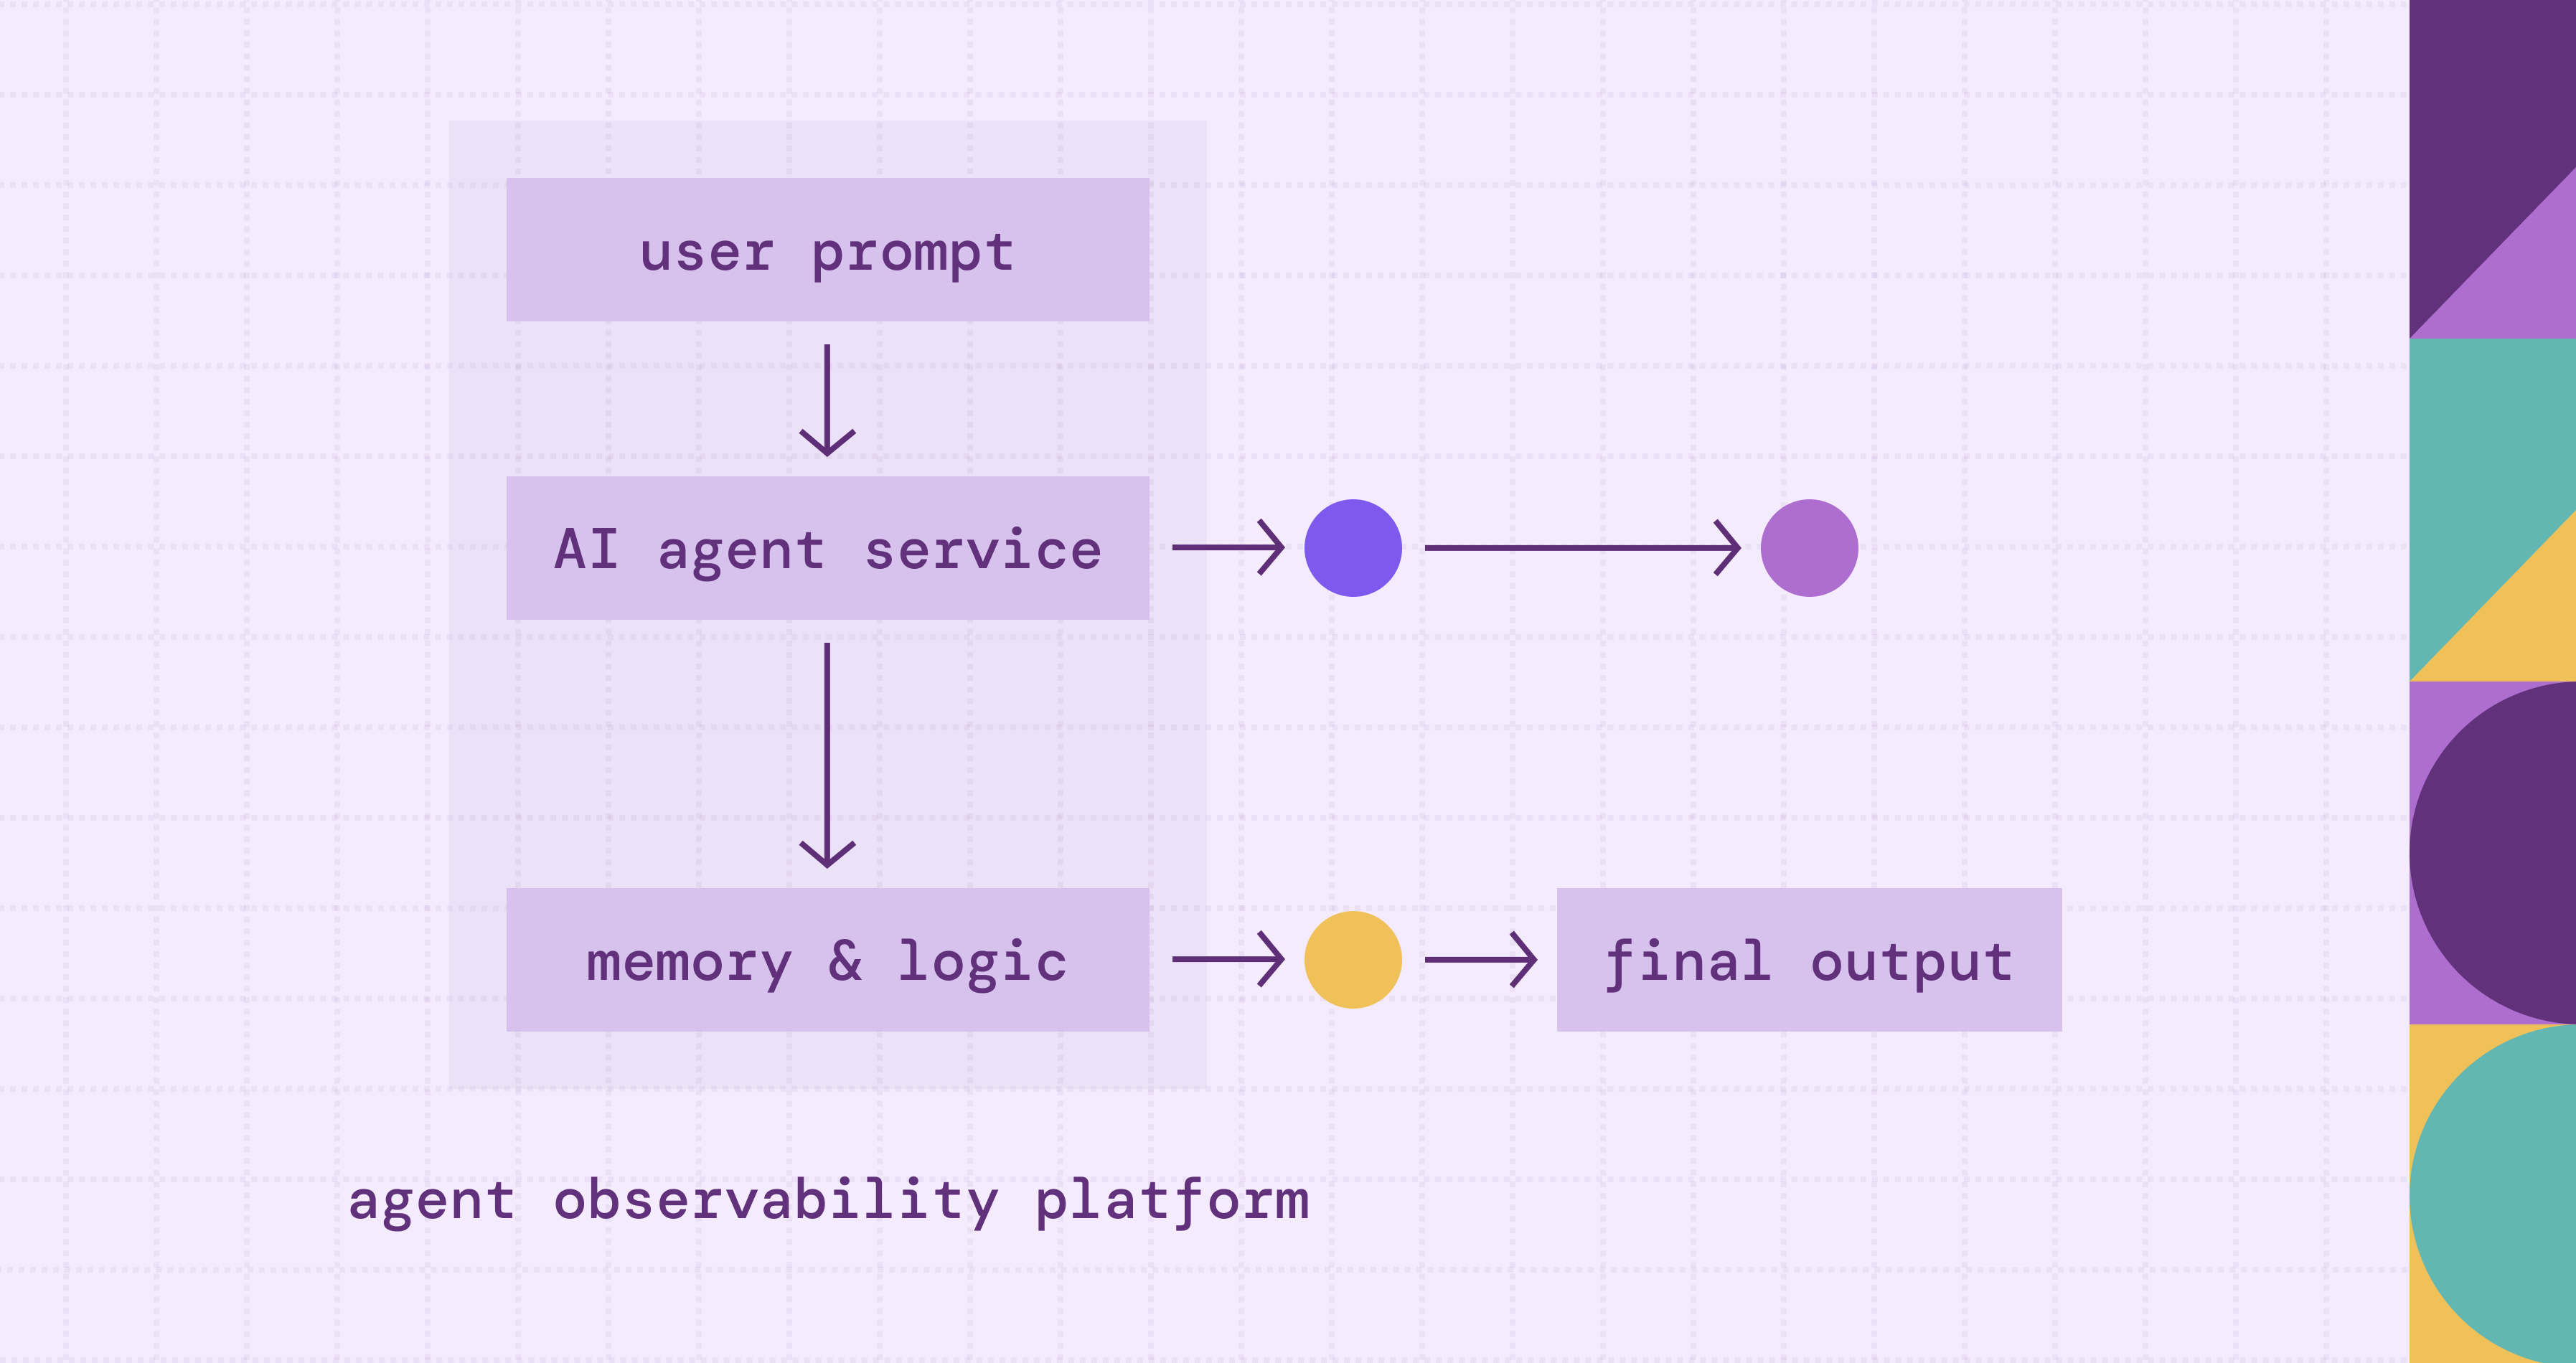
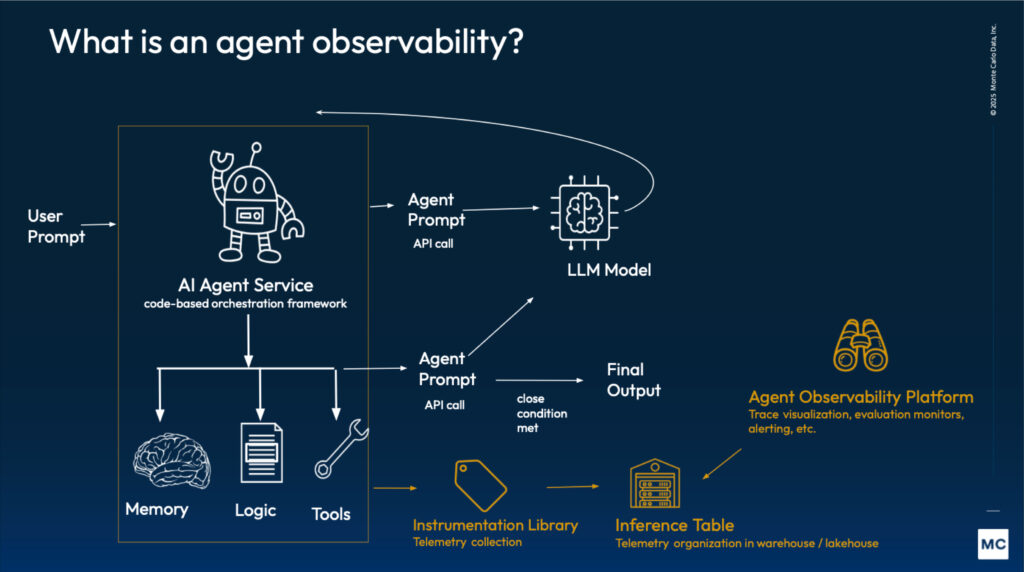
Agentic AI observability is the practice of gaining deep, real-time visibility into the internal reasoning, decision-making cycles, and tool-use behaviors of autonomous AI agents. Unlike traditional AI monitoring, which focuses primarily on the final output (the "what"), agentic observability focuses on the execution trace (the "how").
According to industry frameworks, such as those detailed by IBM, this specialized observability is defined by three core capabilities:
- Traceability of Multi-Step Reasoning: Agents often operate in loops: reasoning, acting, and observing. Observability allows developers to decompose these "chain-of-thought" sequences. It captures how an agent interprets a prompt, breaks it into sub-tasks, and decides which path to take.
- Tool and Environment Interaction Monitoring: Because agents interact with external APIs, databases, and web browsers, observability must track the "handshake" between the LLM and these tools. This includes monitoring the inputs sent to tools and the validity of the data returned, ensuring the agent doesn't "hallucinate" tool capabilities.
- Contextual Integrity: It involves monitoring the "state" of the agent's memory over time. As an agent moves through a long-running task, its "context window" can become cluttered with irrelevant information. Observability helps identify exactly where the context became corrupted, leading to a loss of focus or "logic loops."
In essence, while traditional LLM observability monitors a single transaction, Agentic AI Observability monitors a workflow. It transforms the agent's "black box" reasoning into a transparent, auditable trail that can be evaluated for safety, cost-efficiency, and accuracy.
Why Observability is Crucial for Agentic AI Systems
The transition from a single-turn LLM to a multi-step agent shifts the risk profile from simple "incorrect text" to "unintended autonomous actions." Observability is not just a debugging luxury; it is a foundational requirement for several critical reasons:
1. Managing the "Black Box" of Multi-Step Reasoning
Unlike standard LLMs that generate a single response, agents operate through iterative loops of thought and action. Without observability, the intermediate steps, where an agent might misinterpret a goal or begin a flawed logical progression, are invisible. Observability provides a "glass-box" view, allowing developers to see where the reasoning diverged from the intended path before a final (and potentially harmful) action is taken.
2. Preventing Hallucination Loops and "Logic Spirals"
In agentic workflows, a single hallucination can be compounded. If an agent hallucinates the output of a tool, it uses that false information as the basis for its next "thought," leading to a downward spiral of errors. Effective observability detects these inconsistencies in real-time, identifying when the agent’s internal state no longer aligns with the external reality of the data it has retrieved.
3. Ensuring Reliable Tool Orchestration
Agents are designed to interact with the real world via APIs, databases, and web browsers. This introduces a "handshake" risk: the agent must correctly format its request, and it must correctly parse the response. Observability is crucial for monitoring these integration points to ensure the agent isn't misusing tools, hitting rate limits, or failing to handle the "edge cases" of third-party software responses.
4. Cost and Latency Optimization
Every "step" an agent takes, every internal thought and every tool call, incurs a cost in both tokens and time. Without granular tracing, it is impossible to identify "inefficient agents" that take 20 steps to solve a problem that should only take five. Observability allows teams to pinpoint redundant loops and optimize the "trajectory" of the agent, making the system economically viable for production.
5. Establishing Accountability and Safety Guardrails
For enterprise-grade AI, there must be an audit trail. If an agent performs a sensitive action, such as updating a financial record or sending an email, observability provides the forensic evidence needed to understand why that decision was made. It acts as a continuous safety monitor, ensuring that the agent remains within the predefined "guardrails" and adheres to human intent throughout its execution.
Key Components of Agentic AI Observability
To move beyond basic monitoring and achieve true observability for autonomous systems, a platform must capture more than just inputs and outputs. According to industry standards and insights from IBM, effective agentic observability is built upon four foundational pillars:
1. Advanced Traceability (The Execution Path)
Traditional tracing follows a request through microservices; agentic tracing follows the "Chain of Thought." This component allows developers to visualize the agent's iterative loops.
- Reasoning Steps: Capturing the internal monologue where the agent decides how to decompose a complex goal into sub-tasks.
- State Management: Tracking how the agent’s "memory" changes after each interaction, ensuring that the context remains relevant and hasn't drifted into a "logic loop."
- Parent-Child Relationships: Mapping the hierarchy of a primary agent delegating tasks to sub-agents or specific tools.
2. Tool Orchestration & Integration Monitoring
Since agents act as "conductors" for external software, observability must treat tool calls as first-class citizens.
- Input/Output Validation: Monitoring the exact parameters the agent sends to an API and the raw data it receives back. This helps identify if an agent is "hallucinating" tool arguments.
- External Latency & Failure Rates: Distinguishing between a failure in the model’s reasoning and a failure in the external service (e.g., a database timeout or a 403 Forbidden error).
3. Semantic Evaluation (LLM-as-a-Judge)
Because agents deal with unstructured text, success cannot be measured by "uptime" alone. This component uses high-reasoning models to evaluate the quality of the agent's trajectory.
- Faithfulness & Grounding: Checking if the agent’s actions are supported by the retrieved data (RAG) rather than internal hallucinations.
- Relevancy: Determining if the intermediate steps taken by the agent actually contribute to the final goal or if the agent is "wandering" inefficiently.
4. Real-Time Guardrails and Alerting
Observability is not just for post-mortem analysis; it must act as a continuous safety monitor.
- Policy Enforcement: Automatically flagging traces that violate safety, privacy, or brand guidelines (e.g., an agent attempting to access unauthorized financial records).
- Cost & Token Tracking: Real-time visibility into token consumption across multi-step workflows. This prevents "runaway agents" from incurring massive API costs during an infinite loop.
By integrating these components, organizations can transform a "black box" autonomous process into a transparent, auditable workflow. This enables developers to pinpoint exactly where a reasoning chain broke down: whether it was a flawed prompt, a misunderstood tool response, or a corrupted context window.
Best Agentic AI Observability Tools
The landscape of agentic AI observability is rapidly evolving, moving beyond simple logging to sophisticated "trace-centric" platforms. Based on industry standards and common integrations within the IBM/OpenSource ecosystem, the following tools are leading the way in providing visibility into autonomous workflows:
OpenTelemetry (OTel) for AI

Open Source Standard. While not a single "tool," the industry is moving toward adopting OpenTelemetry standards for AI.
- Core Strength: Interoperability. This allows data from agentic frameworks like LangGraph or CrewAI to be exported to traditional monitoring stacks like Datadog or New Relic.
- The Trend: This addresses the "Lack of Standardized Schemas" challenge by providing a vendor-neutral way to record spans and traces across different agentic architectures.
Arize Phoenix
Open Source Platform. Phoenix is a heavy-hitter in the "AI-as-a-Judge" space, focusing on the evaluation of traces.
- Core Strength: Trajectory Evaluation. It uses LLMs to automatically score traces for "faithfulness" and "relevancy."
- Insight: It provides the "trace detail" view mentioned in technical documentation, allowing teams to identify exactly where an agent's context window became corrupted or where it entered an inefficient "logic spiral."
LangSmith (by LangChain)

Proprietary/Commercial SaaS. Since many agents are built using the LangChain framework, LangSmith has become a de facto standard for debugging complex chains.
- Core Strength: Visualizing the "Chain of Thought." LangSmith allows developers to see the exact input and output of every nested step in an agent’s trajectory.
- Key Feature: It excels at "Tracing," where you can click into a specific tool call to see if the agent misinterpreted the API response or if the prompt logic failed at a specific node.
Weights & Biases (W&B)

Proprietary/Commercial Platform. W&B has expanded from traditional machine learning experiment tracking into LLM and agentic monitoring.
- Core Strength: Comparative Analysis. It allows developers to compare different versions of an agent side-by-side.
- Use Case: If you change an agent's prompt or swap its underlying model (e.g., from GPT-4o to a specialized Llama-3 model), W&B helps visualize how that change affects the agent's multi-step decision-making path.
IBM watsonx.governance
Proprietary/Enterprise Platform. As highlighted in IBM’s insights, enterprise-grade agentic AI requires more than just performance tracking; it requires rigorous governance.
- Core Strength: It provides a comprehensive lifecycle view, focusing on accountability and risk management. It allows organizations to monitor agents for "hallucination loops" and ensures that the agent's multi-step reasoning remains within ethical and operational guardrails.
- Why it Matters: It bridges the gap between technical observability and corporate compliance, ensuring that autonomous actions are auditable.
Summary of Tool Selection
When choosing a tool for agentic observability, the decision should be based on the complexity of your agent's "handshake" with the real world:
- For Framework Agnosticism: Prioritize OpenTelemetry compatible solutions.
- For Automated Evaluation at Scale: Implement Arize Phoenix.
- For Deep Debugging of Chains: Use LangSmith.
- For Enterprise Governance: Choose watsonx.governance.
By leveraging these tools, developers can move from "guessing" why an agent failed to "knowing" exactly which reasoning step or tool interaction led to the error.
Evaluating Agent Behavior and Outputs
Evaluating an autonomous agent is significantly more complex than evaluating a static LLM because a "correct" final answer does not guarantee a safe or efficient process. According to insights from IBM and industry leaders, evaluation must shift from simple output matching to analyzing the entire execution trajectory.
1. From Keyword Matching to Semantic Evaluation
Traditional metrics like BLEU or ROUGE, which measure text similarity, fail to capture the nuance of agentic behavior. Instead, developers use Model-based Evaluation (LLM-as-a-Judge). This involves using a high-reasoning model (such as GPT-4o or watsonx.governance evaluators) to inspect the agent's internal logs and score them based on:
- Tool-Calling Accuracy: Did the agent select the correct tool and provide the right parameters?
- Logical Consistency: Did the agent's "Thought" step actually lead to its "Action" step, or was there a reasoning gap?
- Adherence to Constraints: Did the agent stay within predefined safety and privacy guardrails?
2. Trajectory Evaluation
Instead of only looking at the final result, evaluators examine the path the agent took. This is crucial for identifying "efficiency" issues. For instance, if an agent is tasked with a data analysis goal, trajectory evaluation asks:
- Path Efficiency: Did the agent take 15 steps to solve a problem that only required 3?
- Self-Correction Capability: When a tool returned an error, did the agent recognize the failure and pivot, or did it enter a "logic loop"?
- Grounding (RAG): Are the agent's intermediate claims supported by the data retrieved from external sources, or is it hallucinating facts during the process?
3. Human-in-the-Loop (HITL) and Feedback
While automated evaluations are essential for scale, IBM emphasizes the role of human feedback in refining agent behavior. Observability platforms now allow human reviewers to annotate specific "steps" in a trace. These annotations act as a "gold standard" dataset used to fine-tune the agent's prompt templates or improve its decision-making logic through Reinforcement Learning from Human Feedback (RLHF).
4. Comparison of Evaluation Methods
By combining these methods, organizations can transform agentic AI from an unpredictable "black box" into a disciplined, high-performance workflow that is both economically viable and operationally safe.
Challenges in Agentic AI Observability
The transition from monitoring static models to autonomous agents introduces unique technical and operational hurdles. Unlike traditional software, where execution paths are predefined by code, agentic systems are non-deterministic, making "visibility" a moving target. According to industry analysis and IBM’s frameworks, the following challenges are the most significant:
1. Lack of Standardized Schemas and Interoperability
One of the primary obstacles is the absence of a universal standard for logging agentic "thoughts" and "actions." While traditional web services use standardized protocols like OpenTelemetry for tracing, AI agents often run on proprietary or disparate frameworks (e.g., LangGraph, CrewAI, or custom loops). This fragmentation makes it difficult to aggregate data across different agentic components, leading to "visibility silos" where a developer can see a tool call but cannot easily correlate it with the high-level reasoning step that triggered it.
2. The Non-Deterministic Nature of Reasoning
In traditional observability, a specific input usually yields a predictable output. In agentic AI, the same prompt might lead an agent down three different reasoning paths across three different sessions. This makes "root cause analysis" exceptionally difficult. When an agent enters a "hallucination loop," it isn't always clear if the failure was caused by the base model's logic, a poorly phrased system prompt, or a misleading response from an external API.
3. High Cost and Latency of "Evaluators"
To observe an agent effectively, organizations often use "LLM-as-a-Judge" to evaluate the quality of the agent's steps. However, using a high-reasoning model (like GPT-4o or a specialized watsonx model) to monitor another model adds significant overhead. This creates a "monitoring tax," where the cost and time required to observe the agent can sometimes rival the cost of the agent’s actual task execution. Finding a balance between granular oversight and operational efficiency remains a key struggle.
4. Managing Context Window "Noise"
As agents engage in multi-step workflows, their context window, the "short-term memory" of the session, expands. Observability tools must track how this context evolves. A major challenge is identifying "context poisoning," where irrelevant data from a tool response or a previous reasoning error litters the memory, causing the agent to lose focus or drift from the original goal. Identifying exactly when the context became corrupted in a 20-step trajectory is a complex data needle-in-a-haystack problem.
5. Data Privacy and Security in Traces
Agentic observability requires capturing every interaction, including the data sent to and received from external tools. This often includes sensitive information, such as PII (Personally Identifiable Information) or proprietary corporate data. Ensuring that observability logs provide enough detail for debugging without creating a massive security liability is a delicate balancing act. Organizations must implement real-time redaction and governance layers, like those found in watsonx.governance, to protect data while maintaining transparency.
Agentic AI Observability vs Traditional Observability
The fundamental difference between traditional AI monitoring and agentic observability lies in the shift from transaction-based tracking to trajectory-based analysis. While traditional observability focuses on a "one-and-done" interaction, agentic observability must account for the iterative, non-linear nature of autonomous decision-making.
According to IBM’s framework, the distinctions can be broken down into four key dimensions:
1. Scope of Visibility: Point-in-Time vs. Lifecycle
- Traditional Observability: Primarily monitors the "request-response" pair. It tracks whether a specific input resulted in a coherent output, focusing on metrics like latency, token count, and basic sentiment for a single turn.
- Agentic Observability: Captures the entire execution trace. It treats the AI's operation as a continuous lifecycle. This includes the internal "monologue" (Chain of Thought), the delegation of tasks to sub-agents, and the feedback loops that occur before a final answer is ever reached.
2. The Nature of the "Black Box": Output vs. Reasoning
- Traditional Observability: Views the LLM as a black box where only the final result is evaluated. If the output is wrong, developers often have to guess why.
- Agentic Observability: Creates a "glass-box" environment. It decomposes the reasoning process into discrete steps, allowing developers to see exactly how an agent interpreted a goal, where it branched into a specific sub-task, and why it chose one tool over another.
3. Interaction Complexity: Static vs. Dynamic
- Traditional Observability: Monitors static data retrieval (like a simple RAG lookup). The interaction is predictable: the system fetches data and summarizes it.
- Agentic Observability: Monitors active tool orchestration. It tracks the "handshake" between the agent and external environments (APIs, databases, web browsers). It must validate not just the final text, but the technical validity of the tool calls and the agent’s ability to handle unexpected errors or "edge cases" from those tools.
4. Success Metrics: Accuracy vs. Efficiency and Intent
- Traditional Observability: Uses metrics like Grounding and Relevancy to judge the final text.
- Agentic Observability: Introduces Trajectory Evaluation. It measures Path Efficiency (did the agent take 10 steps for a 2-step task?) and Self-Correction (did the agent recognize a failed API call and pivot?). It evaluates whether the agent's multi-step "behavior" remained aligned with human intent and safety guardrails throughout the journey.
In summary, as IBM highlights, the move to agentic systems transforms observability from a "performance dashboard" into a forensic and governance tool. It moves beyond asking "What did the AI say?" to "What did the AI do, and was it authorized and efficient in doing so?"
Case Study: OpenClaw Observability with PuppyGraph
As autonomous agents navigate complex, multi-step workflows, the volume of execution data they generate can quickly become overwhelming. Even within a single-agent architecture, a trivial user prompt can trigger an expansive trajectory of internal reasoning and external tool invocations.
To showcase the power of Agentic AI observability, we have developed a demonstration built on OpenClaw. This demo illustrates how raw, opaque agent behaviors are synthesized into a transparent, auditable, and structured graph.

From JSON Logs to Graph Discovery
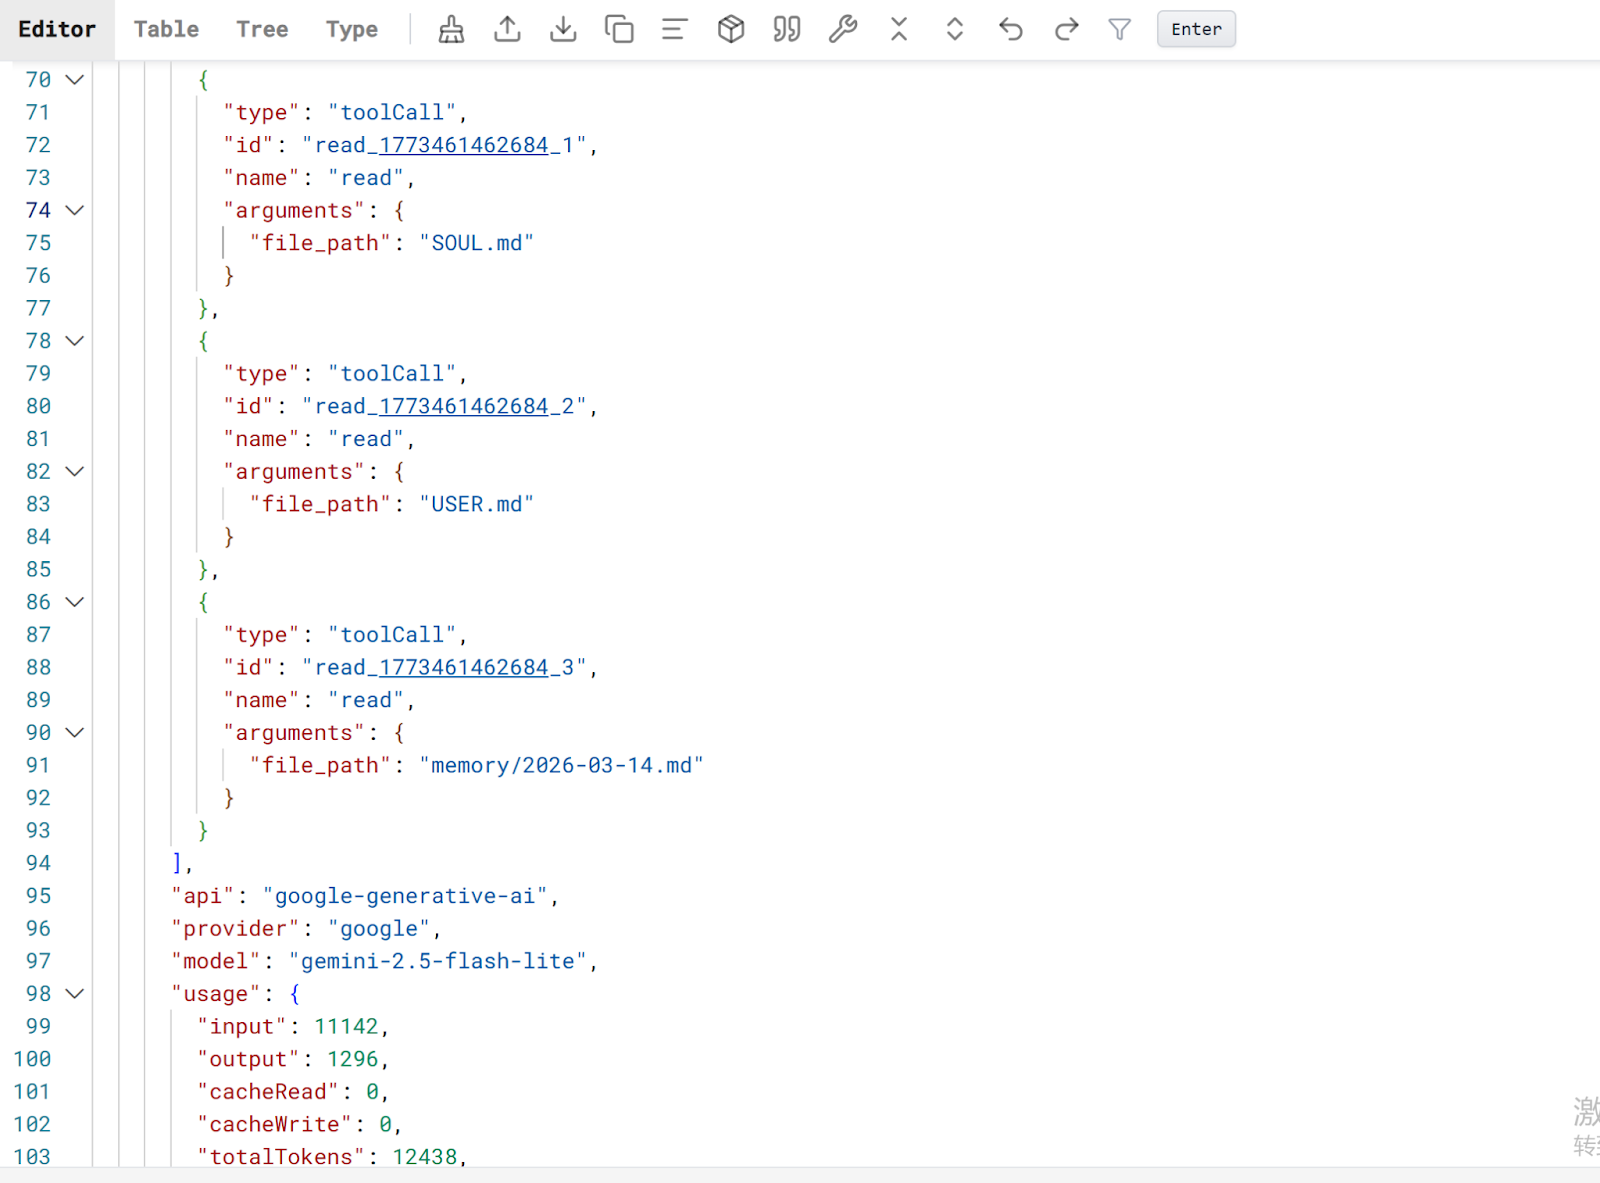
- Log Generation (Execution Traces)
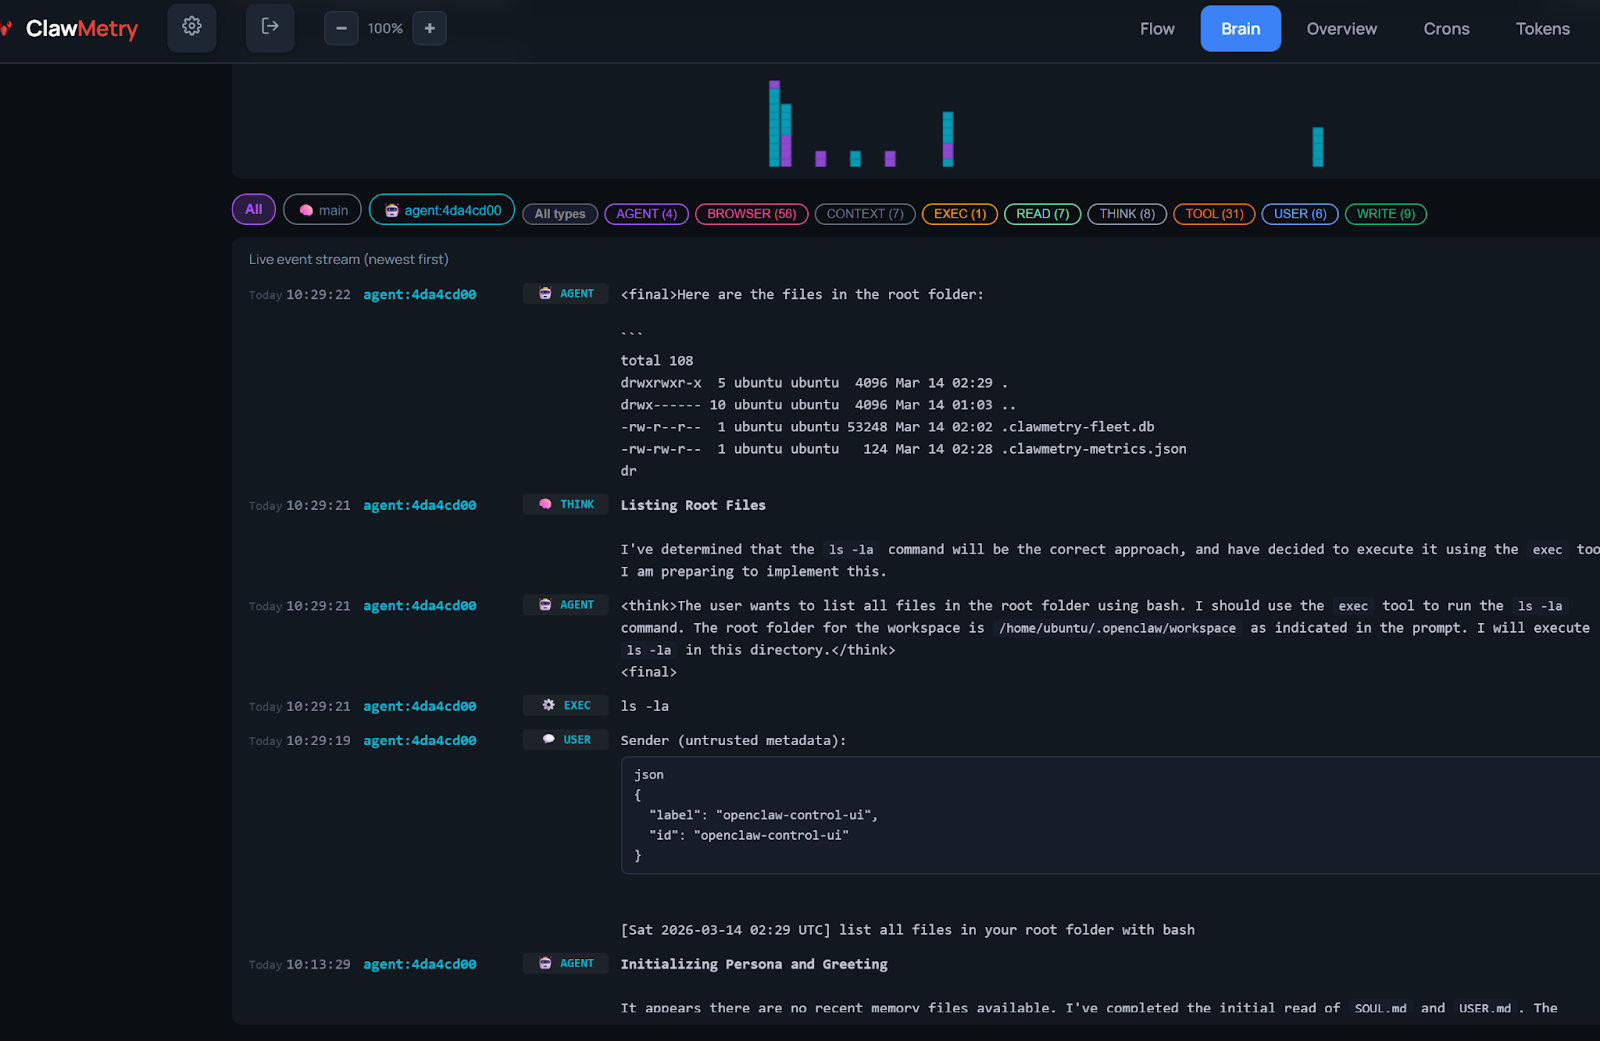
During an agent’s lifecycle, OpenClaw generates comprehensive logs that capture every "Chain of Thought" step and tool interaction. While ClawMetry is available as an optional tool for initial data analysis, the core observability data can be derived directly from the agent's raw log files.
- Data Ingestion (JSON to Iceberg)
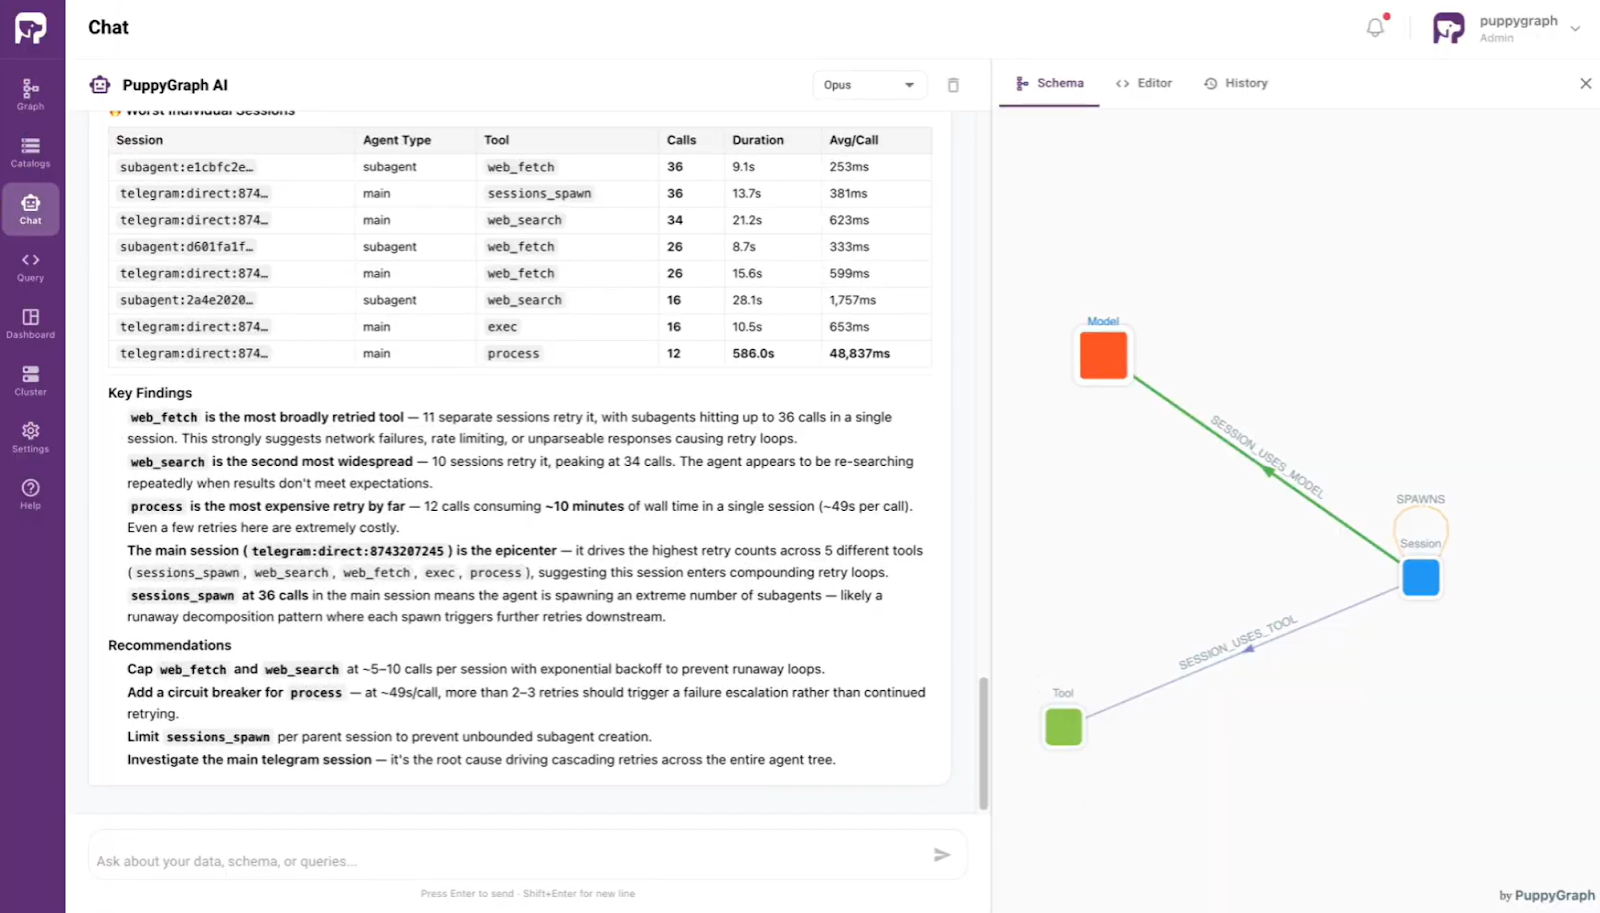
The workflow involves collecting these JSON-formatted logs and processing them for storage in a Data Lakehouse (such as Apache Iceberg). By moving from static JSON files to structured Iceberg tables, organizations can perform high-performance, versioned queries on historical agent behavior. - AI-Powered Analytics (PuppyGraph)
Since agentic workflows are inherently relational, where a reasoning step often links to multiple tool calls or downstream actions, PuppyGraph can map flattened Iceberg logs into visual execution trajectories, enabling precise analytics of complex action chains. This analysis is governed by an ontology, a formal abstraction layer that maps technical schemas to business entities, while ontology enforcement acts as a real-time gatekeeper to ensure all queries strictly adhere to defined logic rules. Leveraging this foundation, the built-in PuppyGraph AI assistant allows users to perform sophisticated observability tasks using natural language directly.
Conclusion
As autonomous agents become the primary interface between LLMs and enterprise data, the "monitoring" of yesterday is no longer sufficient. Agentic AI Observability is not merely a debugging luxury; it is the fundamental bridge between experimental prototypes and production-ready systems. By shifting the focus from what the AI said to how the AI acted, developers can mitigate the risks of "logic spirals," ensure reliable tool orchestration, and optimize the economic viability of multi-step trajectories.
The case study featuring OpenClaw and PuppyGraph illustrates that the future of this field lies in structured, relational analysis. Transforming opaque JSON logs into queryable graph data allows for a forensic understanding of agent behavior that traditional tables cannot provide. As the industry moves toward standardized schemas like OpenTelemetry, the ability to audit the "thoughts" of an agent will become the gold standard for safety and performance.
To begin your journey into transparent AI, explore the forever-free PuppyGraph Developer Edition, or book a demo to see high-performance agentic observability in action.

Hao Wu is a Software Engineer with a strong foundation in computer science and algorithms. He earned his Bachelor’s degree in Computer Science from Fudan University and a Master’s degree from George Washington University, where he focused on graph databases.

Get started with PuppyGraph!


Developer Edition
- Forever free
- Single noded
- Designed for proving your ideas
- Available via Docker install
Enterprise Edition
- 30-day free trial with full features
- Everything in developer edition & enterprise features
- Designed for production
- Available via AWS AMI & Docker install