

Data Warehouse Design: Steps & Best Practices for 2026
Good data warehouse design is the difference between a warehouse analysts trust and one they quietly route around. The hard part is rarely the technology. It is deciding what the business needs to measure, modeling those facts so queries stay fast and correct as data grows, and choosing an architecture that survives the next source system and the next class of question. This guide walks through the architecture layers, the Kimball and Inmon methodologies, the schema patterns, an eight-step design process, and the modern lakehouse and relationship-analytics concerns that older guides skip.
What is data warehouse design?
Data warehouse design is the practice of structuring a central analytical repository: defining its architecture layers, choosing a modeling methodology, and shaping the schemas that turn raw operational data into query-ready facts and dimensions. The goal is a single, consistent source of analytical truth that serves business intelligence and reporting without burdening the source systems that run the business.
That last point is the reason warehouses exist at all. Operational databases are tuned for OLTP systems: many small, concurrent reads and writes against a normalized schema. Analytics asks the opposite question, scanning millions of rows to aggregate a metric across years of history. Running both on the same database means the nightly reporting job competes with the checkout flow. Design separates the two: data is extracted from operational sources, integrated and conformed into a model built for analysis, and served to dashboards, ad-hoc SQL, and machine learning.
Design decisions compound. The architecture you pick determines how source data flows through staging and integration. The methodology determines whether you start from an enterprise-wide model or a single business process. The schema determines how a five-year-old query behaves after the grain of a table changes. None of these are reversible cheaply once dashboards and downstream models depend on them, which is why the design phase earns its own discipline rather than being folded into “just build the tables.”
Data warehouse architecture: the three-tier model
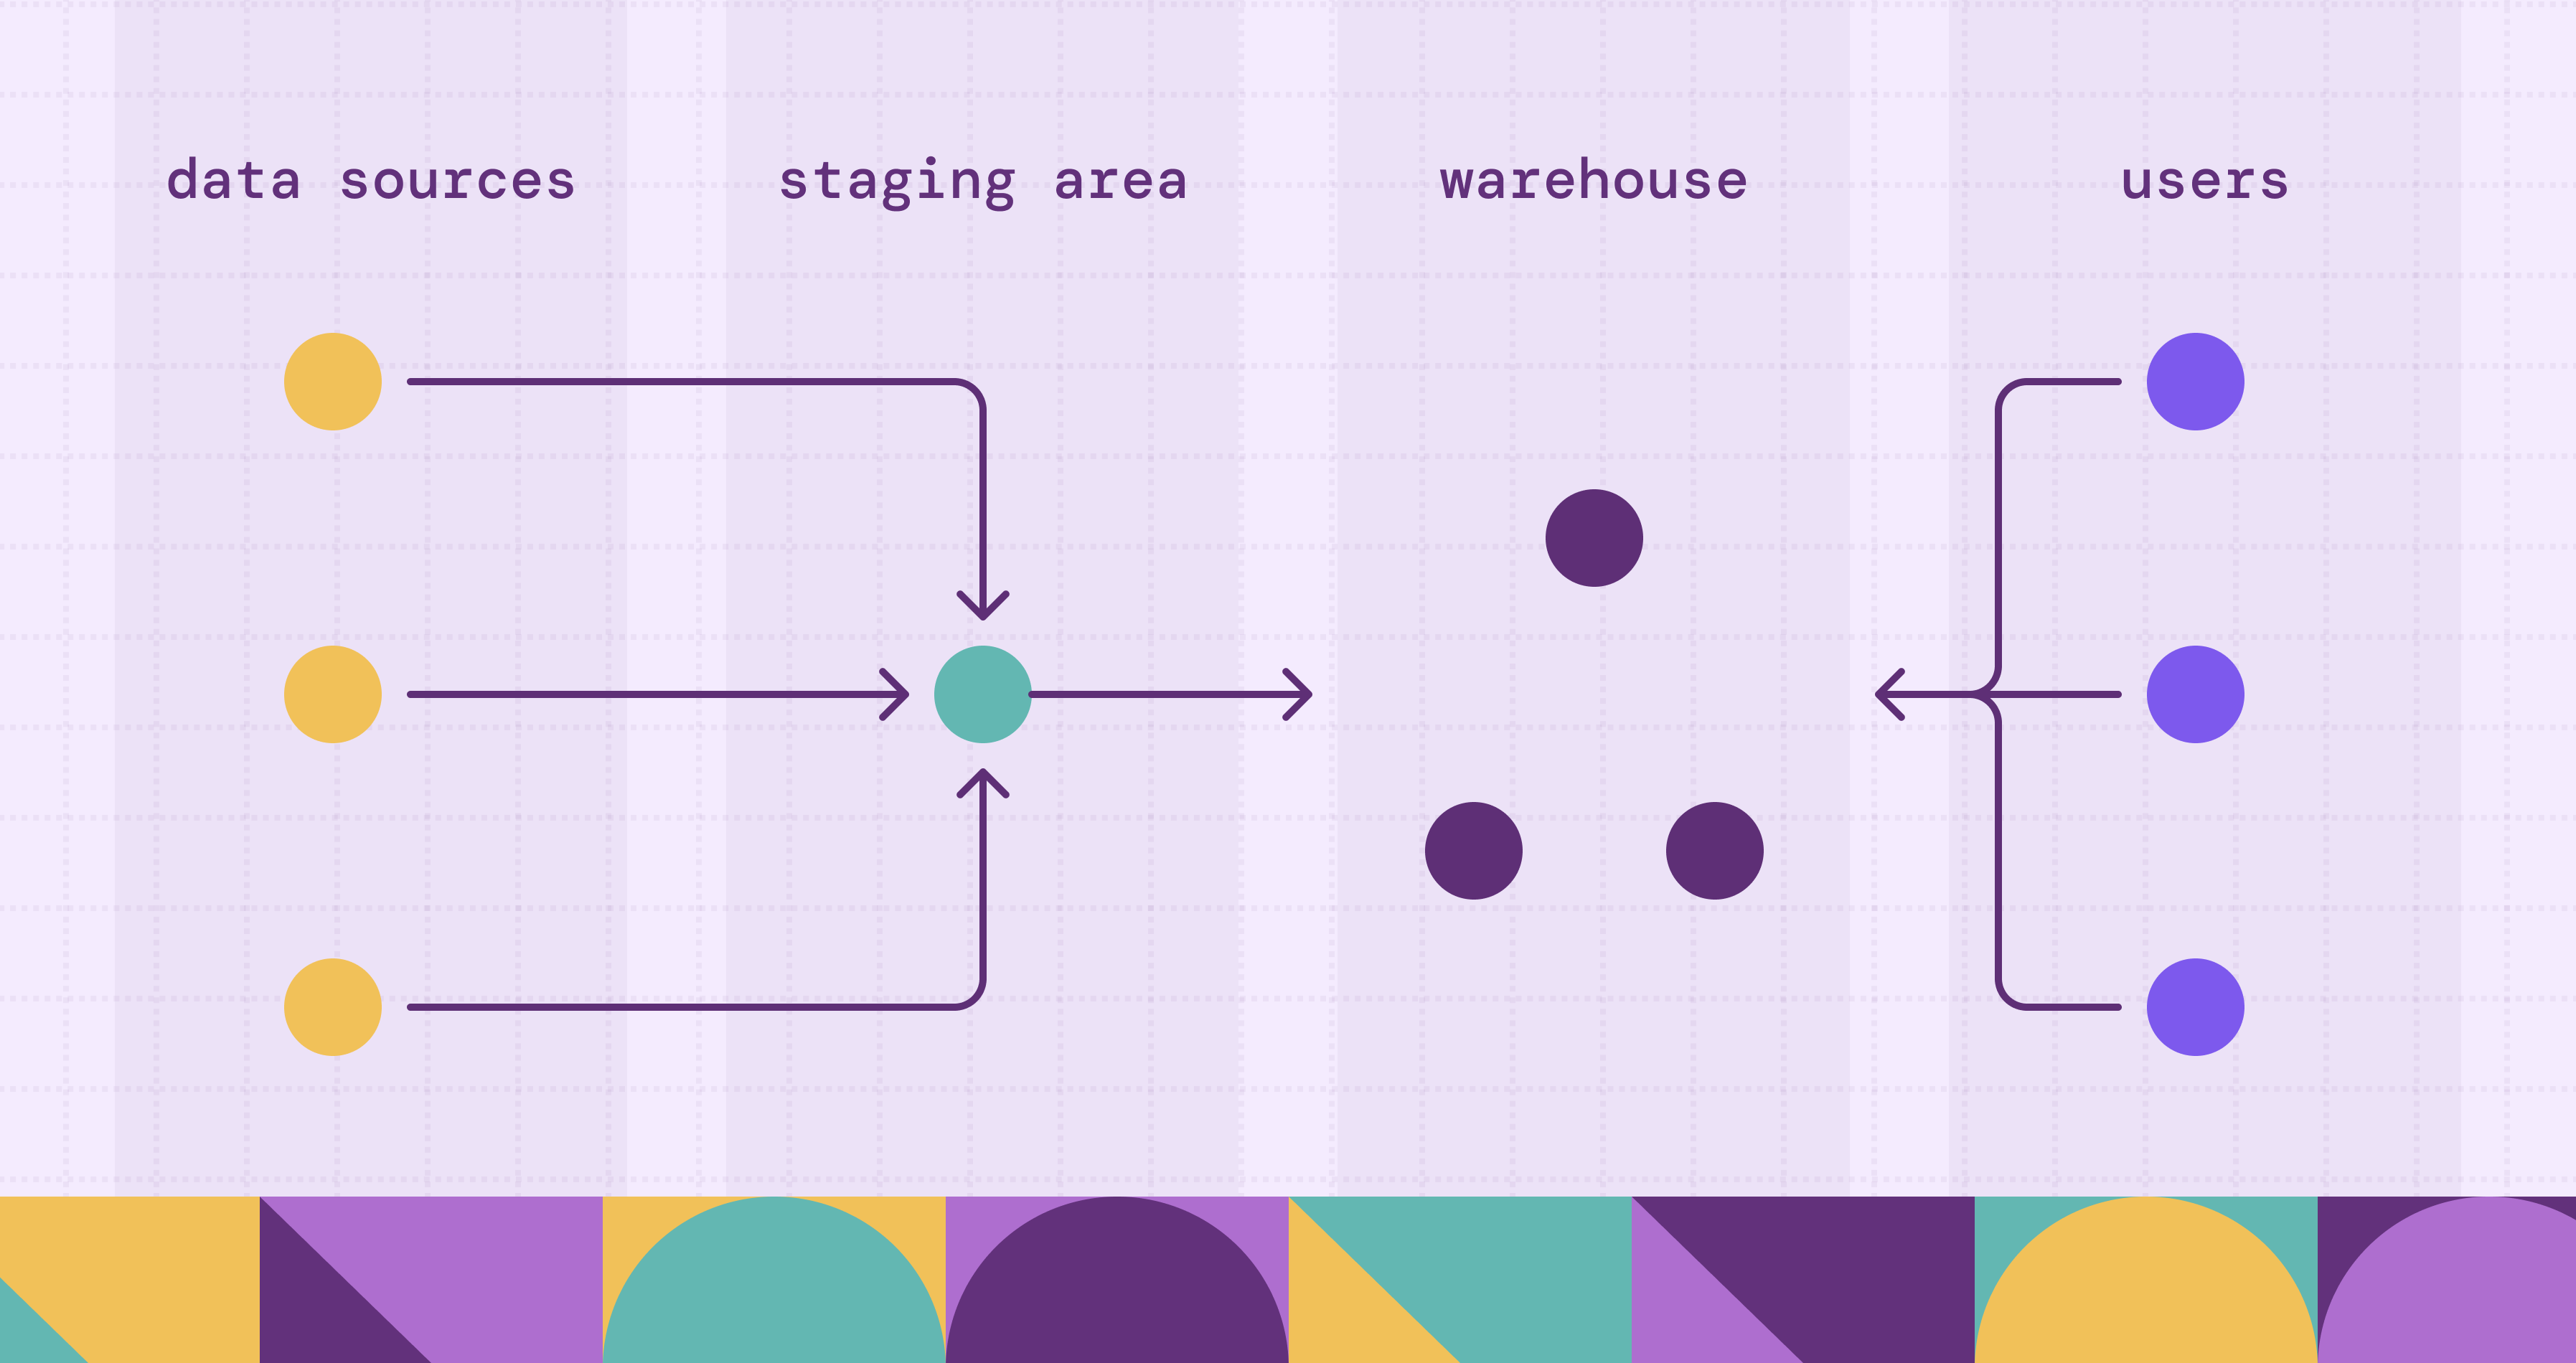
Most warehouses, on-premises or cloud, resolve to three logical tiers. The boundaries matter because each tier has a different job, a different failure mode, and often a different owner.
Staging layer
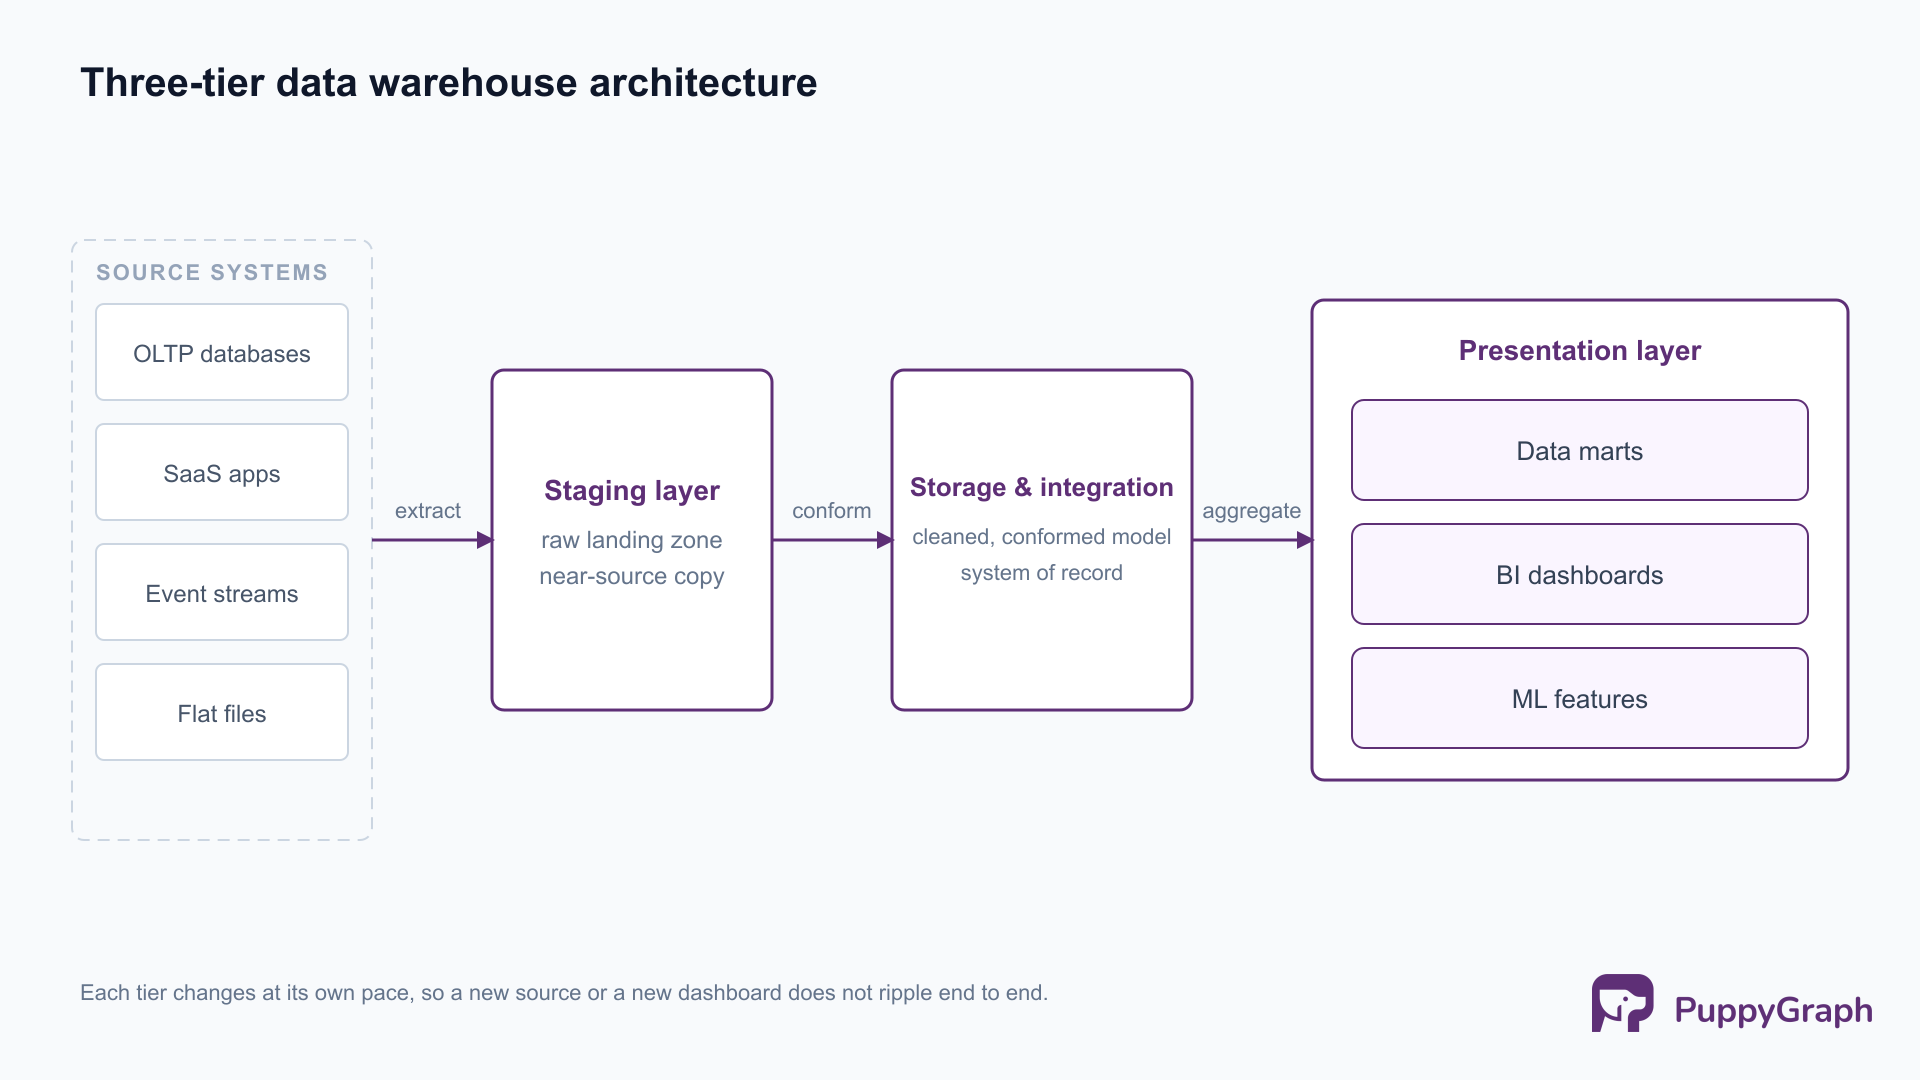
The staging layer is the landing zone. Data is extracted from operational databases, SaaS APIs, event streams, and flat files, and written here with minimal transformation, often as a near-raw copy. Keeping staging close to the source shape serves two purposes: extraction stays fast and decoupled from downstream modeling, and you retain an auditable record of what arrived before any business logic touched it. When a downstream number looks wrong, staging is where you confirm whether the source sent bad data or the transformation introduced it.
Storage and integration layer
This is the core of the warehouse, where data from many sources is cleaned, conformed, and integrated into a single coherent model. Conforming is the hard work: two source systems that both record “customer” rarely agree on keys, formats, or grain, and the integration layer is where those conflicts are resolved into one definition. The result is the system of record for analytics, the layer that earns the phrase “single version of truth.” Whether this layer is normalized or dimensional depends on the methodology you choose, covered in the next section.
Presentation and analytics layer
The presentation layer is what consumers actually query. It exposes the integrated data as subject-oriented data marts, dimensional models, and aggregates shaped for OLAP workloads: slicing, dicing, roll-ups, and drill-downs across business dimensions. This is the layer tuned for read performance and for the mental model of a business analyst, not a database administrator. Star schemas, pre-aggregated summary tables, and semantic models live here.
The three-tier split is not bureaucracy. It lets each layer change at its own pace: a new source system touches staging and integration without disturbing the marts; a new dashboard reshapes the presentation layer without re-extracting anything. A warehouse that collapses these tiers into one is faster to stand up and far more expensive to evolve, because every change ripples end to end.
Design methodologies: Kimball vs. Inmon (top-down vs. bottom-up)
Two methodologies have defined warehouse design for three decades, and most real warehouses are some blend of them. Bill Inmon’s Building the Data Warehouse argues for a top-down approach: build one normalized, enterprise-wide warehouse first (the Corporate Information Factory), then derive subject-specific data marts from it. Ralph Kimball’s The Data Warehouse Toolkit argues bottom-up: build dimensional data marts for individual business processes, and integrate them through conformed dimensions shared across marts (the bus architecture).
The trade-off is consistency versus time-to-value. Inmon front-loads the integration work and yields strong enterprise consistency, at the cost of a longer wait before the first dashboard ships. Kimball delivers usable analytics for one business process quickly, and relies on disciplined conformed dimensions to keep the marts from drifting into silos. Neither is wrong; they optimize for different organizational realities.
The fourth row matters more in 2026 than the textbook debate suggests. Agile data warehouse design is less a rival methodology than a delivery discipline layered on top of Kimball or Inmon: model in small vertical slices with the business users who will use the data, ship an increment, and refine. It exists because the biggest failure mode in warehouse projects is not picking the wrong schema; it is spending a year building to a requirements document that was stale before the first table loaded. The practical answer for most teams is a hybrid: a conformed, integrated core for consistency, dimensional marts for usability, delivered in agile increments.
Data modeling: star, snowflake, and data vault schemas
Methodology decides where you start; the schema decides how the tables are physically shaped. Dimensional modeling, the lingua franca of the presentation layer, organizes data into fact tables (the measurements of a business process, like a sale or a shipment) and dimension tables (the descriptive context: who, what, where, when). For deeper background on the relational foundations underneath, see relational schema design.
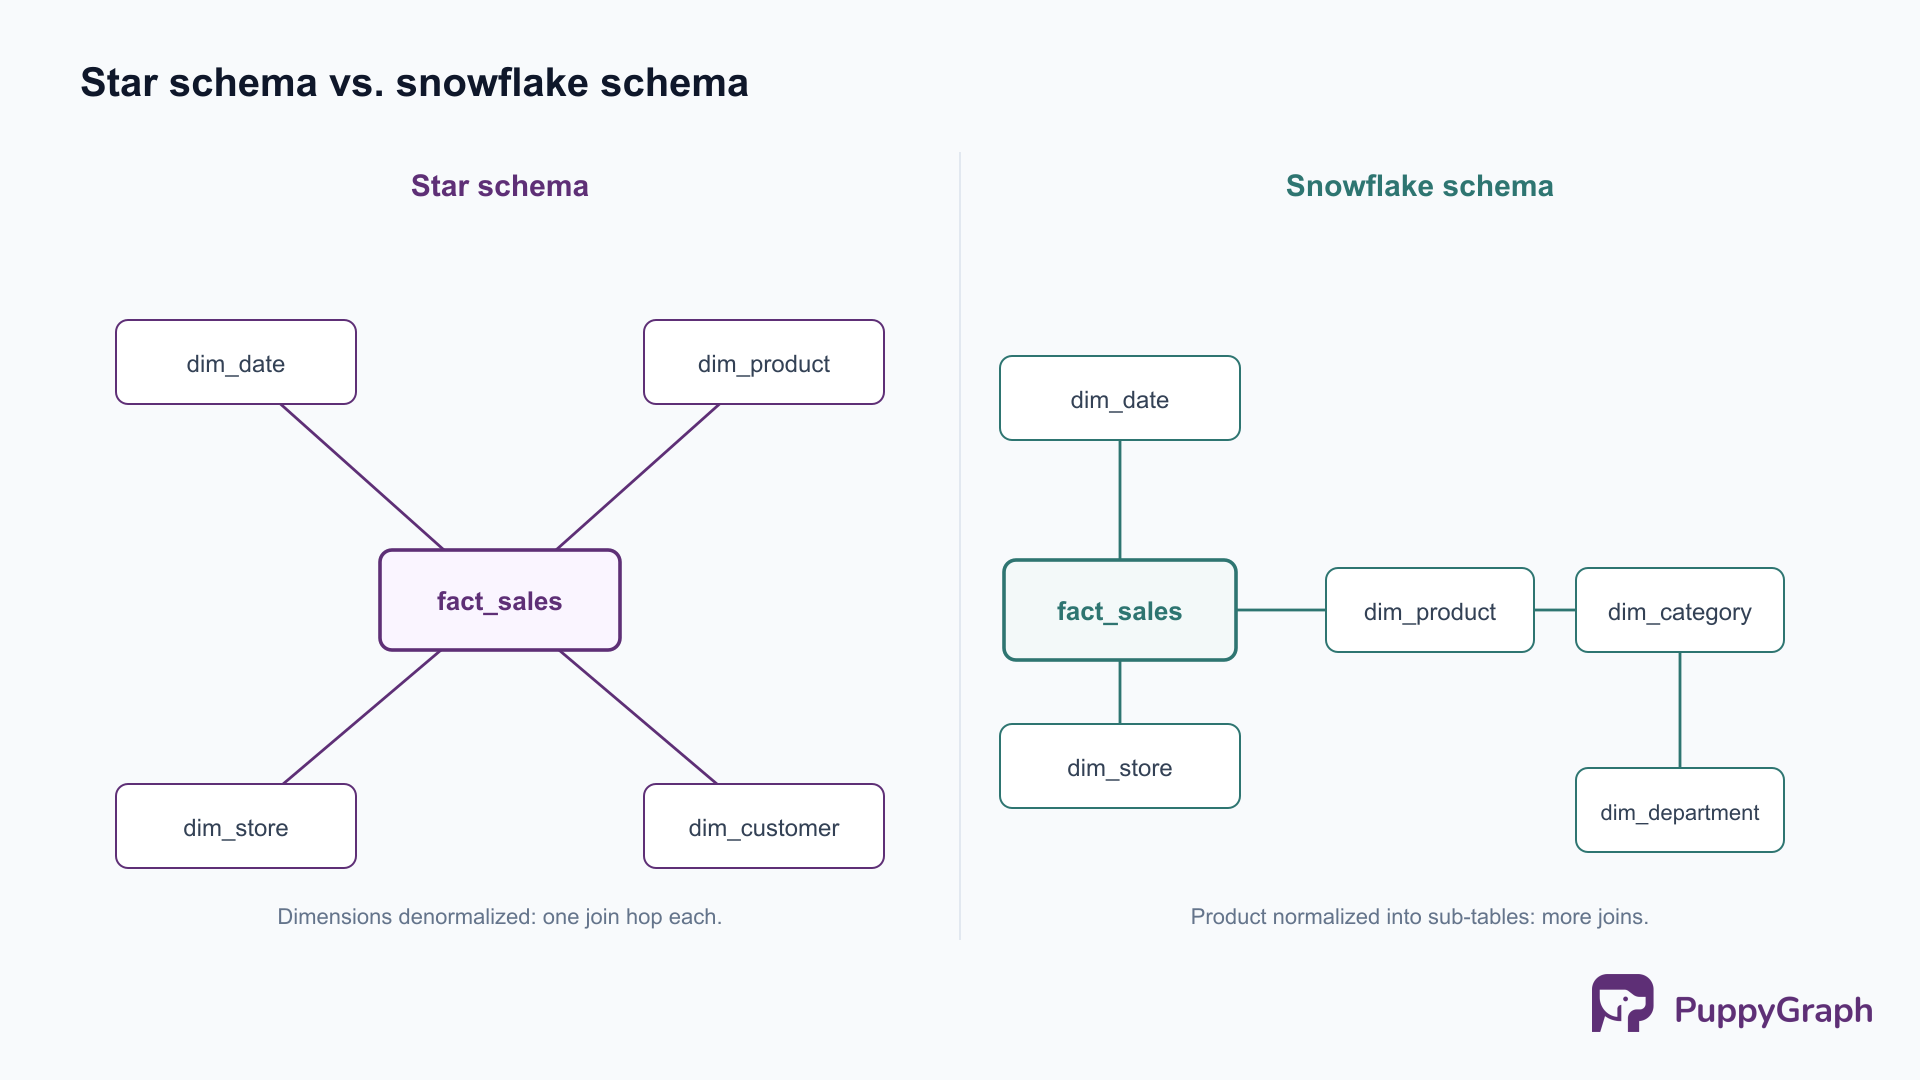
Star schema. A central fact table references a ring of denormalized dimension tables, one join hop away. It is the default for a reason: queries are simple, joins are shallow, and BI tools generate efficient SQL against it. The cost is some redundancy in the dimensions (a product’s category is repeated on every product row), which is usually a fair trade for query speed and clarity.
Snowflake schema. The dimensions are normalized into sub-dimensions, so a product dimension might split into product, category, and department tables. This removes redundancy and saves storage, at the cost of more joins per query and more complexity for both the optimizer and the analyst. On columnar cloud warehouses, where storage is cheap and wide scans are fast, the storage savings rarely justify the extra joins, so star schemas dominate in practice.
Data Vault. Data Vault 2.0 models the integration layer (not the presentation layer) around three constructs: hubs (business keys), links (relationships between keys), and satellites (time-variant descriptive attributes). It is built for auditability, parallel loading, and absorbing source change without rework, which makes it popular for the regulated, many-source enterprise core that then feeds Kimball-style marts. It is more work to model and query than a star schema, so reserve it for the integration layer where its strengths pay off, not for the marts analysts touch directly.
A concrete star schema makes the shape obvious. A retail sales fact table holds the measures and foreign keys to its dimensions:
CREATE TABLE fact_sales (
    sale_id        BIGINT,
    date_key       INT      REFERENCES dim_date(date_key),
    product_key    INT      REFERENCES dim_product(product_key),
    store_key      INT      REFERENCES dim_store(store_key),
    customer_key   INT      REFERENCES dim_customer(customer_key),
    quantity       INT,
    unit_price     DECIMAL(10,2),
    discount_amt   DECIMAL(10,2),
    sales_amount   DECIMAL(12,2)
);
One more concept governs how dimensions change over time: slowly changing dimensions (SCD). When a customer moves city, do you overwrite the old value (Type 1, no history), add a new row with validity dates and keep the old one (Type 2, full history), or add a column for the previous value (Type 3, limited history)? Type 2 is the common choice for any dimension where historical accuracy matters, because it lets a query reproduce what the world looked like at the time of each fact, rather than as it looks today.
How to design a data warehouse: 8 steps
Architecture and modeling are the what. This is the how: a sequence that takes a warehouse from business need to running system. The order is deliberate; skipping ahead to tables before requirements is the most common way projects derail.
1. Define business requirements
Start with the questions the business needs answered, not the data you happen to have. Interview the analysts and decision-makers who will use the warehouse, and capture the metrics, dimensions, and grain they reason about. A retail team that needs to compare same-store sales week over week is describing a fact grain (one row per store per day) and a set of dimensions (store, date, product) before a single table exists. Requirements drive everything downstream.
2. Evaluate and profile source systems
Catalog the operational databases, SaaS applications, event streams, and files that hold the source data, then profile them for quality: nulls, duplicates, inconsistent keys, and conflicting definitions across systems. This step sets realistic expectations. If two systems disagree on what a “customer” is, you will resolve that in the integration layer, and it is far cheaper to discover the conflict now than after the marts are built.
3. Choose the architecture
Decide the tiering and where data will physically live: cloud warehouse, lakehouse, or hybrid. Settle the methodology blend (typically a conformed core plus dimensional marts) and how raw, integrated, and presentation data are separated. This is the decision that is most expensive to reverse, so make it with the next two or three years of sources and workloads in mind, not just today’s.
4. Design the data model
Translate requirements into facts and dimensions. Fix the grain of each fact table first, because grain determines everything else, then define conformed dimensions shared across business processes so marts can be joined consistently. Decide the SCD strategy per dimension. This is where Kimball or Inmon stops being a diagram and becomes specific tables.
5. Pick the stack (cloud vs. on-prem)
Choose the platform and tools: a cloud warehouse like Snowflake, BigQuery, or Redshift, a lakehouse on Databricks or Apache Iceberg, or an on-premises system where data residency or existing investment requires it. Most new builds are cloud-first for elastic compute and separation of storage from compute, but the right answer follows the requirements and constraints, not fashion.
6. Build the ELT pipelines
Implement the extract-load-transform flows that move data from sources through staging into the integration and presentation layers. Modern cloud stacks favor ELT over ETL: load raw data into the warehouse first, then transform in-warehouse with SQL where the compute is cheap and scalable. Build for incremental loads from the start; full reloads that work at gigabytes quietly break at terabytes.
7. Establish quality and governance
Add data quality tests, freshness checks, and validation at each layer, and put governance in place: ownership, access controls, definitions, and lineage. A warehouse is only as trusted as its worst surprise, so make quality failures visible early rather than letting a silently wrong number reach a dashboard.
8. Deploy, test, and monitor
Validate the warehouse against the original business questions, load-test it at realistic volume, and instrument it for ongoing monitoring of freshness, pipeline failures, and query performance. Deployment is not the finish line; it is the point at which the warehouse starts accumulating the schema drift, new sources, and new questions that the design has to keep absorbing.
Modern design considerations: lakehouse, cloud, and real-time
The three-tier model and the Kimball/Inmon debate predate the cloud, and most current guides stop there. The modern warehouse adds several concerns that change design decisions in practice.
The lakehouse and open table formats. The sharp line between data lake and data warehouse has blurred into the data lakehouse architecture: warehouse-style tables, transactions, and schema enforcement layered directly over cheap object storage using open table formats. Apache Iceberg and Delta Lake bring ACID transactions, schema evolution, and time travel to data that lives as open files in S3 or equivalent, queryable by many engines rather than locked into one vendor. The format choice has real design consequences; see Apache Iceberg vs Delta Lake for the trade-offs.
Cloud warehouses and separation of storage from compute. Snowflake, BigQuery, and Redshift (on RA3 or managed storage) decouple storage from compute, so you size and pay for query power independently of data volume. This relaxes old design constraints: heavy denormalization to avoid joins matters less when compute scales elastically, and the storage savings from a snowflake schema matter less when storage is cheap. Design for clarity and correctness first; the platform absorbs more of the performance tuning than on-premises systems ever did.
Real-time and machine learning. Batch nightly loads are no longer the only mode. Streaming ingestion, micro-batch transforms, and change-data-capture push fresher data into the warehouse, and the same tables increasingly feed machine learning features alongside BI dashboards. Designing for both means thinking about freshness service levels and feature reproducibility, not just report latency.
These shifts modernize the warehouse without overturning the fundamentals: requirements still drive the model, conformed dimensions still prevent silos, and grain still governs the facts. What changes is that the platform removes constraints the old guides spent pages working around.
When relationships outgrow tables: graph analytics on your warehouse
There is a class of question a well-designed warehouse handles poorly, and it is worth naming because no amount of schema tuning fixes it. Dimensional models excel at aggregation: sum, count, and group across dimensions. They struggle with deep relationship traversal: questions that hop from entity to entity to entity. Find every account within four transfers of a flagged one. Trace a data quality issue upstream through every transformation that fed a column. Map the shared-device, shared-address, shared-payment links that reveal a fraud ring rather than an isolated bad actor.
Expressed in SQL, each of these is a chain of self-joins whose length you have to know in advance, and whose cost climbs sharply with each additional hop. The relational model can represent the relationships; it just makes traversing them expensive and awkward, because joins were designed to combine tables, not to walk a network. Teams hit this wall and historically had one answer: stand up a separate graph database, build a second ETL pipeline to copy warehouse data into it, and maintain two systems that drift out of sync.
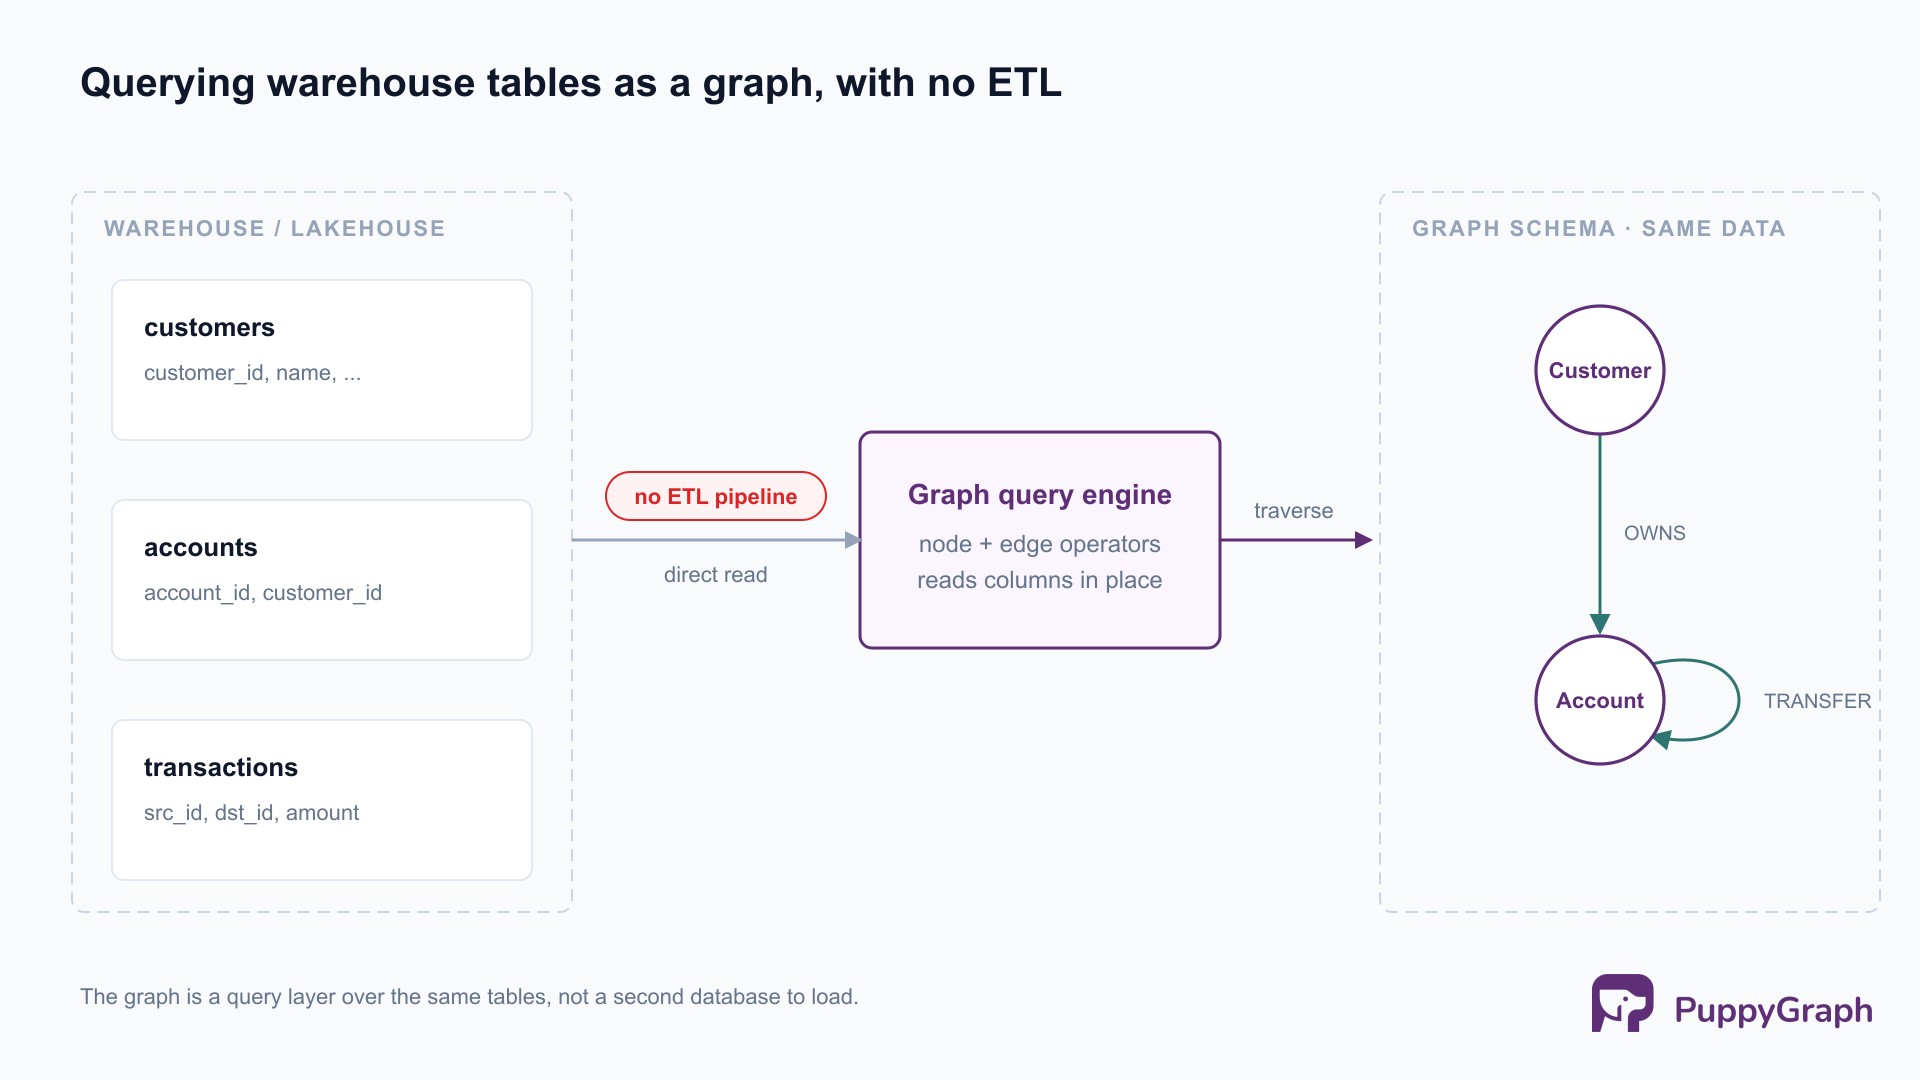
PuppyGraph takes a different path: it queries the data already in your warehouse or lakehouse as a graph, with no ETL and no second copy. You define a graph schema that maps existing tables to nodes and edges (a customer table becomes customer nodes, a transactions table becomes edges between them), and then query it with openCypher and Gremlin. Because it connects directly to the storage layer, the warehouse you designed in the previous sections stays exactly as it is; the graph is a query layer over those same tables, not a new database to load.
The four-hop question that was a brittle stack of self-joins becomes a direct pattern match:
MATCH (flagged:Account {status: 'flagged'})
      -[:TRANSFER*1..4]-(linked:Account)
RETURN DISTINCT linked.account_id
Architecturally, this works because PuppyGraph is a graph query engine in its own right, not a translation front-end that rewrites graph queries into SQL and pushes them down to the warehouse. It compiles a query into a plan of node and edge operators and executes the traversal in its own distributed, columnar engine, reading only the columns it needs from the underlying tables. Multi-hop traversals and pattern matching are what that engine optimizes for, which is precisely the workload a relational planner handles least gracefully. It connects to the stores warehouses already use, including Apache Iceberg, Snowflake, Databricks, PostgreSQL, and MySQL, and is used by Coinbase, eBay, and AMD.
The honest framing is complementary, not a replacement. Graph analytics is for relationship-heavy, multi-hop workloads; it is not a substitute for the dimensional models that power BI. The design implication is simply that you no longer have to choose at architecture time. Design the warehouse with standard methodology for the aggregation workloads it is good at, and add a graph layer over the same tables when the multi-hop questions arrive, rather than re-platforming or running a parallel graph database to answer them.
Best practices and common pitfalls
Best practices
Drive design from business requirements, not source data. The warehouses that get used are the ones modeled around the questions people ask. Start from metrics and grain, and let the data model serve them.
Deliver incrementally. Ship a conformed slice, prove its value, and expand. Incremental delivery surfaces wrong assumptions while they are still cheap to fix, and it keeps stakeholders engaged instead of waiting a year for a big reveal.
Govern and document as you build. Definitions, ownership, and access controls are not a cleanup phase. Capture data lineage tracking so that when a number is questioned, you can trace it from dashboard back to source without forensic archaeology.
Conform dimensions early. Shared, consistent dimensions are what keep independent marts from becoming independent silos. This is the single most important discipline in a Kimball or hybrid build.
Common pitfalls
The big-bang build. Designing the entire enterprise warehouse before delivering anything is the classic failure mode. Requirements drift, sponsors lose patience, and the first delivery lands against stale needs. Incremental delivery is the antidote.
Ignoring source data quality. A warehouse cannot be cleaner than its sources. Skipping the profiling step in section two means quality problems surface later, in dashboards, where they cost trust rather than just time.
Over-normalization in the presentation layer. Normalizing the analytics-facing model to eliminate every redundancy optimizes for a constraint, storage, that cloud warehouses have largely removed, while adding joins that slow every query and complicate every analyst’s life. Reserve heavy normalization for the integration layer; keep the presentation layer dimensional.
Designing only for today’s questions. A warehouse modeled exclusively around current BI dashboards will meet the relationship-heavy and machine learning workloads of next year poorly. Designing with both aggregation and traversal in mind, as the previous section argued, is part of designing for tomorrow.
FAQ
What is data warehouse design? Data warehouse design is the practice of structuring a central analytical repository: its architecture layers, modeling methodology, and schemas. The aim is a consistent, query-ready source of truth that serves business intelligence and analytics without loading the operational systems that run the business.
How do you design a data warehouse step by step? Define business requirements, evaluate and profile source systems, choose the architecture, design the data model (facts, dimensions, grain, and SCD strategy), pick the platform, build the ELT pipelines, establish quality and governance, then deploy, test, and monitor. The order matters: requirements come before tables.
What is the difference between Kimball and Inmon? Inmon is top-down: build a normalized enterprise warehouse first, then derive data marts. Kimball is bottom-up: build dimensional marts per business process and integrate them through conformed dimensions. Inmon favors enterprise consistency; Kimball favors faster time-to-value. Most real warehouses blend the two.
Star schema or snowflake schema, which should I use? Star schemas are the default on modern cloud warehouses: shallow joins, simple queries, and fast BI. Snowflake schemas normalize dimensions to save storage, but on columnar cloud platforms where storage is cheap, the extra joins rarely pay off. Reach for snowflake only when a dimension’s redundancy is genuinely costly.
Is the data lakehouse replacing the data warehouse? The lakehouse merges the two rather than replacing the warehouse outright: warehouse-style tables, transactions, and governance over open table formats on cheap object storage. The design fundamentals (requirements-driven models, conformed dimensions, correct grain) carry over; the storage and engine layer is what changes.
Can a data warehouse handle graph or relationship queries? Warehouses handle aggregation well and deep multi-hop relationship traversal poorly, because those queries become long chains of self-joins. You can add graph capability without a second database by querying the warehouse tables as a graph; design the warehouse normally and layer graph analytics on top for the relationship-heavy questions.
Conclusion
Good warehouse design is less about the platform than about the decisions that outlive it: requirements that drive the model, a methodology blend that balances consistency against time-to-value, schemas with the right grain, and an architecture that absorbs new sources and new questions instead of breaking on them. The cloud and the lakehouse have removed many of the old performance constraints, which frees design to optimize for clarity and correctness. The questions are also broadening: alongside the aggregation workloads warehouses were built for, relationship-heavy and machine learning workloads are now part of the design target, and the strongest designs anticipate both rather than re-platforming when the second arrives.
Try the forever-free PuppyGraph Developer Edition and book a demo with the team to see how openCypher and Gremlin queries run over warehouse and lakehouse tables, with no graph-specific ETL, alongside the dimensional models your BI tools already use.

Sa Wang is a Software Engineer with exceptional mathematical ability and strong coding skills. He holds a Bachelor's degree in Computer Science and a Master's degree in Philosophy from Fudan University, where he specialized in Mathematical Logic.

Get started with PuppyGraph!


Developer Edition
- Forever free
- Single noded
- Designed for proving your ideas
- Available via Docker install
Enterprise Edition
- 30-day free trial with full features
- Everything in developer edition & enterprise features
- Designed for production
- Available via AWS AMI & Docker install