

Graph Analytics in Big Data: Concepts and Examples
Graph analytics is gaining traction for its ability to analyze relationships between entities, uncovering patterns that traditional methods often miss. As companies become more data-driven, the ability to understand how information is connected plays a growing role in shaping decisions. This need becomes even more pressing with big data, where growing volume and complexity demand scalable infrastructure and specialized tools. While graph analytics provides a powerful framework, applying it at scale brings unique technical challenges. In this blog, we’ll explore what graph analytics is, how it compares to traditional approaches, and the challenges and innovations driving the field.
What is Graph Analytics in Big Data?
With the sheer volume of data generated today, graph analytics and big data are often discussed together. Both play a critical role in helping organizations make sense of complex, large-scale information. But to understand how they work and why they matter, it's useful to explore each concept on its own before looking at how they intersect.
What is Graph Analytics?
Graph analytics is the process of discovering, interpreting, and communicating patterns within relationships. It works by traversing graphs, which represent the relationships that naturally exist in data by mapping entities as nodes and their connections as edges. These graphs capture not only whether a connection exists, but also its direction and strength. Graph analytics helps answer questions like: Who are the most influential people in a network? What paths connect two entities? Where are clusters or anomalies forming?
It operates at multiple levels, examining both pairwise connections and the overall structure of the graph. This ability to uncover both local and global patterns makes it a powerful tool for analyzing connected data.
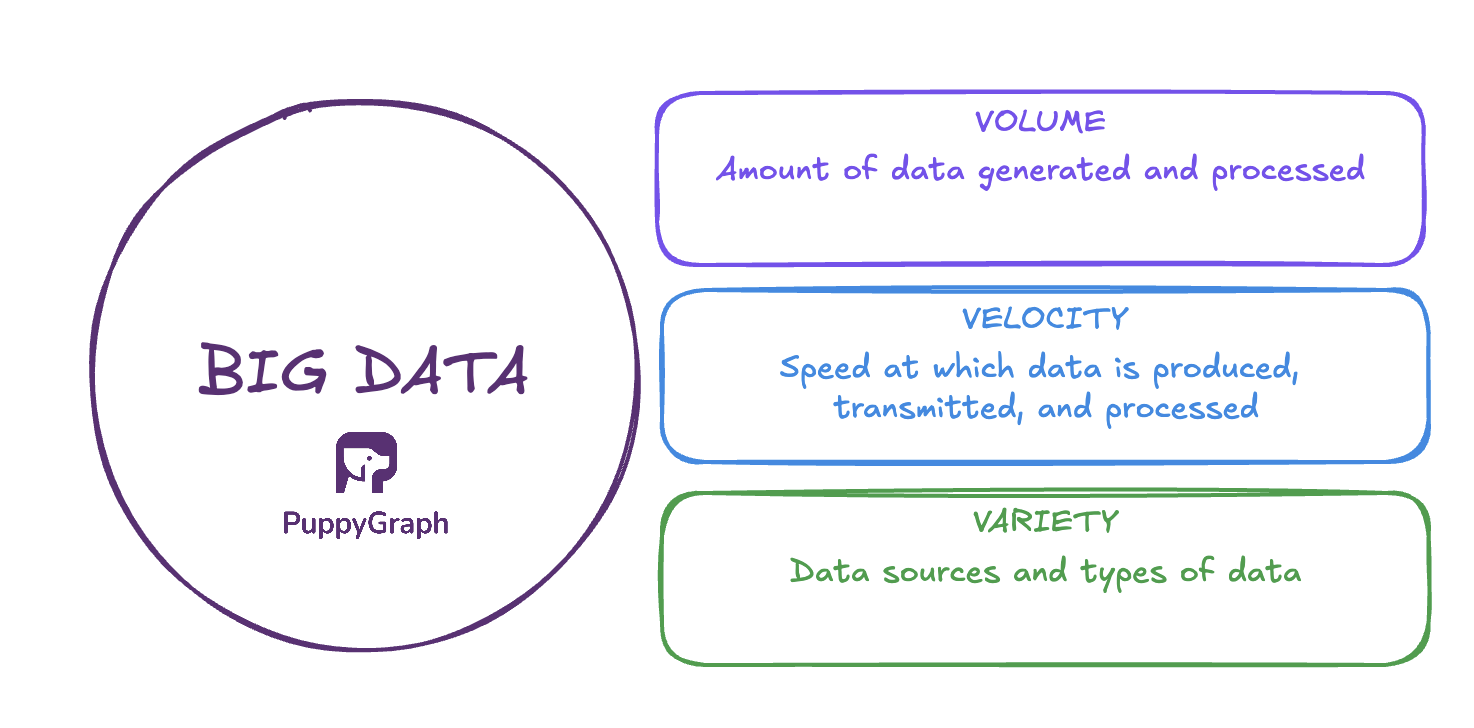
What is Big Data?
While size is certainly a defining factor, big data involves more than just working with larger datasets. The definition of big data is commonly framed around three attributes: Volume, velocity, and variety.
Volume refers to the sheer amount of data generated and processed, from transactions and user activity to logs, sensors, and connected devices. There’s no fixed threshold for what qualifies as “big.” Instead, it is generally defined by whether the data volume exceeds the capacity of a single machine to process it in a reasonable amount of time. As a result, the definition shifts with technological advances. Today, volumes are commonly measured in terabytes, petabytes, or more.
Velocity describes the speed at which data is produced, transmitted, and processed. With the rise of modern stream processing frameworks, real time has become literal. Processing times can now be measured in microseconds rather than hours or days. This shift has raised expectations around speed to insight, particularly in sectors like finance and cybersecurity, where even brief delays can lead to missed opportunities, financial loss, or increased risk.
Variety refers not only to the growing number of data sources, but also to the different types of data organizations must store and analyze. These typically fall into three categories: structured (e.g., spreadsheets, SQL databases), unstructured (e.g., images, audio, free-form text), and semi-structured (e.g., JSON, XML, log files). This diversity adds complexity to data pipelines, requiring tools that can handle a wide range of formats and schemas.
Together, these characteristics introduce new challenges for storage, processing, and analysis, which traditional systems aren't always equipped to handle.
Graph Analytics vs Traditional Analytics
Graph Data Model vs Relational Data Model
In graph analytics, queries are run on graphs, where information is stored as nodes and edges. This structure is ideal for analyzing patterns in complex, interconnected systems and understanding how entities relate to one another. As a result, graph analytics focuses on relationships and tends to ask questions such as: Who is connected to whom? What is the shortest path between two entities? Where are the clusters or influential nodes in a network?
Traditional analytics operates on rows and columns within relational databases and focuses more on individual records and aggregations. It is well-suited for numerical analysis, supporting questions like: What is the total number of sales last month? What is the average response time per support ticket? How many users signed up each day? These types of queries are central to dashboards, reports, and business metrics.
Each approach reflects a different way of organizing and querying data, depending on the types of insights required.
Graph Traversal vs Table Joins
In graph analytics, performance tends to scale with the number of relationships traversed rather than the total size of the dataset. It excels at tasks like graph traversal and subgraph matching, where the focus is on exploring how entities are connected. This makes graph analytics particularly effective for use cases involving deep or complex relationships, where traditional analytics might slow down due to heavy join operations or recursive logic.
Traditional analytics performs best on structured data with simple, well-defined relationships. Relational databases are highly efficient for filtering, aggregating, and joining across a few tables, and they perform reliably in environments that require consistency and transactional integrity.
Each model supports a different style of thinking. Graph models are optimized for relationship-driven analysis, while relational models are best for structured, tabular data and straightforward aggregations. Choosing the right model depends on the kinds of questions you're trying to answer.
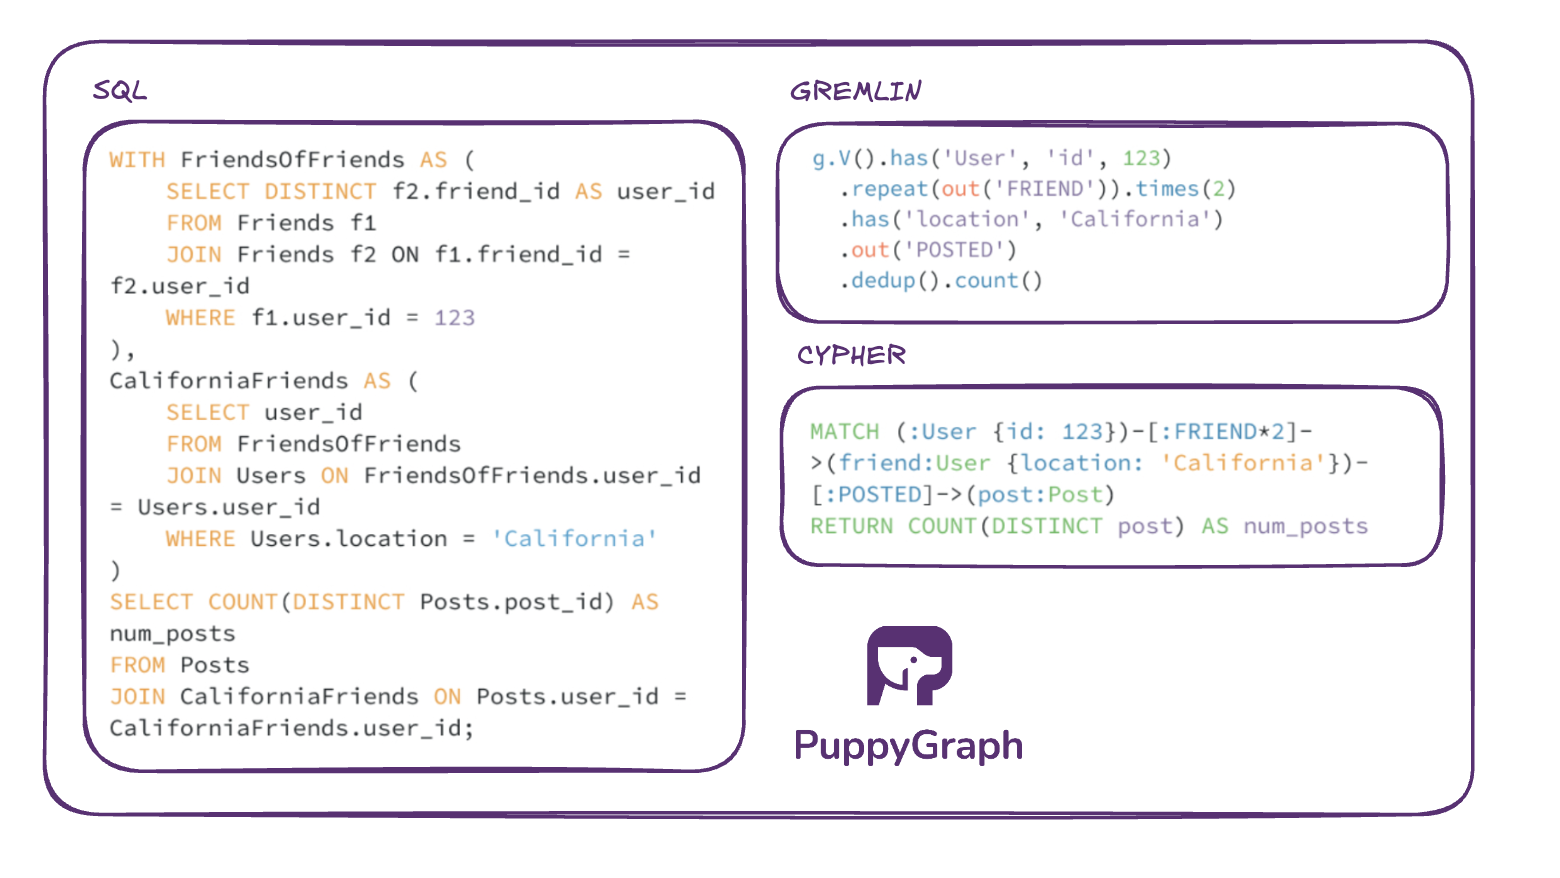
Graph Query Languages vs SQL
Graph analytics uses query languages like Cypher and Gremlin, which are designed specifically for navigating and analyzing relationships. These languages work directly with nodes and edges and support intuitive pattern matching, making it easier to express multi-hop traversals and structural queries. Because their syntax closely mirrors the structure of the graph itself, graph queries tend to be more readable and align naturally with how we conceptualize connections.
In contrast, SQL is the dominant query language in traditional analytics. It focuses on retrieving and aggregating data from structured tables, operating on rows and columns. Relationships between entities are not stored explicitly but are reconstructed through foreign key references and JOIN operations, which can become complex as the number of relationships increases.
To illustrate the difference, we’ll use a complex, multi-hop social network query:
How many unique posts were made by friends-of-friends of a specific user, but only if those friends-of-friends are located in California?
Types of Graph Analytics in Big Data
Graph analytics draws on a rich set of algorithms developed over decades of graph theory research. In fact, graph analytics tools often come built-in with many of these algorithms. In this section, we’ll explore different types of graph analysis, the kinds of insights they help uncover, and list some algorithms commonly used for each. If you're interested in a deeper dive into how these algorithms work, feel free to check out our blog on graph algorithms.
Centrality
Centrality algorithms measure the importance or influence of individual nodes within a network based on their position and connections. This type of analysis is useful for identifying key entities in a system, such as influential users in a social network, critical infrastructure points, or priority targets for information flow or intervention. Different measures of centrality exist because importance can be defined in various ways. Common algorithms include PageRank, betweenness centrality, closeness centrality, and eigenvector centrality.
Clustering
Clustering algorithms detect groups of nodes that are more strongly connected to each other than to the rest of the network. These clusters often reveal patterns that are not immediately obvious, such as functional groupings in biological networks, communities in social graphs, or tightly linked pages on the web. Clustering helps uncover natural divisions in the data and is often used in recommendation systems, segmentation, and anomaly detection. Common algorithms include Louvain algorithm, Label Propagation, and Weakly Connected Components.
Graph Embeddings
Graph embedding algorithms convert nodes into vector representations that capture their structural role and relationships within the graph. This transformation maps each node to a lower-dimensional space, making it possible to apply traditional machine learning techniques such as classification, clustering, and anomaly detection. Embeddings are particularly useful when working with large or complex graphs, where raw structure is difficult to analyze directly. They also support tasks like link prediction by estimating the likelihood of new or missing connections between nodes based on learned patterns. Common approaches include DeepWalk and Node2Vec.
Pathfinding
Pathfinding algorithms identify the shortest or most efficient routes between nodes in a graph. This type of analysis is commonly used in applications such as social network analysis, routing, logistics, and knowledge graph traversal. It helps uncover how information flows, how entities are connected, and which paths are most relevant or optimal. Pathfinding is especially useful in large graphs where manual inspection or brute-force methods are impractical. Common algorithms include Dijkstra’s algorithm, Longest Path in a Directed Acyclic Graph, and the Bellman-Ford algorithm.
Graph Analytics in Big Data Examples
Graph analytics becomes especially powerful when applied to large-scale, real-world datasets where relationships play a central role. In this section, we’ll walk through several graph analytics examples to show how different industries use graph techniques to uncover insights that would be difficult to detect with traditional analysis methods.
Social Networks
- Identifying influential users using centrality algorithms like PageRank or betweenness centrality.
- Detecting communities through clustering algorithms such as Louvain or Label Propagation.
- Recommending connections based on mutual relationships or shared interaction paths.
Supply Chain Optimization
- Analyzing bottlenecks by ranking nodes with high betweenness or degree centrality.
- Segmenting suppliers or facilities through clustering to identify dependency patterns.
- Finding shortest delivery routes using Dijkstra’s algorithm or Bellman-Ford.
Cybersecurity
- Revealing high-risk assets using centrality and connectivity metrics.
- Detecting compromised systems through anomaly-based analysis of network graphs.
- Mapping lateral movement by tracing access paths between users, devices, and endpoints.
Financial Services
- Ranking high-risk entities using centrality metrics based on transaction volume or network position.
- Predicting potential fraud by applying link prediction to uncover likely but unobserved account relationships.
- Detecting money laundering by tracing indirect connections across accounts, transactions, and intermediaries.
Healthcare
- Identifying patterns in care delivery by analyzing relationships between patients, conditions, and treatments.
- Understanding disease progression by applying centrality and embedding techniques to patient and clinical data.
- Supporting clinical decisions by traversing biomedical knowledge graphs to find relevant drugs, studies, or genetic links.
Future of Graph Analytics in Big Data
As data grows more complex and interconnected, graph analytics is becoming a core part of how organizations understand large-scale systems. Its role in big data is expanding, driven by new tools, algorithms, and infrastructure that make graph-based methods more practical across industries. A 2024 ACM survey of the field highlights not only recent advances in graph engines, but also the rising need for integration with broader data ecosystems, including SQL, machine learning, and real-time processing (Bonifati et al., 2024).
Deeper Integration with Machine Learning
Graph-based machine learning techniques, such as graph neural networks (GNNs), are gaining traction for their ability to model relational data more effectively than traditional models. These methods will push graph analytics further into use cases like fraud prediction, recommendation systems, and biomedical research.
Real-Time Graph Analysis
As more systems rely on streaming data, the ability to perform real-time graph analysis is becoming essential. Use cases like fraud detection, cybersecurity, and social media monitoring require immediate insights from continuously evolving graphs. This shift demands graph systems that support dynamic updates, streaming ingestion, and low-latency queries. Techniques like incremental computation, event-based processing, and integration with tools such as Kafka or Flink are becoming increasingly important.
Rethinking Graph Storage and Architecture
In practice, graph workloads rarely operate in isolation. Real-world use cases often combine graph analytics with SQL, machine learning, and other forms of data analysis. As a result, users increasingly expect unified platforms that support multiple analytical paradigms within a single environment. This means tighter integration between graph engines and data lakes, ML pipelines, and traditional query systems, moving away from fragmented tools and toward composable, end-to-end workflows.
How PuppyGraph Will Help in Graph Analytics
PuppyGraph enables distributed graph analytics as the first and only graph query engine purpose-built for modern data environments. Designed for scalability, performance, and ease of use, it eliminates the complexity of traditional graph databases by connecting directly to your existing data sources—no ETL required. This makes it especially well-suited for big data scenarios, where high volume, velocity, and variety make data movement both costly and inefficient. By removing the need for complex data pipelines and reducing latency, PuppyGraph is ideal for fast-paced environments and real-time analytics.
No ETL
With PuppyGraph, you can query SQL data directly as a graph by connecting to your data lakes and warehouses. There’s no need to extract and load data into a separate graph database. This eliminates the delays, complexity, and maintenance overhead of traditional ETL pipelines. More importantly, it significantly lowers the barrier to getting started with graph analytics. Teams can begin exploring graph insights within minutes, without rearchitecting their data infrastructure. It’s an ideal solution for teams looking to apply graph analytics to big data without needing a separate graph database or data duplication.


PuppyGraph supports both openCypher and Gremlin, giving you the flexibility to write graph queries in the language you're most comfortable with. Its distributed architecture ensures high availability and fault tolerance, enabling production-grade performance even as data volumes grow. Whether you're analyzing billions of records or running deep traversals across complex graphs, PuppyGraph makes graph analytics accessible at scale.

Petabyte-level scalability
PuppyGraph eliminates traditional graph scalability issues by separating compute and storage. It uses min-max statistics and predicate pushdown to scan only what’s necessary, even in massive datasets.
Its columnar processing model aligns well with vectorized execution, allowing for fast, efficient graph analytics at scale. Auto-sharded, distributed compute makes it easy to handle petabyte-scale graphs with billions of records.
PuppyGraph is already used by half of the top 20 cybersecurity companies, as well as engineering-driven enterprises like AMD and Coinbase. Whether it’s multi-hop security reasoning, asset intelligence, or deep relationship queries across massive datasets, these teams trust PuppyGraph to replace slow ETL pipelines and complex graph stacks with a simpler, faster architecture.


Complex queries in seconds
PuppyGraph delivers fast results for deep graph queries, handling multi-hop traversals—like finding 10-hop neighbors—in just seconds. By working directly on relationships, it avoids the costly table joins common in relational databases. Its patent-pending distributed engine efficiently uses compute resources, and performance scales as you add machines. This lets you run intensive graph workloads quickly, even as data and query complexity grow. Whether you're tracking fraud rings across accounts or mapping clinical pathways, PuppyGraph delivers the performance and flexibility needed for complex, highly connected data.
Deploy to query in 10 mins
PuppyGraph supports fast deployment via free Docker containers, AWS AMI, and GCP Marketplace. Whether cloud or self-hosted, setup takes less than 10 minutes, much faster than traditional graph databases.
Conclusion
Graph analytics is becoming essential for making sense of complex, large-scale data. From understanding relationships to detecting fraud or powering recommendations, it offers a more connected way to analyze information. But traditional tools often make it difficult to get started, requiring new infrastructure, data pipelines, and compromises on performance.
PuppyGraph removes those barriers. It’s the first distributed graph query engine built for real-time, big data analytics, no ETL required. If you're exploring graph analytics without the overhead of data duplication or specialized infrastructure, try the forever-free PuppyGraph Developer Edition or book a demo with our graph expert team and see how quickly you can start querying your existing data as a graph.

Jaz Ku is a Solution Architect with a background in Computer Science and an interest in technical writing. She earned her Bachelor's degree from the University of San Francisco, where she did research involving Rust’s compiler infrastructure. Jaz enjoys the challenge of explaining complex ideas in a clear and straightforward way.

Get started with PuppyGraph!


Developer Edition
- Forever free
- Single noded
- Designed for proving your ideas
- Available via Docker install
Enterprise Edition
- 30-day free trial with full features
- Everything in developer edition & enterprise features
- Designed for production
- Available via AWS AMI & Docker install