

MongoDB Graph Database: Native Graph Queries with PuppyGraph

Many teams rely on MongoDB to store rich, connected data, such as documents capturing users, transactions, relationships, and activity logs. As these datasets grow more complex, so does the need to explore how entities relate to one another. Whether you want to analyze multi-hop relationships, trace interaction paths, or uncover hidden patterns, graph queries provide a natural way to ask deeper questions about your data.
While MongoDB is a powerful document database with $graphLookup to support recursive queries, more advanced graph workloads often benefit from specialized tools designed for that purpose. That’s where PuppyGraph comes in. PuppyGraph lets you query your MongoDB data as a graph—using Gremlin or Cypher—without duplicating or migrating data into a separate system. This approach combines MongoDB’s flexibility and performance with advanced graph querying capabilities, all in real time.
In this article, we’ll look at what makes MongoDB effective for certain graph workloads, where it has limits, and how PuppyGraph can help you unlock a new layer of insight without disrupting your existing architecture.
What Does “MongoDB Graph Database” Really Mean?
When people search for a MongoDB graph database, they’re often looking for ways to analyze and query relationships stored in their MongoDB collections. It’s easy to see why: many applications naturally involve connected data, such as users following each other, products linked to categories, or devices interacting across a network.
MongoDB itself is a general-purpose document database built around flexible, JSON-like collections. It doesn’t store data as a native graph of nodes and edges in the way that dedicated graph databases do. Instead, it provides features like $graphLookup, an aggregation stage that can perform recursive lookups within or across collections. This makes it possible to explore hierarchical structures, such as organizational charts or nested categories, without additional tools.
In practice, MongoDB can handle a wide range of graph-style queries, especially when relationships are expressed in parent-child patterns. However, some use cases involve more complex questions. For instance, scenarios like finding shortest paths, performing multi-hop traversals across different entities, or detecting cycles in your data often benefit from graph query engines or databases specifically designed for graph workloads.
How MongoDB Supports Graph Workloads Today
MongoDB includes built-in capabilities that make it possible to work with connected data without introducing additional systems. The most notable feature is the $graphLookup stage in the aggregation framework.
$graphLookup allows you to perform recursive searches within a collection or across related collections, effectively traversing documents linked by references. For example, you can:
- Build an organizational chart by traversing manager-employee relationships.
- Retrieve all categories nested under a parent category in a catalog.
- Follow a chain of dependencies across documents.
This approach works well when your relationships form predictable hierarchies or tree-like structures. Because $graphLookup is part of the aggregation pipeline, you can combine it with filtering, projection, and sorting in a single query, which makes it quite powerful for many common scenarios. Here’s a simple example of how $graphLookup can be used conceptually.
Example
You have a categories collection representing product categories and subcategories. Each document looks like this:
{ _id: 1, name: "Electronics", parent: null }
{ _id: 2, name: "Computers", parent: "Electronics" }
{ _id: 3, name: "Laptops", parent: "Computers" }
{ _id: 4, name: "Ultrabooks", parent: "Laptops" }
{ _id: 5, name: "Desktops", parent: "Computers" }
{ _id: 6, name: "Smartphones", parent: "Electronics" }
{ _id: 7, name: "Accessories", parent: "Electronics" }
Suppose you want to retrieve up to 2 levels of subcategories under each category, but only include subcategories whose names contain the word “top” (e.g., “Laptops” and “Desktops”). Here’s how you could write the aggregation:
db.categories.aggregate([
  {
    $graphLookup: {
      from: "categories",
      startWith: "$name",
      connectFromField: "name",
      connectToField: "parent",
      as: "subcategories",
      maxDepth: 2,
      restrictSearchWithMatch: { name: { $regex: "top", $options: "i" } }
    }
  }
])
This query starts with each document’s name field and looks for other documents where the parent field matches that name. It follows these links recursively to build a tree of subcategories. The maxDepth: 2 option means the search goes no more than two levels deep. Finally, restrictSearchWithMatch filters the results so only subcategories whose names include the word “top” (like “Laptops” or “Desktops”) are included in the output.
Here is the example output:
{
  "_id": 1,
  "name": "Electronics",
  "parent": null,
  "subcategories": [
    { "_id": 3, "name": "Laptops", "parent": "Computers" },
    { "_id": 5, "name": "Desktops", "parent": "Computers" }
  ]
}
When You May Need Additional Graph Capabilities
For many workloads, $graphLookup provides an effective way to explore hierarchies or simple relationships in your MongoDB collections. But as your data and questions grow more complex, you might encounter scenarios where additional graph capabilities become important.
These situations often include:
- Multi-hop relationships across multiple collections.
For example, tracing how a user interacts with products, other users, and transactions through several layers of connections. - Flexible path finding.
Answering questions like “What is the shortest path between two entities?” or “Which paths connect these nodes within five hops?” can require more advanced traversal logic. - Graph pattern matching.
Detecting specific structures, such as cycles, repeated motifs, or communities, goes beyond hierarchical lookups. - Running graph algorithms.
Techniques like PageRank, shortest path calculations, or community detection can reveal insights about how entities are connected and how influence or activity flows through your network. - Working with specialized graph query languages.
Languages like openCypher and Gremlin are designed to express these queries concisely and support a wide variety of graph algorithms.
If your use cases involve this level of analysis, you may consider complementing MongoDB with a dedicated graph query layer. This way, you can keep MongoDB as your primary data store while adding the flexibility to answer more sophisticated graph questions. For an example of how MongoDB integrates with PuppyGraph for real-time threat detection, check out this article.
Extending MongoDB’s Graph Capabilities with PuppyGraph
PuppyGraph helps you build on MongoDB’s native strengths by adding advanced graph capabilities for more sophisticated analysis. Rather than requiring you to move or duplicate your data into a separate system, PuppyGraph connects directly to your MongoDB collections and creates a virtual graph model on top of them.
This integration lets you:
- Define how your documents relate to each other by mapping collections, fields, and references into a graph schema.
- Query your data using graph languages like openCypher and Gremlin, which are built for expressing complex relationships and traversals.
- Run multi-hop queries, discover patterns, and apply graph algorithms in real time.
Because PuppyGraph operates in a zero-ETL architecture, your data always stays up to date. As soon as you update or insert documents in MongoDB, your graph queries immediately reflect those changes—without the need for batch processing or separate pipelines.
By combining MongoDB’s flexible document model with PuppyGraph’s graph query engine, you can explore connected data more deeply while keeping MongoDB as your single source of truth.
For step-by-step guides on connecting PuppyGraph to MongoDB, defining your schema, and running queries, see:
There are three main steps to using PuppyGraph on MongoDB: connecting, modeling the graph, and querying. In the following sections, we’ll illustrate each step using the same example you’ll find in the official guides.
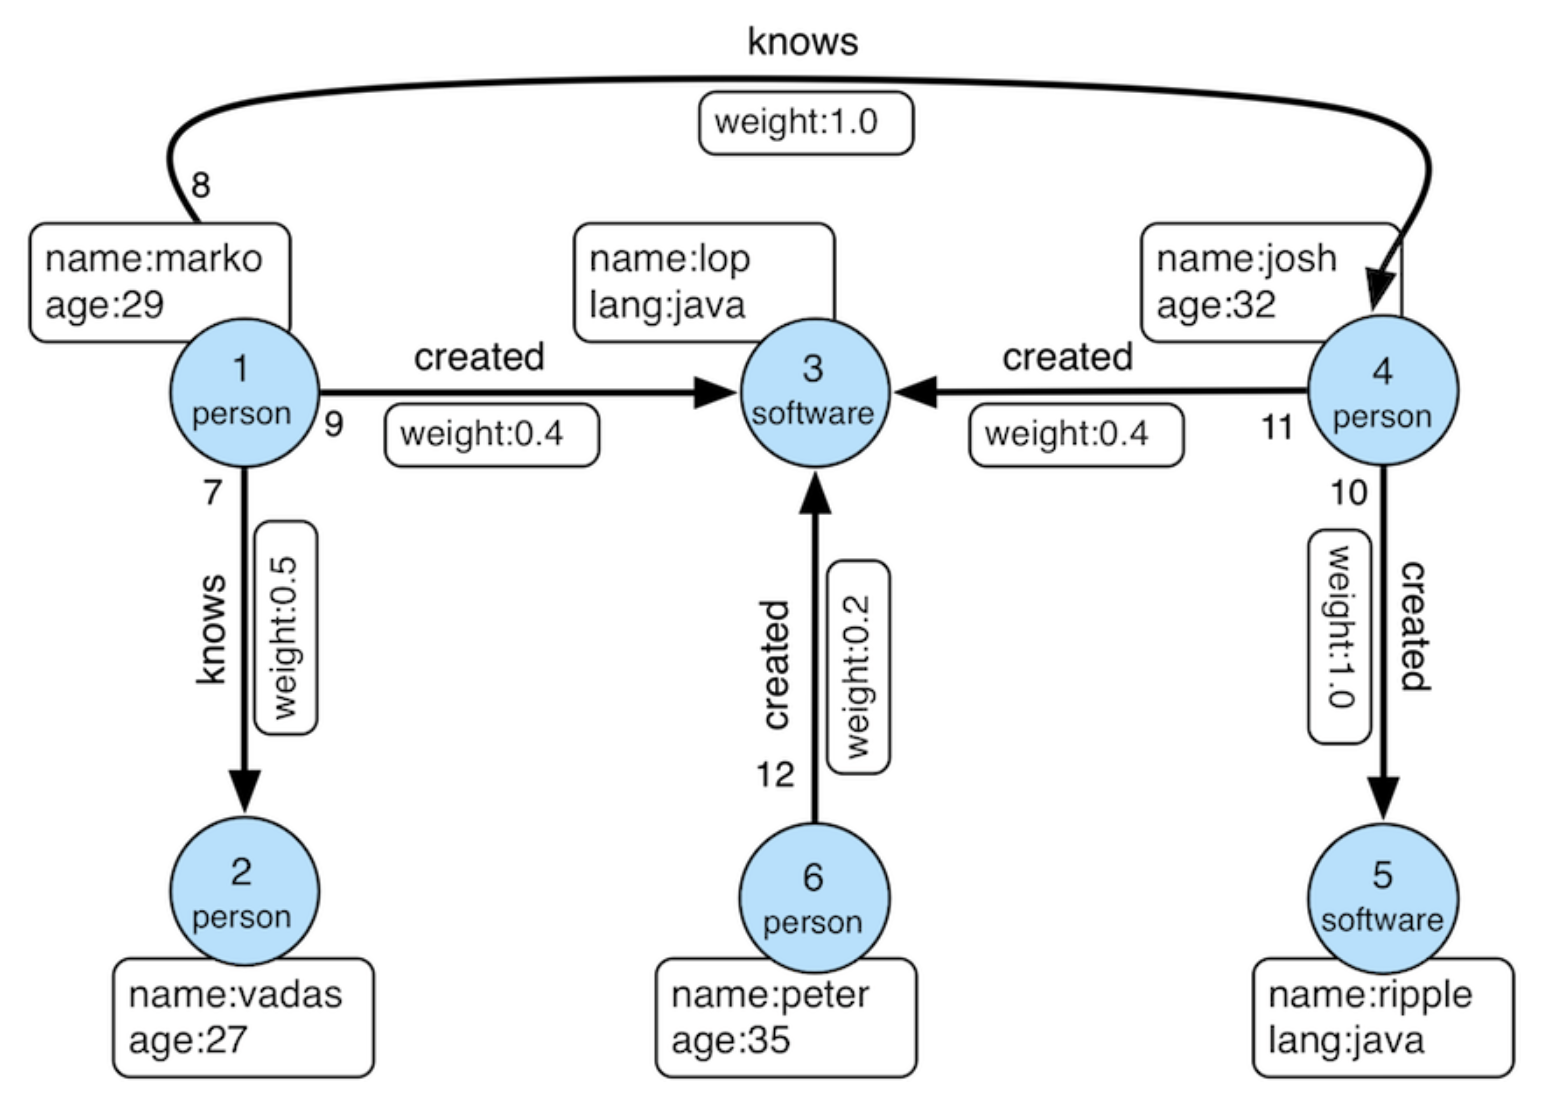
Here’s the sample graph structure we’ll reference:
How PuppyGraph Connects to MongoDB
PuppyGraph connects to MongoDB through two supported methods:
- MongoDB Atlas SQL Interface (JDBC driver)
- MongoDB BI Connector for self-hosted deployments
Both options let you integrate without duplicating or transforming your data. Under the hood, PuppyGraph uses SQL-compatible access to read your collections as tables, so you can build graph models dynamically on top of your existing documents.
The process typically involves a few steps:
- Configure your MongoDB connection.
- For Atlas, you create an Atlas SQL connection and obtain a JDBC connection string.
- For self-hosted MongoDB, you enable the BI Connector to expose a SQL interface.
- For Atlas, you create an Atlas SQL connection and obtain a JDBC connection string.
- Start PuppyGraph.
PuppyGraph runs as a Docker container. Once deployed, it provides a web interface and endpoints for querying. - Define your graph schema.
You map collections to graph structures by specifying how documents become nodes and edges. For example, a person collection can represent vertices, and a knows collection can define connections between them. - Run graph queries.
Once your schema is configured, you can issue openCypher or Gremlin queries in real time. PuppyGraph retrieves live data directly from MongoDB, so your results always reflect the latest updates.
Modeling Relationships in MongoDB with PuppyGraph
Once PuppyGraph is connected to your MongoDB database, the next step is to define how your collections and documents map to graph concepts. This process is called graph schema modeling, and it tells PuppyGraph how to interpret your data as nodes, edges, and properties.
For example, you might have collections like:
- person storing people and their attributes
- software containing software and their attributes
- knows representing who knows whom
- created showing which person created which software
In PuppyGraph, you can model this by:
- Declaring person as a vertex label
- Declaring software as another vertex label
- Mapping knows as an edge between people
- Mapping created as an edge between people and software
Each part of your schema can include attributes—like names, IDs, or weights—and you can define them either through the web UI or by uploading a JSON schema file. Once the schema is set up, PuppyGraph uses it to power all your graph queries.
Here’s a simple example of what this looks like conceptually:
- Vertices:
- person node with id, name, and age
- software node with id, name, and language
- person node with id, name, and age
- Edges:
- knows edge connecting one person to another
- created edge connecting a person to software
- knows edge connecting one person to another
This structure makes it easy to ask questions like:
- Who does this person know?
- Which software did people in their network create?
- How many steps connect one user to another?
If you want to see detailed examples of schema files or walkthroughs of modeling your collections, you can refer to the setup guides you saw earlier. PuppyGraph provides templates and visual tools to help you build your schema without writing everything from scratch.
Running Real-Time Graph Queries on MongoDB Data
After you’ve defined your graph schema, you can start exploring your MongoDB data with real-time graph queries. PuppyGraph supports two popular query languages: openCypher and Gremlin. Both are purpose-built for expressing complex relationships, traversals, and patterns that are difficult to capture with standard document queries alone.
Here are a few examples of the kinds of questions you can answer:
1. Find a person by name and list their properties:
- openCypher:
MATCH (p:person {name: 'marko'}) RETURN p- Gremlin:
g.V().has('name', 'marko').valueMap()2. Retrieve all software created by people known to "marko":
- openCypher
MATCH (p:person {name: 'marko'})-[:knows]->()-[:created]->(s:software)
RETURN s- Gremlin
g.V().has('name', 'marko').out('knows').out('created').valueMap()These queries run directly against your live MongoDB data. Because PuppyGraph uses a zero-ETL approach, there’s no waiting for batch jobs or worrying about data getting out of sync. Any new documents or updates you make in MongoDB are immediately visible in your graph queries.
If you prefer to work visually, PuppyGraph’s web UI also lets you run queries interactively and see the results as tables or as interactive graph visualizations. This can be helpful for exploring unfamiliar data or presenting insights to your team.

MongoDB + PuppyGraph vs. Dedicated Graph Databases
Using PuppyGraph with MongoDB offers a flexible way to explore graph data without moving it into a separate system. But it’s helpful to understand how this approach compares to using a dedicated graph database.
MongoDB + PuppyGraph:
- Primary data store: MongoDB remains your single source of truth.
- Zero-ETL: All graph queries run directly against live collections, so results are always up to date.
- Flexible modeling: You can define graph schemas dynamically on top of your existing collections.
- Graph query languages: openCypher and Gremlin are both supported.
- Operational simplicity: No need to maintain duplicate storage or synchronize data pipelines.
Dedicated graph databases (e.g., Neo4j, TigerGraph):
- Native graph storage with full CRUD and transaction support: Dedicated graph databases store data natively as nodes and edges and are designed to handle graph-specific create, update, and delete operations as well as transactional consistency across complex relationships.
- Separate system: You typically need to export or sync data from other sources into the graph database.
- Operational considerations: Running a separate graph database requires additional management, security, and scaling planning.
Which approach makes sense depends on your priorities. If you need transactional graph updates and a native graph format, a dedicated graph database may be a better fit. But if you want to keep MongoDB as your main platform and simply add real-time graph querying, PuppyGraph is often the simpler choice—especially in these situations:
- You already use MongoDB as your primary data platform.
- Your graph workloads are mostly read-focused.
- You want to run multi-hop traversals, pattern detection, or graph algorithms on live data.
- You prefer to avoid building and maintaining ETL pipelines.
Proven at Enterprise Scale
PuppyGraph is already used by half of the top 20 cybersecurity companies, as well as engineering-driven enterprises like AMD and Coinbase. Whether it’s multi-hop security reasoning, asset intelligence, or deep relationship queries across massive datasets, these teams trust PuppyGraph to replace slow ETL pipelines and complex graph stacks with a simpler, faster architecture.


Conclusion
MongoDB is a robust document database with flexible schema design and powerful aggregation capabilities. But when your data is highly connected and your questions go beyond simple lookups—like exploring multi-hop relationships, finding paths, or analyzing network patterns—traditional queries can quickly become complex.
PuppyGraph makes it possible to add graph querying and analytics to MongoDB without moving your data or maintaining separate infrastructure. By defining a graph schema over your existing collections, you can run expressive Gremlin or openCypher queries in real time and uncover insights that would be difficult to surface otherwise.
Whether you want to enrich your analytics, power recommendation systems, or better understand how entities in your data relate, combining MongoDB and PuppyGraph provides a practical, low-friction way to bring graph capabilities into your existing stack.
If you’re ready to explore graph queries and see how MongoDB as a graph database can work in practice, try the forever-free PuppyGraph Developer Edition or book a demo with our team to get started.

Sa Wang is a Software Engineer with exceptional mathematical ability and strong coding skills. He holds a Bachelor's degree in Computer Science and a Master's degree in Philosophy from Fudan University, where he specialized in Mathematical Logic.

Get started with PuppyGraph!


Developer Edition
- Forever free
- Single noded
- Designed for proving your ideas
- Available via Docker install
Enterprise Edition
- 30-day free trial with full features
- Everything in developer edition & enterprise features
- Designed for production
- Available via AWS AMI & Docker install