

Software Dependency Graphs: Definition, Use Cases, and Implementation
Modern software systems rely on hundreds or even thousands of interconnected components: functions, files, libraries, and services. They are rarely monolithic. Instead, most consist of dozens or even thousands of loosely coupled services that interact through APIs, message queues, and shared infrastructure. As these systems grow, their internal dependencies become increasingly difficult to track and reason about. Software dependency graphs offer a structured way to map these relationships, helping developers better understand how their systems are connected, plan changes more confidently, and keep growing codebases maintainable. This blog explores what software dependency graphs are, the types of analyses they support, how to extract and visualize them, and where tools like PuppyGraph can help.
What is a Software Dependency Graph?
A software dependency graph is a visual representation of how different parts of a codebase rely on each other. The nodes in the graph can represent files, classes, functions, libraries, or entire projects. The edges capture the dependencies between these elements, such as module imports, API calls, shared libraries, or build-time relationships.
Depending on the level of detail you need, software dependency graphs can be built from different sources such as manifest files, source code, build configurations, and Software Bills of Materials (SBOMs).
The structure and content of the graph will vary depending on what data is used. A graph based on SBOMs gives a high-level view of software packages, while one built from source code provides a more detailed map of relationships within the codebase. Each serves a different purpose, depending on whether you're debugging, refactoring, planning a build, or reviewing your software supply chain.
Types of Software Dependencies
When most people think of software dependencies, they picture imported libraries or shared functions across files. While those matter, they only cover part of the picture. Modern systems also depend on build tools, runtime services, infrastructure configurations, and other processes. Understanding these different types helps developers see how changes in one area can affect others, sometimes in unexpected ways.
Direct Dependencies
Direct dependencies are components a module explicitly references in its code, such as libraries imported with import or require(). For example, Python scripts use import, while Node.js supports both, with require() being common in older codebases. These calls represent direct, intentional dependencies on external modules or internal files.
When a developer installs a package using tools like npm, pip, or Maven, it gets recorded in a project’s manifest file, such as package.json, requirements.txt, or pom.xml. Because they’re explicitly listed and directly used, direct dependencies are usually straightforward to manage and inspect.
Transitive Dependencies
Transitive dependencies are packages your direct dependencies rely on. When you install a library, you also install everything it depends on. These are typically not listed in the manifest file but appear in lock files like package-lock.json, yarn.lock, or Pipfile.lock.
These indirect dependencies are typically resolved automatically by package managers during installation. Since transitive dependencies are not explicitly declared, they can be harder to track and understand. In some cases, they can even introduce hidden circular dependencies that are difficult to detect without tooling.
Compile-time Dependencies
Compile-time dependencies are the components required to build or compile your project. These often include compilers, annotation processors, type definition files, or code generation tools that must be available before code can be turned into an executable form. Even in interpreted languages like Python or JavaScript, there are tools and packages that serve a similar role. These may include type checkers, linters, formatters, or build tools used to validate or package code.
Build tools offer configurations for managing them. For example, Gradle’s compileOnly keeps compile-time tools out of the runtime classpath. These dependencies are essential during CI, packaging, or static checks, although they aren’t needed once the application is running.
Run-time Dependencies
Run-time dependencies are the components an application needs during execution to perform its intended tasks. These typically include application libraries, service clients, database connectors, background workers, cloud SDKs, and other packages used while the application is running.
Run-time dependencies must be present in the deployed environment or the application may fail to start or function correctly. In most setups, they are bundled into the final artifact or installed alongside it. Similar to compile-time dependencies, build systems offer specific configurations for managing run-time dependencies such as Gradle’s runtimeOnly configuration. In Docker-based deployments, they are typically installed through instructions in a Dockerfile.
Deployment dependencies
Deployment dependencies are the components required to build, package, and deploy an application into its target environment. They don’t affect the application’s behavior at runtime, but they are essential for producing a runnable artifact and delivering it consistently across environments. Common examples include Dockerfiles, Docker Compose files, CI/CD scripts, Kubernetes manifests, Helm charts, and infrastructure-as-code files like Terraform or Pulumi.
Deployment dependencies are critical for ensuring reliable and repeatable releases. Their primary role is to define how and where the application will be built, deployed, and executed.
Why Software Dependency Graphs Matter
Clarity & Understanding
As modern applications grow in size and complexity, it becomes harder to understand how different parts of the system relate to each other. Software dependency graphs offer a visual way to explore these relationships, whether between files, functions, modules, or entire services. Instead of combing through scattered import statements or manually tracing call chains, developers can use graphs to see how everything fits together.
This visibility is especially useful for speeding up onboarding, reviewing unfamiliar code, and collaborating across teams. By presenting the structure of the codebase in a more intuitive format, software dependency graphs help teams work more efficiently and make better-informed decisions.
Maintainability & Refactoring
Maintaining a growing codebase often means untangling tightly coupled components, cleaning up outdated modules, and simplifying complex dependencies. Software dependency graphs make this easier by highlighting relationships that are otherwise hard to spot in raw code. They help teams identify modules that are overly dependent on others, uncover dead or unused code, and detect circular dependencies that can lead to build errors or runtime instability. While issues like these may be easy to detect in smaller codebases, they often slip past notice as systems grow in size and complexity.
Being able to query and explore dependencies programmatically also supports more confident refactoring. Instead of guessing what might break, teams can trace how a change flows through the system and isolate what can be safely modified. By clarifying internal structure and surfacing hidden connections, dependency graphs help reduce long-term technical debt and improve overall maintainability.
Risk & Change Management
Any change to a codebase, whether it's a bug fix, feature addition, or architectural shift, introduces risk. These risks include breaking downstream modules, introducing regressions, causing deployment failures, or unintentionally affecting users. Software dependency graphs help manage these risks by making relationships queryable. Developers can trace how a change might impact the system by following connected nodes such as files, functions, or services.
This is especially useful during large-scale migrations like replacing a framework, upgrading a library, or rearchitecting part of the system. Teams can use graph queries to identify what depends on a deprecated component and plan the migration in smaller, safer steps. This includes asking questions like “What will be affected if this changes?” and “Which areas need to be migrated together?” With this insight, teams can plan migrations more safely, even in large and highly interdependent systems.
Security & Compliance
Security and compliance are major reasons why organizations invest in software dependency graphs. As applications grow more interconnected, it becomes harder to track what is actually included in a deployed system. This is especially true when dealing with transitive dependencies and third-party packages.
The growing reliance on Free and Open Source Software (FOSS) makes this even more challenging. Projects often include hundreds of indirect dependencies maintained by contributors with varying levels of support and visibility. According to the 2025 Open Source Security and Risk Analysis (OSSRA) report, the average application contains more than 1,200 open source components, and 64 percent of them are transitive. These dependencies are not always explicitly declared, which makes them easy to overlook, even though they can introduce security vulnerabilities, licensing issues, and operational risk.
Dependency graphs help surface these relationships and give teams the visibility they need to manage risk more effectively. They can also be used to audit dependency chains, identify vulnerable packages, and generate SBOMs to meet compliance requirements.
Types of Software Dependency Analysis
Dependency graphs are most valuable when used to generate insight. Different types of analysis help identify unused code, trace data flows, or evaluate the impact of changes. The kind of insight depends on how the dependency data is collected.
Static analysis scans source code, configuration files, and manifests to capture declared relationships like imports, function calls, and package usage. It reveals the intended structure of the system without requiring the code to run.
Dynamic analysis observes the application during execution. It captures runtime behavior such as conditional logic, service calls, and dynamically loaded modules. This approach shows how the system behaves in practice.
Even simple structural checks, like detecting circular dependencies, can surface issues that affect builds, tests, or runtime behavior. The sections below cover more advanced forms of analysis and what they can reveal.
Change Impact Analysis
Before making a code change, developers need to understand what else in the system might be affected. Change impact analysis helps answer that by using the structure of a software dependency graph to trace how updates might ripple through related parts of the codebase. By following the relationships between components such as files, functions, packages, or services, teams can see which areas rely on the code they plan to modify.
This is especially useful when deprecating modules, upgrading shared libraries, or working on core infrastructure. It helps prevent downstream breakage, scope migrations more realistically, and reduce the risk of regressions.
Graph queries make these insights easier to extract. They allow teams to identify downstream consumers and uncover indirect effects that are easy to miss through manual inspection. This enables safer, more deliberate changes across large and complex systems.
Root Cause Analysis
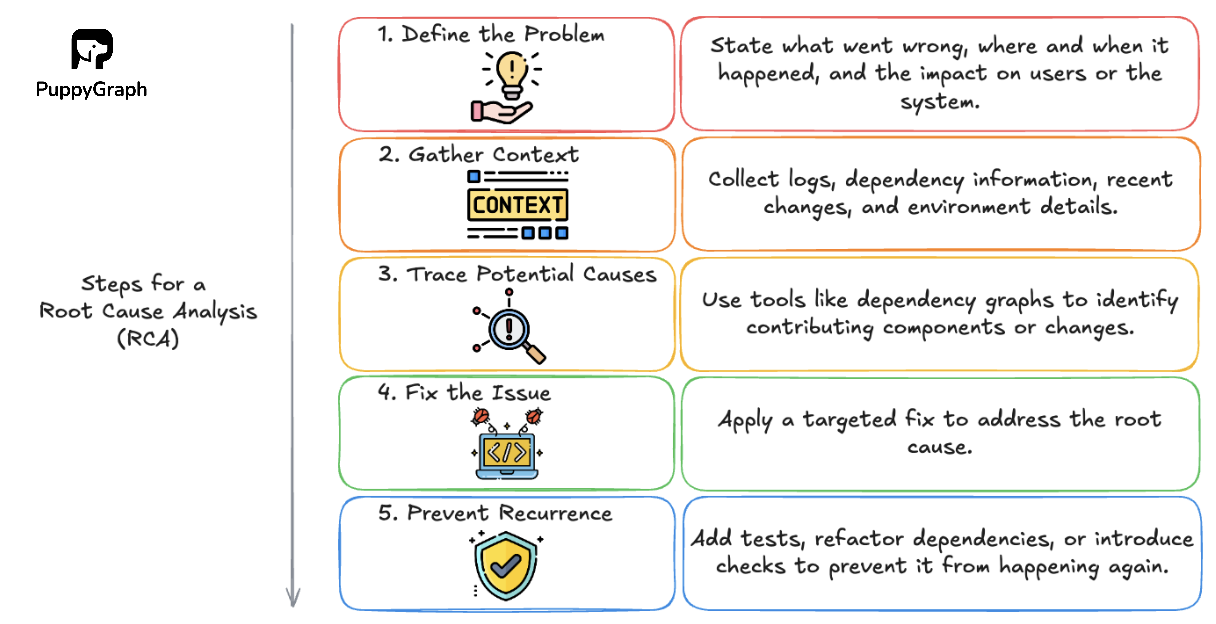
When something breaks, finding the root cause can be difficult, especially in systems with many moving parts. A software dependency graph helps teams trace issues back to their origin by highlighting how components are connected and where failures may have started.
Instead of just focusing on the point of failure, teams can walk the graph to understand what led up to it. This is useful for investigating cascading errors, build issues, or incidents that involve multiple layers of the system. By tracing how problems propagate through dependencies, it becomes easier to isolate the source and resolve issues more efficiently.
This kind of structured analysis speeds up investigation and improves confidence in the fix, whether the issue stems from a recent change, a misconfiguration, or a vulnerable dependency.
Taint Analysis
Taint analysis tracks how data flows through a system, especially data that originates from untrusted or sensitive sources. By marking these inputs as “tainted,” developers can follow their path through functions, modules, and services to see where they end up. This is particularly useful for detecting security issues, such as whether user input reaches a database query, a file system operation, or an external API without proper validation or sanitization.
Software dependency graphs add structure to this process by modeling the relationships between components. Combined with taint information, they help uncover risky or unintended data flows that may span multiple layers of the system.
Taint analysis is commonly used in static analysis tools for finding injection vulnerabilities, insecure deserialization, or improper use of authentication tokens. Being able to visualize and trace these paths across services helps teams spot issues earlier and enforce data handling policies more effectively.
Detecting Dead Code and Unused Dependencies
Keeping a codebase clean means knowing what’s actually used. Dead code and unused packages add maintenance overhead, slow down builds, and increase the risk of outdated or vulnerable components lingering in the system.
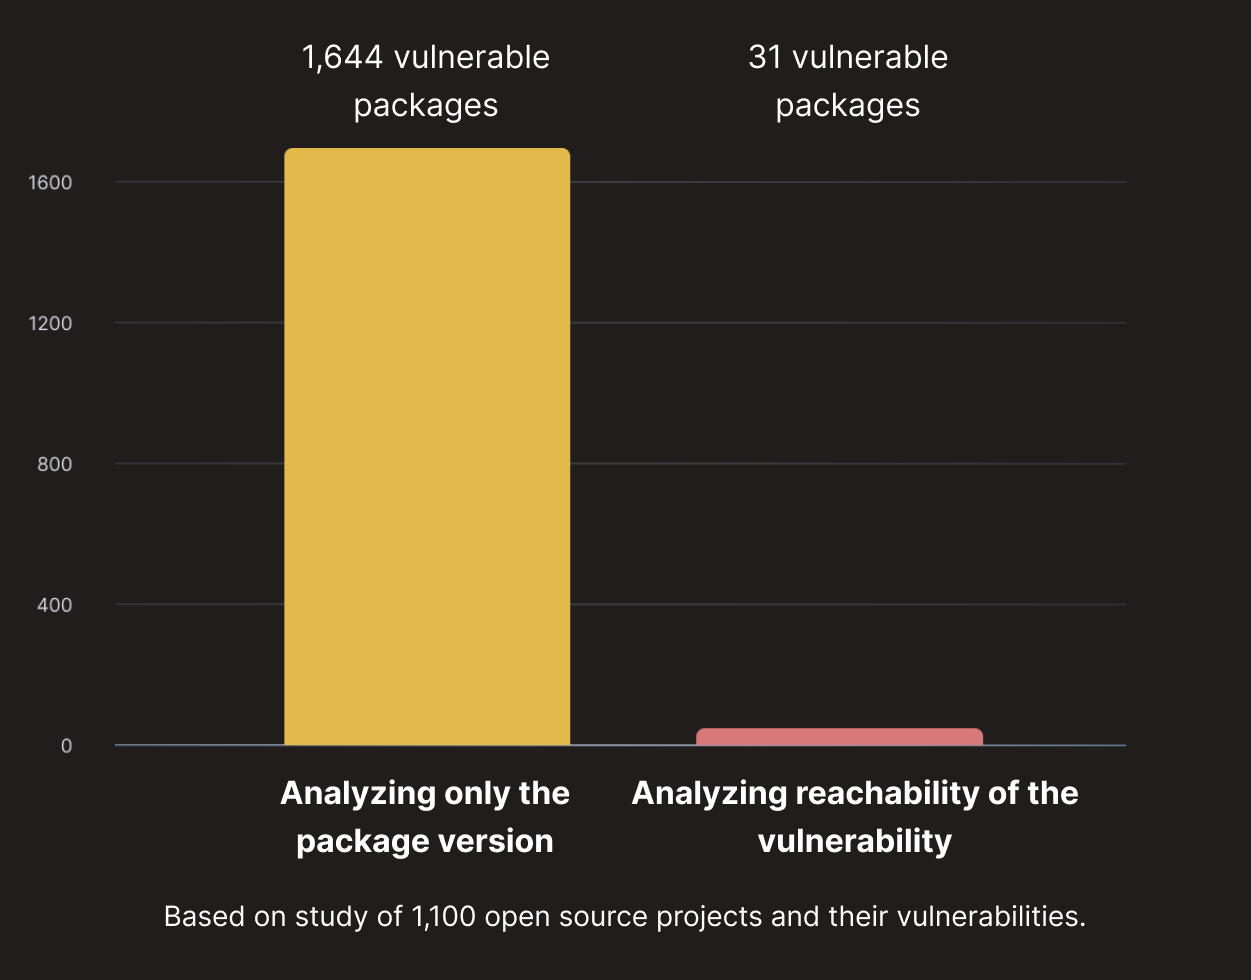
By tracing execution paths from known entry points, engineers can identify functions, files, and libraries that are never called. This approach, known as reachability analysis, helps uncover code that can be safely removed to simplify the system and reduce technical debt.
It also helps teams focus their security efforts. Not all vulnerabilities pose an equal risk. If a vulnerable package is present but never used at runtime, it may not need immediate remediation. Filtering for what’s actually reachable helps avoid alert fatigue and keeps attention on the threats that matter most.
How to Create a Software Dependency Graph
Creating a software dependency graph starts with collecting the right data. That might come from package manifests, lock files, build configurations, or a full SBOM. The best source depends on what you're trying to model or understand, whether it's internal code structure, third-party libraries, or system-wide relationships.
Collecting Software Dependency Data
Before building a software dependency graph, you need to decide what kind of relationships you want to model. Software systems contain many layers of dependencies, and the right data source depends on the level of detail you are interested in, whether that means internal code structure, third-party libraries, or system-wide components.
Table: Sources and Uses of Software Dependency Data
It’s also important to recognize the additional challenges involved. Ensuring that the data is accurate, consistent, and up to date can be difficult, especially in large codebases or across multiple teams and environments.
Visualizing Software Dependencies
Once you’ve collected software dependency data, the next step is making it understandable. This often involves turning the data into a graph that captures how components relate to one another.
There are many ways teams choose to visualize this information. Static tools like Graphviz or Mermaid generate simple diagrams from predefined edge lists, which can work well for small or well-scoped systems. JavaScript libraries such as D3.js and Cytoscape.js offer more flexibility and interactivity, but they typically require custom configuration and aren’t optimized for querying or navigating large graphs.
How PuppyGraph Can Help
Understanding software dependencies is key to improving build reliability, managing change, and maintaining complex systems. But to analyze them effectively, you need more than just a visualization.
You need the ability to query the graph. Traditional graph databases provide that, but they often require complex setup, custom storage formats, and ongoing ETL to stay in sync with your source data. PuppyGraph takes a different approach. As the first and only graph query engine that lets you query relational data as a graph, it removes the overhead of maintaining a separate graph database. You can define graph views and run graph queries directly on your existing tables. No ETL, no data duplication.
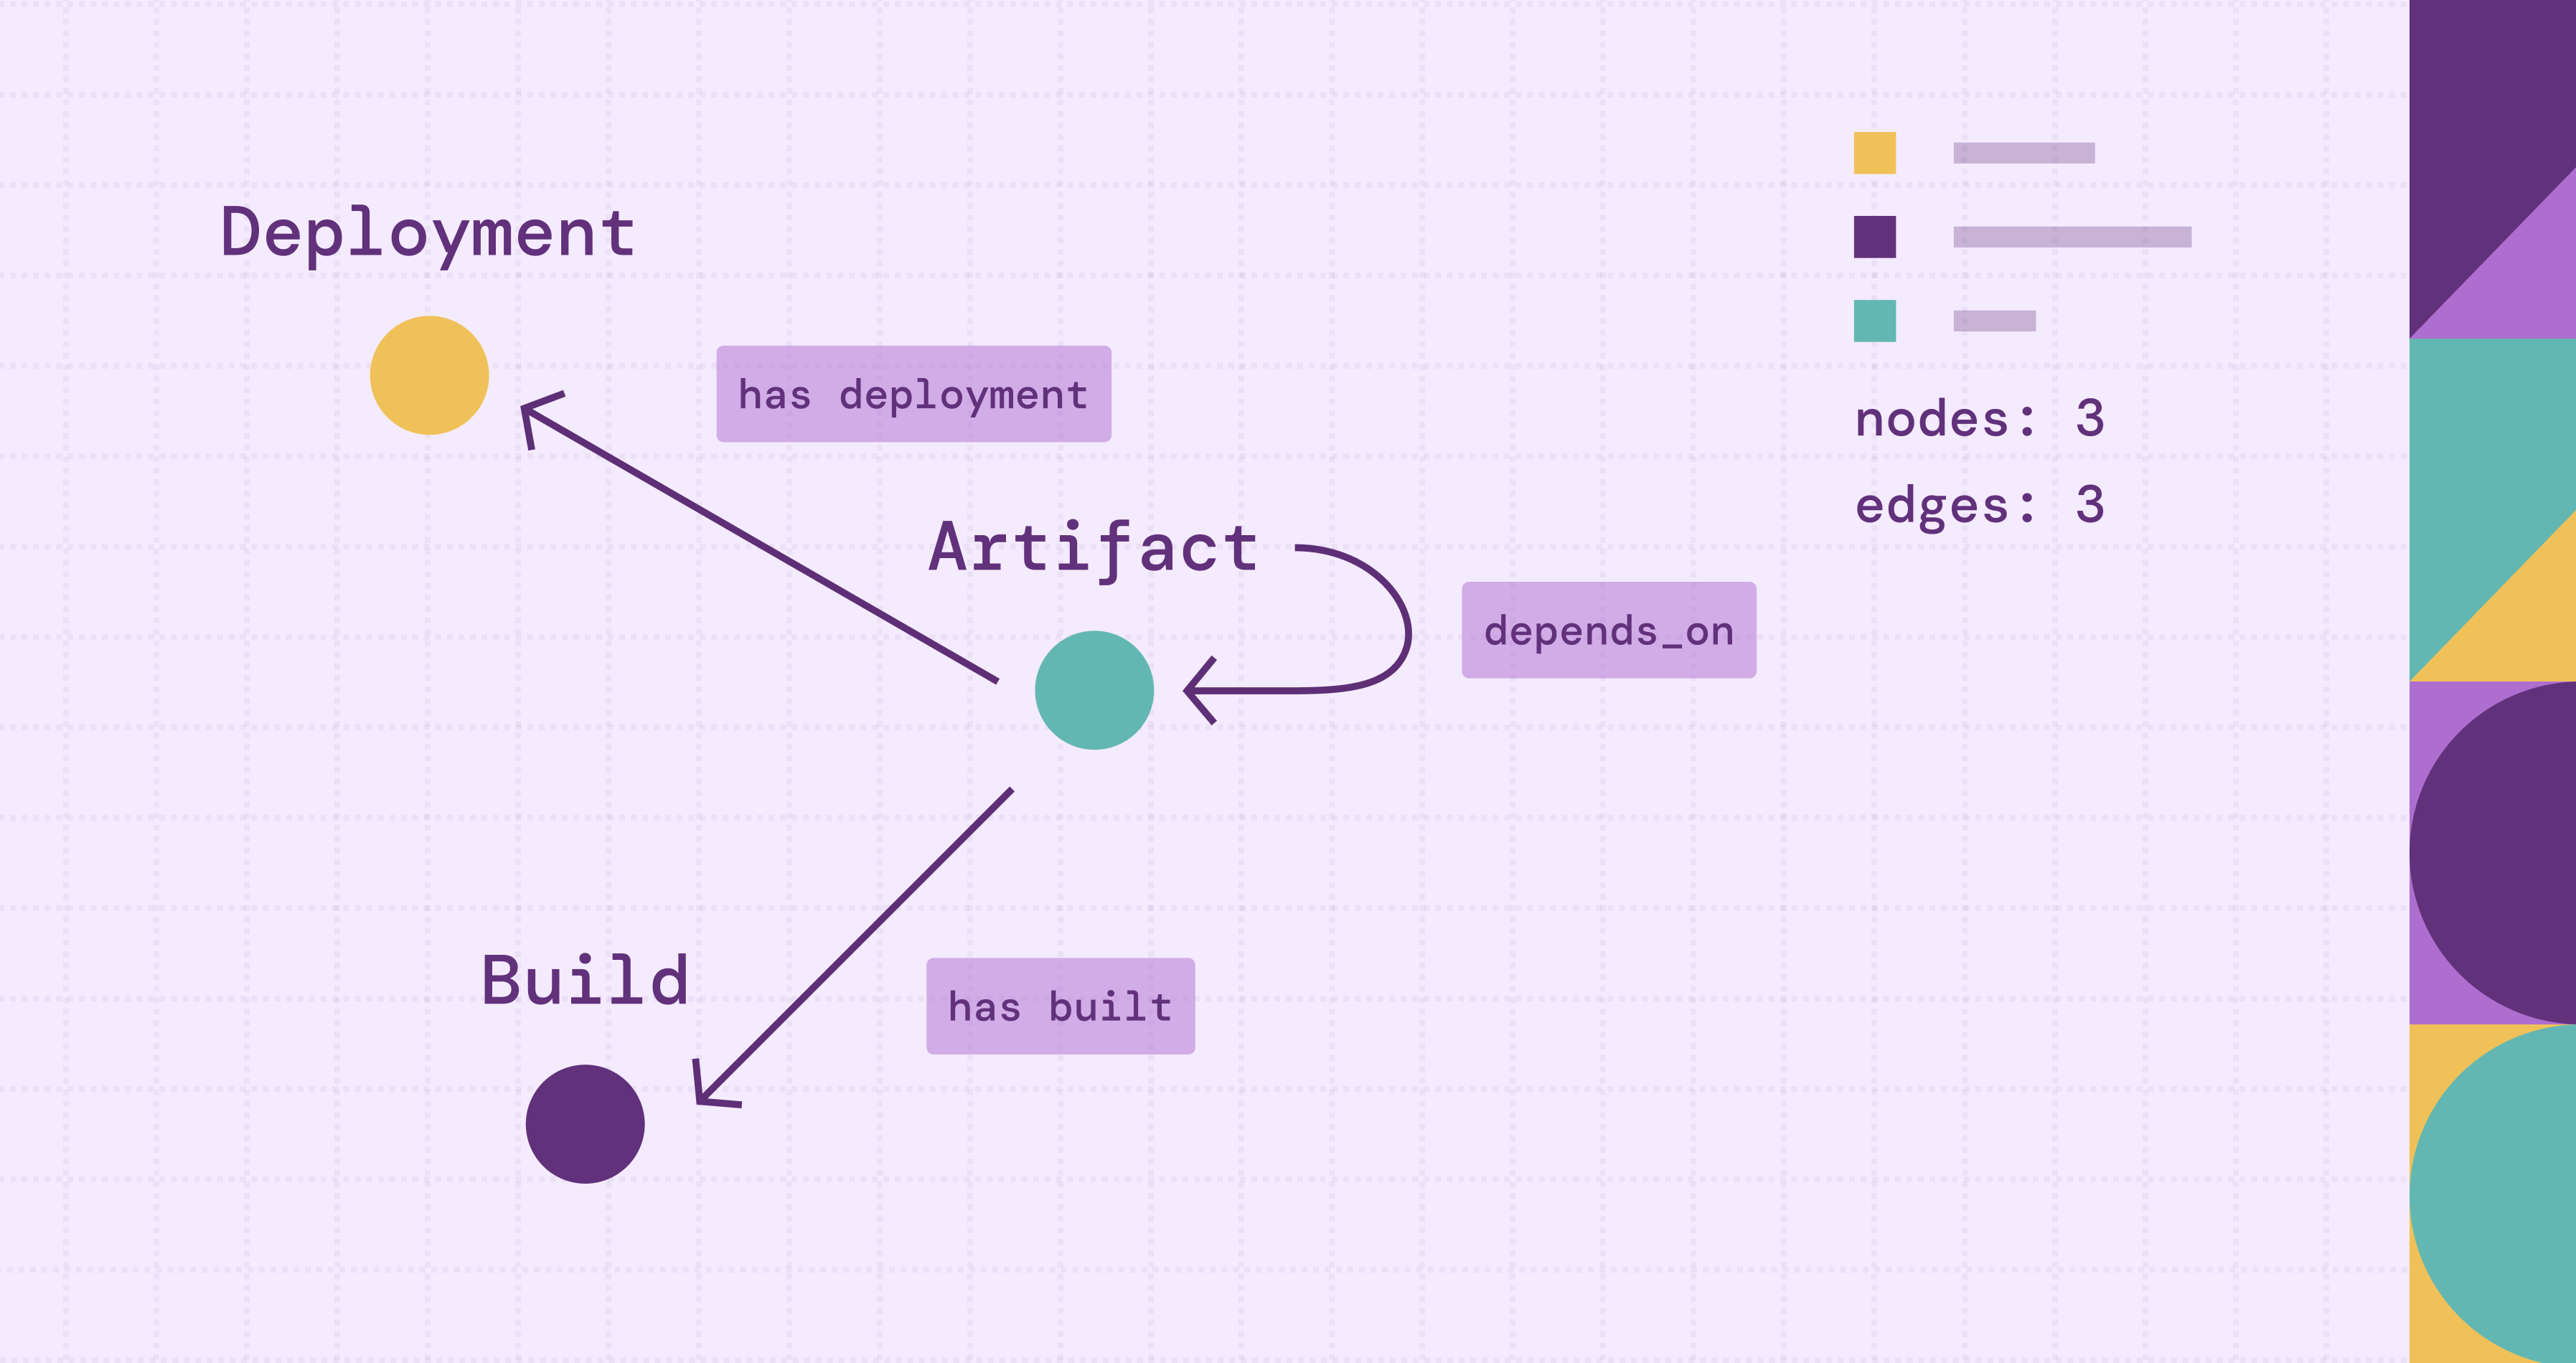
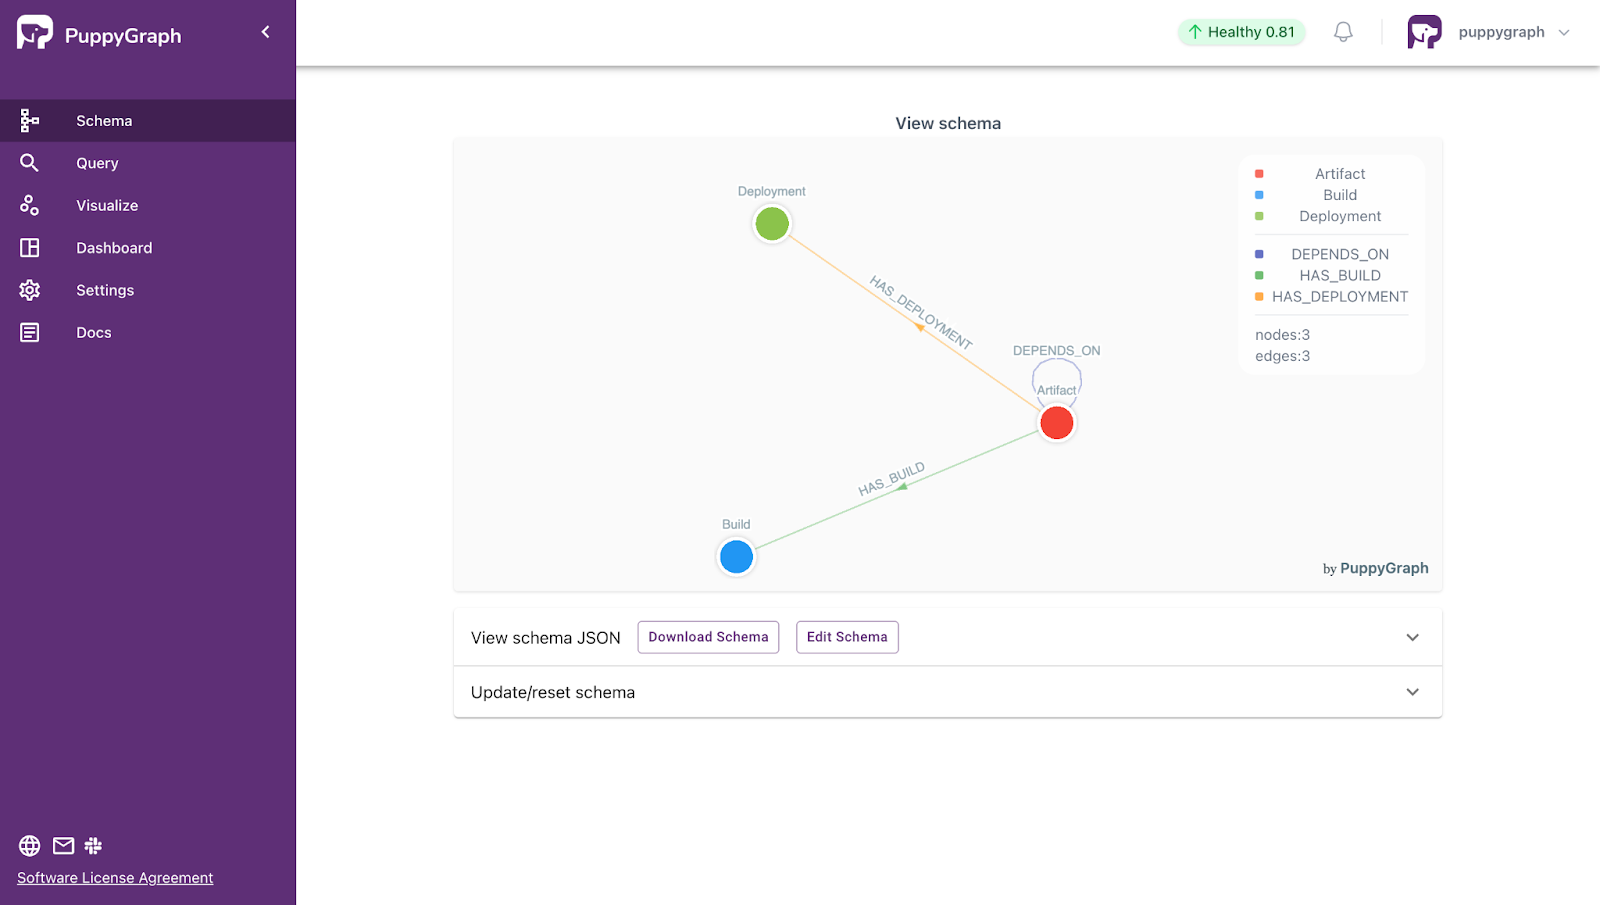
Let’s walk through a real example using the PuppyGraph CI/CD Artifact Dependency demo, which shows how to build a dependency graph and explore artifact-level relationships within a CI/CD pipeline.
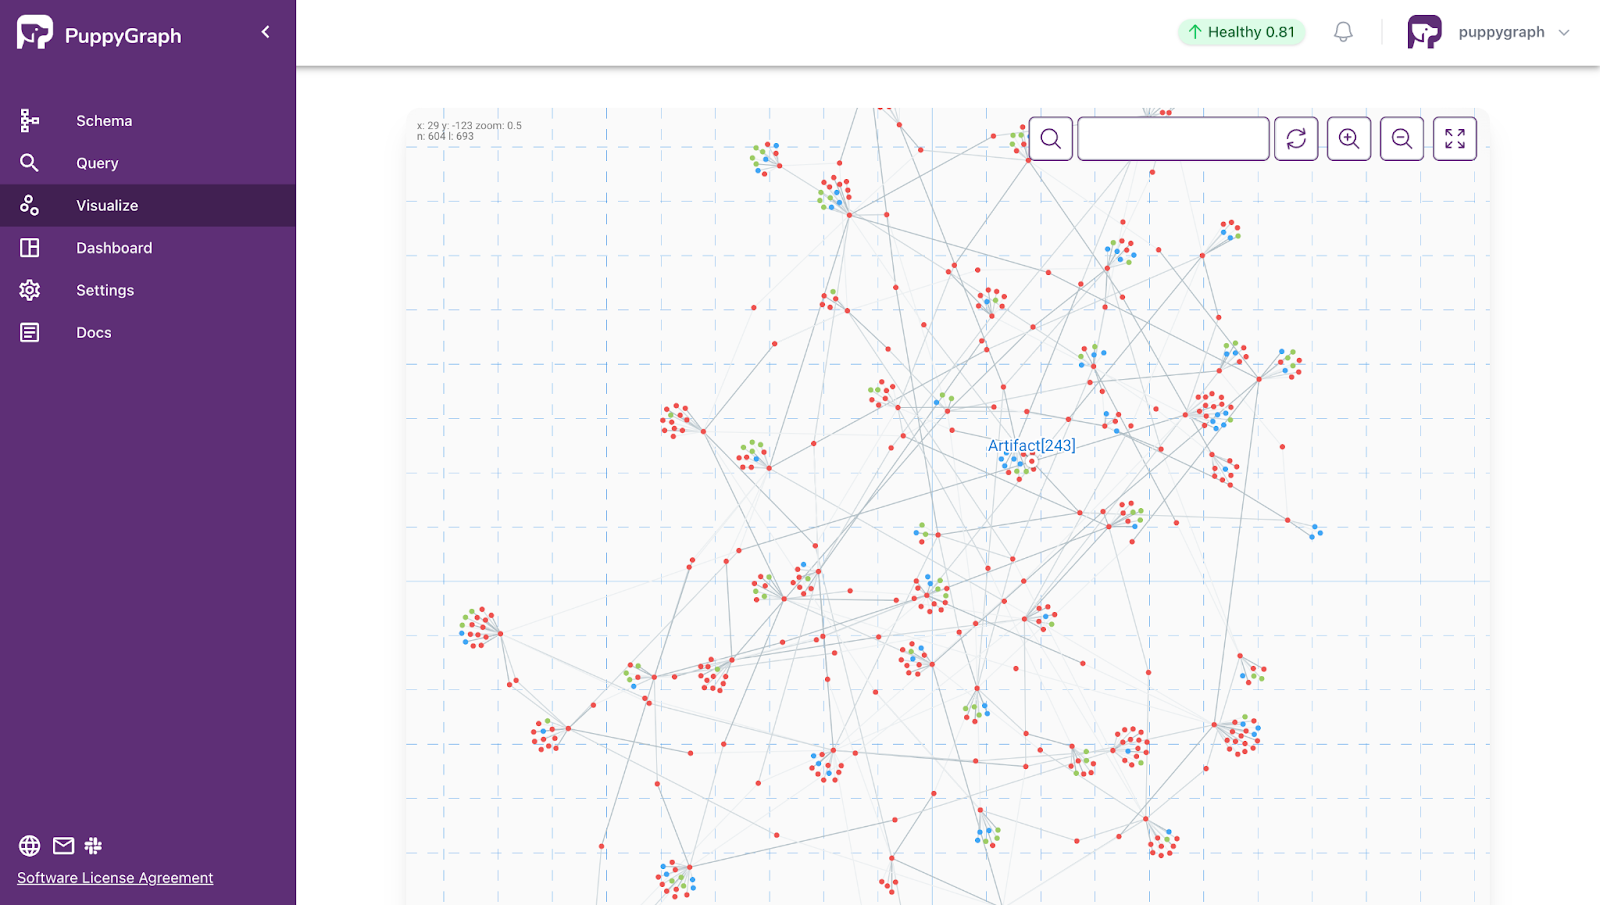
Software Dependency Visualization with PuppyGraph
With PuppyGraph, users can upload a schema that defines the structure of their data and immediately generate an interactive graph. This allows teams to quickly explore software dependencies visually, while also supporting more advanced use cases like querying paths, tracking change impact, or identifying tightly coupled components.
Software Dependency Analysis with PuppyGraph
Once your data is modeled into a graph, you can start exploring how artifacts relate to each other and investigating issues like failing builds, dependency sprawl, or unexpected change impact. Instead of relying on static views, graph queries let you ask specific questions and get real answers about your software’s structure and behavior.
PuppyGraph supports both Gremlin and openCypher, giving teams flexibility in how they query their data. Let’s run a series of queries using the PuppyGraph demo to explore dependencies, identify downstream artifacts, and investigate failed builds—all directly from the graph.
Here are some example Gremlin queries:
- Query all direct and indirect dependencies of an artifact
g.V("Artifact[1]")
 .repeat(__.out('DEPENDS_ON').simplePath())
 .emit()
 .times(6)
 .path()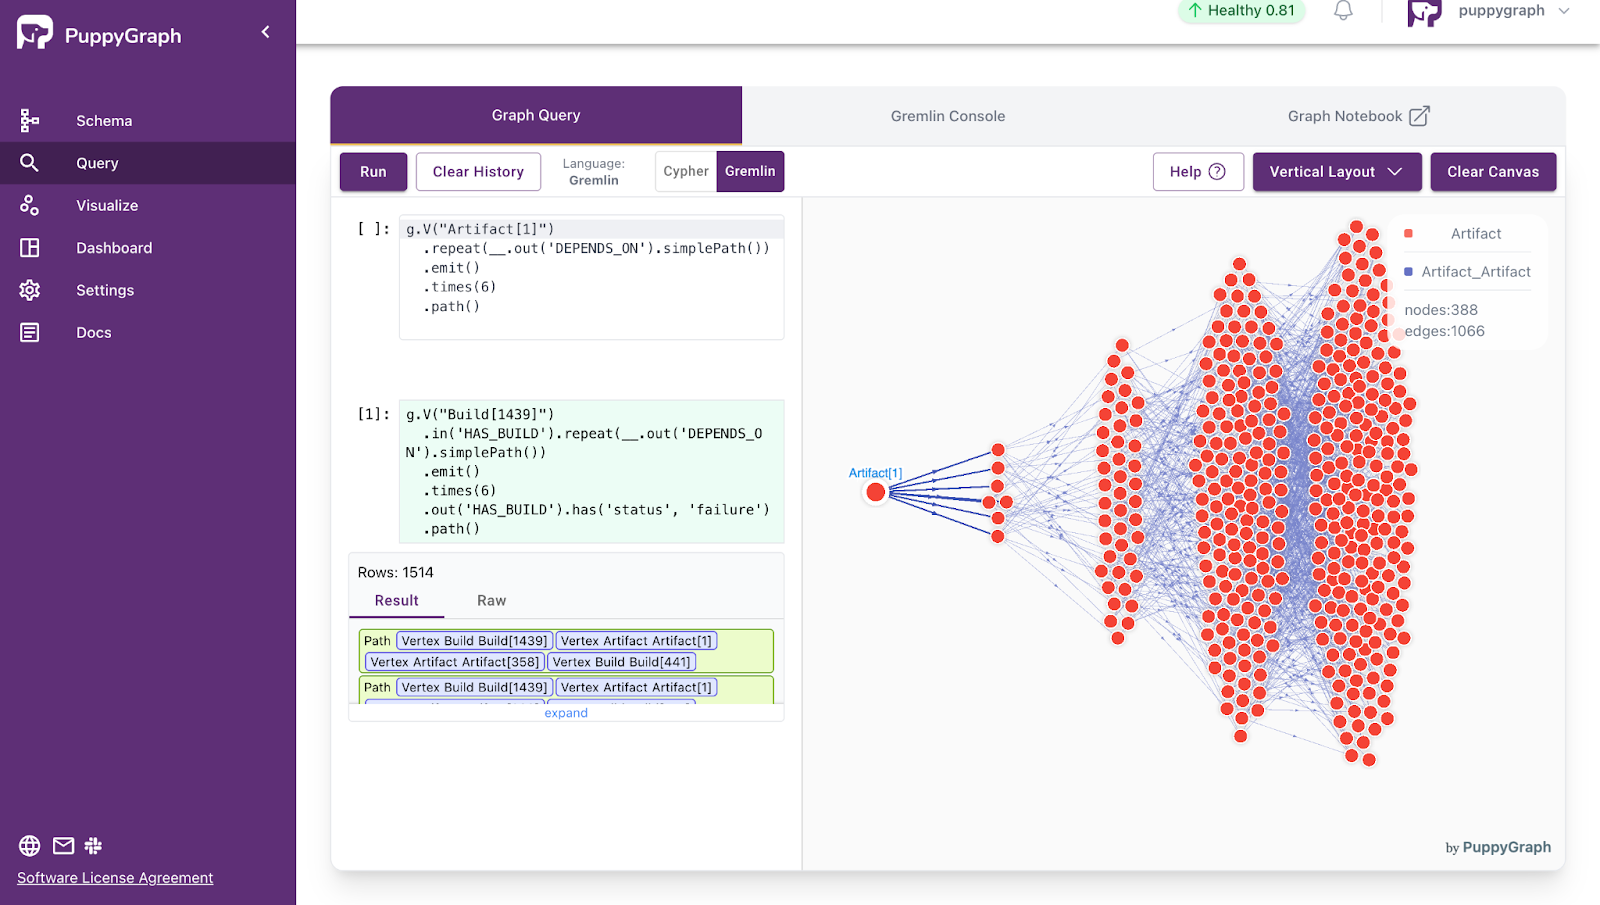
- Query the construction history of a certain artifact
g.V("Artifact[1]").out('HAS_BUILD').path()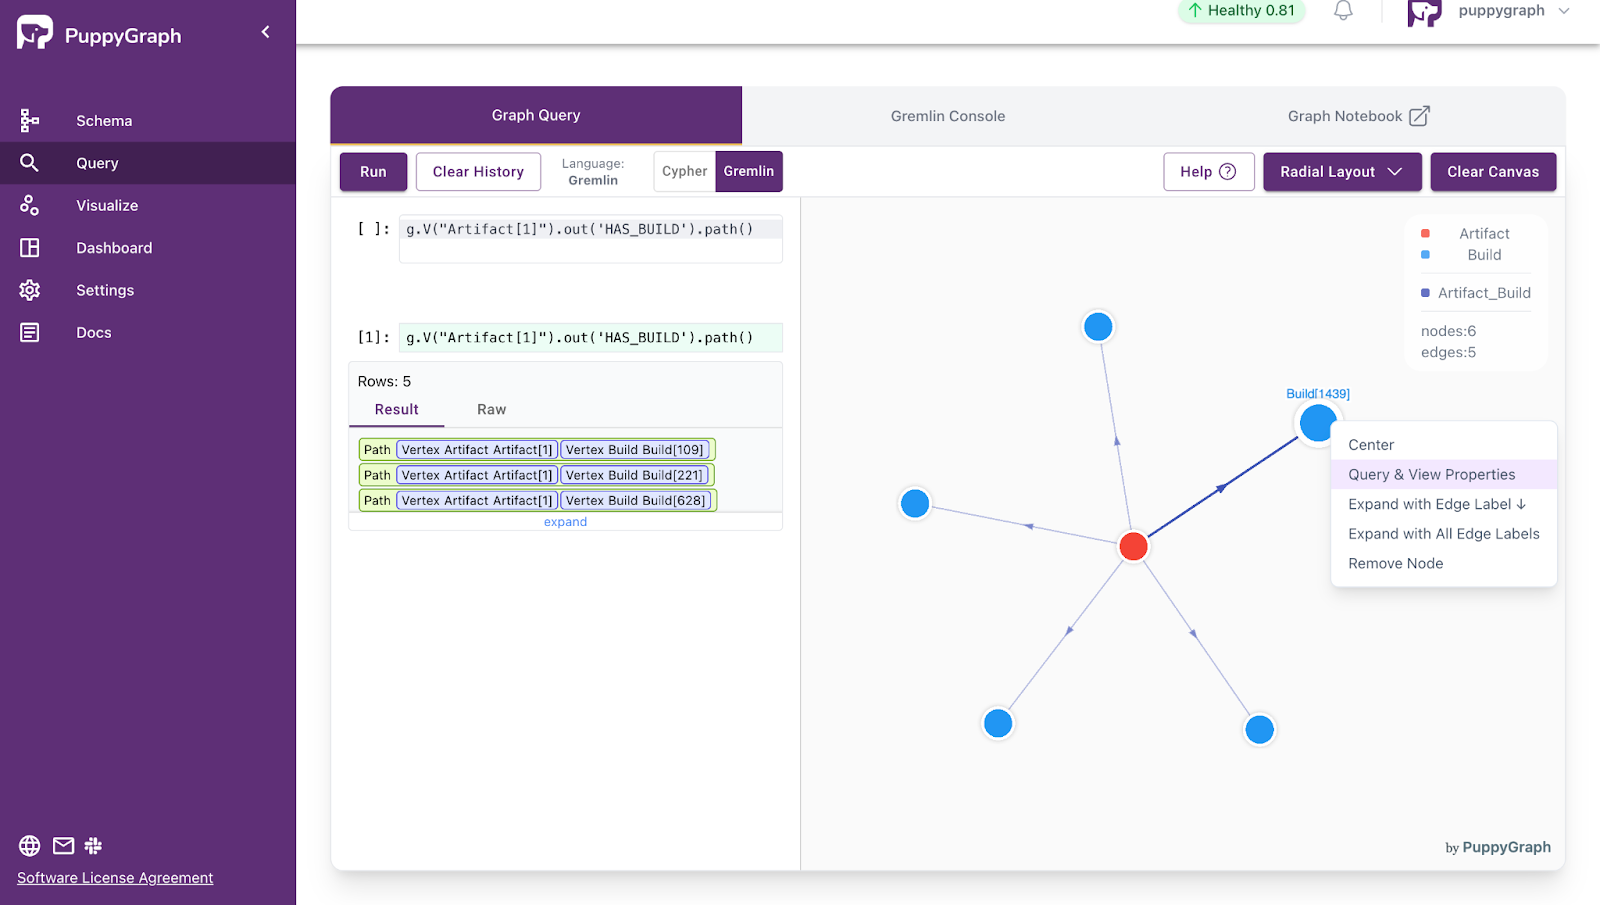
- Query all failing build records and dependencies related to a certain build
g.V("Build[1439]")
 .in('HAS_BUILD')
 .repeat(__.out('DEPENDS_ON').simplePath())
 .emit()
 .times(6)
 .out('HAS_BUILD').has('status', 'failure')
 .path()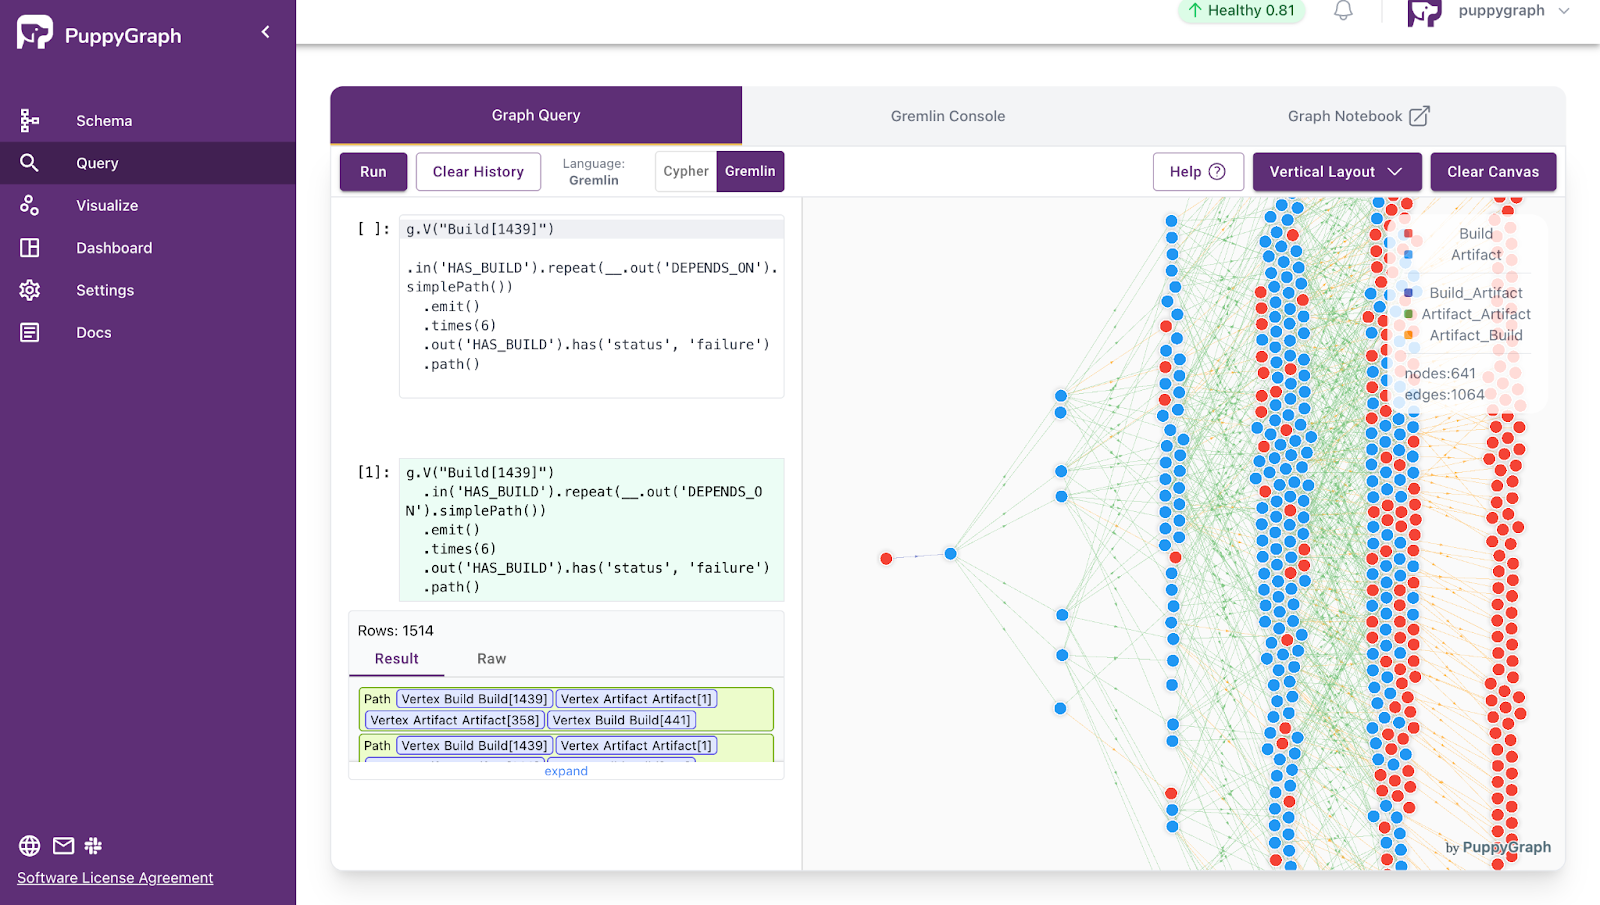
PuppyGraph is already used by half of the top 20 cybersecurity companies, as well as engineering-driven enterprises like AMD and Coinbase. Whether it’s multi-hop security reasoning, asset intelligence, or deep relationship queries across massive datasets, these teams trust PuppyGraph to replace slow ETL pipelines and complex graph stacks with a simpler, faster architecture.


Conclusion
Software dependency graphs offer a structured way to understand complex systems. Whether you’re debugging a failing build, planning a large-scale refactor, or improving your CI/CD pipeline, representing dependencies as a graph makes it easier to trace relationships, identify bottlenecks, and avoid surprises.
While creating and analyzing these graphs can seem complex, tools like PuppyGraph make the process more accessible. By combining interactive visualization with graph-native querying, teams can go from raw metadata to actionable insights in minutes.
If you’d like to explore your own software dependencies, check out our forever-free PuppyGraph Developer Edition or book a demo with our expert graph team.

Jaz Ku is a Solution Architect with a background in Computer Science and an interest in technical writing. She earned her Bachelor's degree from the University of San Francisco, where she did research involving Rust’s compiler infrastructure. Jaz enjoys the challenge of explaining complex ideas in a clear and straightforward way.

Get started with PuppyGraph!


Developer Edition
- Forever free
- Single noded
- Designed for proving your ideas
- Available via Docker install
Enterprise Edition
- 30-day free trial with full features
- Everything in developer edition & enterprise features
- Designed for production
- Available via AWS AMI & Docker install