Supply Chain Graph: Visualize & Optimize Your Supply Chain Data

Sa Wang
|
Software Engineer
|
January 23, 2025
Supply Chain Graph: Visualize & Optimize Your Supply Chain Data

Resilinc reports a staggering 8,197 supply chain disruptions in the first half of 2023 alone, a 3% increase from the supply chain and labor disruptions increased through the first half of 2023 previous year. Because of the volatile and evolving nature of the business landscape, you must understand and optimize your supply chain to stay profitable and sustainable.

In this article, we explore how supply chain graphs empower you to visualize, analyze, and ultimately improve your supply chain operations. We'll discuss the core components, different types of graphs, and some real-world examples. In the end, we walk you through building a fully-fledged supply chain graph using PuppyGraph

By the end, you'll understand how this powerful tool can unlock valuable insights and drive better decision-making within your organization.

What is a Supply Chain Graph?

A supply chain graph is a visual representation that maps out your entire supply chain network - from raw material suppliers to end customers - using an intuitive system of connected points and lines. Think of it as a powerful lens that lets you see your complete supply chain ecosystem at a glance, while also allowing you to zoom in on specific relationships and flows.

Figure:an example of supply chain graph.

At its core, a supply chain graph consists of two main elements:

  • Nodes (represented as points) show the key players and locations in your supply chain, such as suppliers, manufacturers, warehouses, distribution centers, and customers.
  • Edges (shown as lines connecting the nodes) represent the relationships and interactions between these entities, such as material flows, shipments, or business partnerships.

For example, in a typical supply chain graph, you might see:

  • A supplier node connected to multiple manufacturer nodes, showing who provides critical components
  • Manufacturing plants connected to various warehouse nodes, indicating where finished products are stored
  • Distribution centers linked to retail locations, mapping out the delivery network
  • Customer nodes connected to retail points, revealing purchasing patterns

What makes supply chain graphs particularly powerful is their ability to capture complex relationships and dependencies. Unlike traditional spreadsheets or flowcharts, a graph can simultaneously show multiple types of relationships and their interconnections. For instance, you can see not only how materials flow from suppliers to manufacturers but also how a delay at one supplier might impact multiple production lines and ultimately affect customer deliveries.

This visualization technology also enables sophisticated analysis of your supply chain network. You can:

  • Trace products from raw materials to end customers
  • Identify potential bottlenecks or single points of failure
  • Discover hidden dependencies between different parts of your supply chain
  • Analyze the ripple effects of disruptions
  • Optimize routes and inventory levels
  • Monitor and improve supplier relationships

The real power of supply chain graphs lies in their ability to turn complex supply chain data into clear, actionable insights. Whether you're planning inventory levels, managing risk, or optimizing delivery routes, a supply chain graph helps you see the bigger picture while maintaining access to granular details when needed.

Analytical Powers of Supply Chain Graphs

Supply chain graphs derive their power from sophisticated analytical capabilities that transform complex data into actionable insights. Here's how these analytical engines work:

Hierarchical Analysis

Supply chain graphs can process and analyze data at multiple levels of detail:

  • Multi-level Processing: Break down complex networks into manageable hierarchies
  • Drill-down Capabilities: Move seamlessly from global views to granular details
  • Aggregation Functions: Combine data at different organizational levels
  • Pattern Recognition: Identify trends across different hierarchical levels

For example, a retailer can analyze performance from global markets down to individual stores, identifying patterns that might be invisible at any single level.

Network Analysis Algorithms

At the heart of supply chain graphs lie powerful algorithms that analyze network structures:

  • Path Analysis: Calculate optimal routes through complex networks
  • Centrality Measures: Identify critical nodes and relationships
  • Community Detection: Find naturally occurring clusters and groups
  • Flow Analysis: Track and optimize movement through the network

These algorithms enable sophisticated analysis of your supply chain's structure, revealing insights about efficiency and vulnerability.

Real-time Processing

Supply chain graphs can process and analyze data as it changes:

  • Stream Processing: Analyze data as it arrives
  • Event Detection: Identify significant changes or anomalies
  • Dynamic Routing: Adjust paths based on current conditions
  • Live Monitoring: Track performance in real-time

This capability enables immediate responses to changing conditions, from traffic delays to supplier issues.

Predictive Analytics

Supply chain graphs can leverage historical data to forecast future states:

  • Pattern Learning: Identify recurring patterns in supply chain behavior
  • Trend Analysis: Project future trends based on historical data
  • Risk Prediction: Forecast potential disruptions
  • Demand Forecasting: Predict future resource needs

Types of Supply Chain Graphs

Different types of supply chain graphs serve distinct visualization and analysis needs. Each type provides a unique lens through which to view your supply chain:

Product Flow Graphs

Product flow graphs visualize the physical movement of materials, components, and finished goods through your supply chain network. Nodes represent physical locations like suppliers, manufacturing plants, and warehouses, while edges show the movement of goods between these locations. For example, in an automotive supply chain, these graphs track how raw materials move through production facilities to become finished vehicles, helping identify bottlenecks and optimization opportunities in the physical flow of goods.

Information Flow Graphs

Information flow graphs map the communication patterns across your supply chain network. They show how data like purchase orders, forecasts, and quality reports move between different systems and organizations. Consider a retail supply chain where point-of-sale data flows from stores to central planning systems, triggering reorder processes and generating supplier forecasts. These graphs help identify communication gaps and improve data sharing efficiency.

Financial Flow Graphs

Financial flow graphs capture monetary relationships and transactions within your supply chain. They track payment flows, cost structures, and financial risks between buyers, suppliers, and service providers. For example, in a global manufacturing operation, these graphs might reveal opportunities to optimize payment timing, reduce transaction costs, or implement early payment discounts across different regions and suppliers.

Dependency Graphs

Dependency graphs reveal how different elements of your supply chain rely on each other. They highlight critical relationships between suppliers, products, and resources that might not be apparent in other visualizations. For instance, in a pharmaceutical supply chain, these graphs might show how multiple finished products depend on a single active ingredient supplier, helping identify potential vulnerabilities and areas needing redundancy.

Temporal Graphs

Temporal graphs show how your supply chain changes over time, revealing patterns in relationships, flows, and performance metrics. They help understand seasonal variations, growth trends, and network evolution. A fashion retailer might use temporal graphs to visualize how their supply chain adapts to seasonal collections, with different suppliers and routes activating throughout the year.

Hybrid Graphs

Hybrid graphs combine multiple graph types to provide a comprehensive view of supply chain operations. They might simultaneously show product movements, information flows, and financial relationships. This integration helps understand how different aspects of the supply chain interact – for example, how physical product flows relate to payment terms and communication patterns.

Organizations often use multiple graph types together to gain a complete understanding of their supply chain operations. The choice of graph type depends on your specific analysis needs and the aspects of the supply chain you want to optimize.

Applications of Supply Chain Graphs

Let's explore how businesses apply supply chain graphs to solve real-world challenges:

Risk Management

Real-world example: A global electronics manufacturer uses supply chain graphs to identify single-source components in their production line. When geopolitical tensions threatened access to a key supplier, the graph analysis helped them quickly identify alternative suppliers and reroute production, avoiding costly disruptions.

Inventory Optimization

Case study: A retail chain applies graph analysis to optimize inventory across 500 stores. By analyzing seasonal patterns, local demographics, and store performance, they reduced excess inventory by 23% while maintaining service levels.

Network Design

Example: A logistics company used graph analysis to redesign their distribution network. The analysis revealed that adding two strategic distribution centers would reduce delivery times by 40% while cutting transportation costs by 15%.

Quality Control and Compliance

Real-world application: A pharmaceutical company uses supply chain graphs to maintain regulatory compliance. When a quality issue emerges, they can trace affected products through their entire supply chain within minutes, enabling precise recalls and minimizing disruption.

Sustainability Monitoring

Case study: A consumer goods company employs graph analysis to track their environmental impact. They mapped their entire supply chain's carbon footprint, identifying opportunities that reduced emissions by 30% while maintaining operational efficiency.

How To Create Supply Chain Graphs?

If you have the right toolset, you can make the best use of the versatility and viability of supply chain graphs to solve diverse challenges. PuppyGraph makes it super easy to build and deploy supply chain graphs using your existing relational data. It is the first and only graph query engine that queries the relational data from all your data sources as a unified graph, eliminating the need for complex ETL processes or data duplication. You gain access to graph-based analytics and visualization features while keeping your data in its original relational format. PuppyGrpah compliments the familiarity and reliability of relational databases with the analytical prowess of graph databases.

Build a Supply Chain Graph With PuppyGraph

Let's build a supply chain graph using PuppyGraph. You can find all resources for this tutorial in the GitHub repository for our Amazon Redshift demo. However, in this blog post, we will create a local storage version using Minio for Iceberg table format.

Before you Start

Before you proceed with the tutorial, make sure you have the following installed on your system:

  • Docker and Docker Compose
  • Python 3

Data Preparation

We will use the same data as our Amazon Redshift demo version. Download the csv_data folder. Then run the Python script to convert the CSV data into Parquet format.

python3 CsvToParquet.py ./csv_data ./parquet_data

Environment Setup and Deployment

Create a docker compose file `docker-compose.yaml`:

YAML

services:
 spark-iceberg:
   image: tabulario/spark-iceberg
   container_name: spark-iceberg
   build: spark/
   networks:
     iceberg_net:
   depends_on:
     - rest
     - minio
   volumes:
     - ./warehouse:/home/iceberg/warehouse
     - ./notebooks:/home/iceberg/notebooks/notebooks
     - ./parquet_data:/parquet_data
   environment:
     - AWS_ACCESS_KEY_ID=admin
     - AWS_SECRET_ACCESS_KEY=password
     - AWS_REGION=us-east-1
   ports:
     - 8888:8888
     - 8180:8080
     - 10000:10000
     - 10001:10001
 rest:
   image: tabulario/iceberg-rest
   container_name: iceberg-rest
   networks:
     iceberg_net:
   ports:
     - 8181:8181
   environment:
     - AWS_ACCESS_KEY_ID=admin
     - AWS_SECRET_ACCESS_KEY=password
     - AWS_REGION=us-east-1
     - CATALOG_WAREHOUSE=s3://warehouse/
     - CATALOG_IO__IMPL=org.apache.iceberg.aws.s3.S3FileIO
     - CATALOG_S3_ENDPOINT=http://minio:9000
 minio:
   image: minio/minio
   container_name: minio
   environment:
     - MINIO_ROOT_USER=admin
     - MINIO_ROOT_PASSWORD=password
     - MINIO_DOMAIN=minio
   networks:
     iceberg_net:
       aliases:
         - warehouse.minio
   ports:
     - 9001:9001
     - 9000:9000
   command: ["server", "/data", "--console-address", ":9001"]
 mc:
   depends_on:
     - minio
   image: minio/mc
   container_name: mc
   networks:
     iceberg_net:
   environment:
     - AWS_ACCESS_KEY_ID=admin
     - AWS_SECRET_ACCESS_KEY=password
     - AWS_REGION=us-east-1
   entrypoint: >
     /bin/sh -c "
     until (/usr/bin/mc config host add minio http://minio:9000 admin password) do echo '...waiting...' && sleep 1; done;
     /usr/bin/mc rm -r --force minio/warehouse;
     /usr/bin/mc mb minio/warehouse;
     /usr/bin/mc policy set public minio/warehouse;
     tail -f /dev/null
     "
 puppygraph:
   image: puppygraph/puppygraph:stable
   container_name: puppygraph
   networks:
     iceberg_net:
   environment:
     - PUPPYGRAPH_USERNAME=puppygraph
     - PUPPYGRAPH_PASSWORD=puppygraph123
   ports:
     - "8081:8081"
     - "8182:8182"
     - "7687:7687"
   depends_on:
     - spark-iceberg
networks:
 iceberg_net:
   name: puppy-iceberg

The docker-compose.yaml file launches a complete environment with five key services:

  • spark-iceberg: handles Apache Iceberg data processing and analytics
  • rest: manages Iceberg tables through a RESTful API interface
  • minio: provides S3-compatible object storage functionality
  • mc: configures MinIO buckets and access policies
  • puppygraph: enables graph analysis directly on your relational data

Run the command to start the services.

docker compose up -d

Data Import

Now we'll import our data into Apache Iceberg tables. Connect to the Spark-SQL shell:

docker exec -it spark-iceberg spark-sql

Execute the provided SQL commands to create and populate the tables.

SQL

CREATE DATABASE supply;

CREATE EXTERNAL TABLE supply.customers (
   id           BIGINT,
   customername STRING,
   city         STRING,
   state        STRING,
   location_id  BIGINT
) USING iceberg;

CREATE EXTERNAL TABLE supply.distance (
   id          BIGINT,
   from_loc_id BIGINT,
   to_loc_id   BIGINT,
   distance    DOUBLE
) USING iceberg;

CREATE EXTERNAL TABLE supply.factory (
   id            BIGINT,
   factoryname   STRING,
   locationid    BIGINT
) USING iceberg;

CREATE EXTERNAL TABLE supply.inventory (
   id           BIGINT,
   productid    BIGINT,
   locationid   BIGINT,
   quantity     INT,
   lastupdated  TIMESTAMP,
   status       STRING
) USING iceberg;

CREATE EXTERNAL TABLE supply.locations (
   id       BIGINT,
   address  STRING,
   city     STRING,
   country  STRING,
   lat      DOUBLE,
   lng      DOUBLE
) USING iceberg;

CREATE EXTERNAL TABLE supply.materialfactory (
   id          BIGINT,
   material_id BIGINT,
   factory_id  BIGINT
) USING iceberg;

CREATE EXTERNAL TABLE supply.materialinventory (
   id           BIGINT,
   materialid   BIGINT,
   locationid   BIGINT,
   quantity     BIGINT,
   lastupdated  TIMESTAMP,
   status       STRING
) USING iceberg;

CREATE EXTERNAL TABLE supply.materialorders (
   id                   BIGINT,
   materialid           BIGINT,
   factoryid            BIGINT,
   quantity             BIGINT,
   orderdate            TIMESTAMP,
   expectedarrivaldate  TIMESTAMP,
   status               STRING
) USING iceberg;

CREATE EXTERNAL TABLE supply.materials (
   id            BIGINT,
   materialname  STRING
) USING iceberg;

CREATE EXTERNAL TABLE supply.productcomposition (
   id         BIGINT,
   productid  BIGINT,
   materialid BIGINT,
   quantity   BIGINT
) USING iceberg;

CREATE EXTERNAL TABLE supply.products (
   id           BIGINT,
   productname  STRING,
   price        DOUBLE
) USING iceberg;

CREATE EXTERNAL TABLE supply.productsales (
   id         BIGINT,
   productid  BIGINT,
   customerid BIGINT,
   quantity   BIGINT,
   saledate   TIMESTAMP,
   totalprice DOUBLE
) USING iceberg;

CREATE EXTERNAL TABLE supply.productshipment (
   id                   BIGINT,
   productid            BIGINT,
   fromlocationid       BIGINT,
   tolocationid         BIGINT,
   quantity             BIGINT,
   shipmentdate         TIMESTAMP,
   expectedarrivaldate  TIMESTAMP,
   status               STRING
) USING iceberg;

INSERT INTO supply.customers
SELECT
   id,
   customername,
   city,
   state,
   location_id
FROM parquet.`/parquet_data/customers.parquet`;

INSERT INTO supply.distance
SELECT
   id,
   from_loc_id,
   to_loc_id,
   distance
FROM parquet.`/parquet_data/distance.parquet`;

INSERT INTO supply.factory
SELECT
   id,
   factoryname,
   locationid
FROM parquet.`/parquet_data/factory.parquet`;


INSERT INTO supply.inventory
SELECT
   id,
   productid,
   locationid,
   quantity,
   CAST(lastupdated AS TIMESTAMP) AS lastupdated,
   status
FROM parquet.`/parquet_data/inventory.parquet`;

INSERT INTO supply.locations
SELECT
   id,
   address,
   city,
   country,
   lat,
   lng
FROM parquet.`/parquet_data/locations.parquet`;

INSERT INTO supply.materialfactory
SELECT
   id,
   material_id,
   factory_id
FROM parquet.`/parquet_data/materialfactory.parquet`;

INSERT INTO supply.materialinventory
SELECT
   id,
   materialid,
   locationid,
   quantity,
   CAST(lastupdated AS TIMESTAMP) AS lastupdated,
   status
FROM parquet.`/parquet_data/materialinventory.parquet`;

INSERT INTO supply.materialorders
SELECT
   id,
   materialid,
   factoryid,
   quantity,
   CAST(orderdate AS TIMESTAMP) AS orderdate,
   CAST(expectedarrivaldate AS TIMESTAMP) AS expectedarrivaldate,
   status
FROM parquet.`/parquet_data/materialorders.parquet`;

INSERT INTO supply.materials
SELECT
   id,
   materialname
FROM parquet.`/parquet_data/materials.parquet`;

INSERT INTO supply.productcomposition
SELECT
   id,
   productid,
   materialid,
   quantity
FROM parquet.`/parquet_data/productcomposition.parquet`;


INSERT INTO supply.products
SELECT
   id,
   productname,
   price
FROM parquet.`/parquet_data/products.parquet`;


INSERT INTO supply.productsales
SELECT
   id,
   productid,
   customerid,
   quantity,
   CAST(saledate AS TIMESTAMP) AS saledate,
   totalprice
FROM parquet.`/parquet_data/productsales.parquet`;

INSERT INTO supply.productshipment
SELECT
   id,
   productid,
   fromlocationid,
   tolocationid,
   quantity,
   CAST(shipmentdate AS TIMESTAMP) AS shipmentdate,
   CAST(expectedarrivaldate AS TIMESTAMP) AS expectedarrivaldate,
   status
FROM parquet.`/parquet_data/productshipment.parquet`;

Model the graph

Access the PuppyGraph Web UI at http://localhost:8081 using the default credentials:

  • Username: puppygraph
  • Password: puppygraph123
Figure: PuppyGraph UI graph schema builder

Upload the schema using the provided schema.json file, which defines the schema of the supply chain graph. This schema extracts vertices and edges from the relational tables.

JSON

{
 "catalogs": [
   {
     "name": "iceberg_test",
     "type": "iceberg",
     "metastore": {
       "type": "rest",
       "uri": "http://iceberg-rest:8181"
     },
     "storage": {
       "useInstanceProfile": "false",
       "accessKey": "admin",
       "secretKey": "password",
       "enableSsl": "false",
       "endpoint": "http://minio:9000",
       "enablePathStyleAccess": "true",
       "type": "S3"
     }
   }
 ],
 "graph": {
   "vertices": [
     {
       "label": "Product",
       "oneToOne": {
         "tableSource": {
           "catalog": "iceberg_test",
           "schema": "supply",
           "table": "products"
         },
         "id": {
           "fields": [
             {
               "type": "Long",
               "field": "id",
               "alias": "id"
             }
           ]
         },
         "attributes": [
           {
             "type": "String",
             "field": "productname",
             "alias": "productname"
           },
           {
             "type": "Double",
             "field": "price",
             "alias": "price"
           }
         ]
       }
     },
     {
       "label": "Factory",
       "oneToOne": {
         "tableSource": {
           "catalog": "iceberg_test",
           "schema": "supply",
           "table": "factory"
         },
         "id": {
           "fields": [
             {
               "type": "Long",
               "field": "id",
               "alias": "id"
             }
           ]
         },
         "attributes": [
           {
             "type": "String",
             "field": "factoryname",
             "alias": "factoryname"
           },
           {
             "type": "Long",
             "field": "locationid",
             "alias": "locationid"
           }
         ]
       }
     },
     {
       "label": "Location",
       "oneToOne": {
         "tableSource": {
           "catalog": "iceberg_test",
           "schema": "supply",
           "table": "locations"
         },
         "id": {
           "fields": [
             {
               "type": "Long",
               "field": "id",
               "alias": "id"
             }
           ]
         },
         "attributes": [
           {
             "type": "String",
             "field": "address",
             "alias": "address"
           },
           {
             "type": "String",
             "field": "city",
             "alias": "city"
           },
           {
             "type": "String",
             "field": "country",
             "alias": "country"
           },
           {
             "type": "Double",
             "field": "lat",
             "alias": "lat"
           },
           {
             "type": "Double",
             "field": "lng",
             "alias": "lng"
           }
         ]
       }
     },
     {
       "label": "Inventory",
       "oneToOne": {
         "tableSource": {
           "catalog": "iceberg_test",
           "schema": "supply",
           "table": "inventory"
         },
         "id": {
           "fields": [
             {
               "type": "Long",
               "field": "id",
               "alias": "id"
             }
           ]
         },
         "attributes": [
           {
             "type": "Int",
             "field": "quantity",
             "alias": "quantity"
           },
           {
             "type": "DateTime",
             "field": "lastupdated",
             "alias": "lastupdated"
           },
           {
             "type": "String",
             "field": "status",
             "alias": "status"
           }
         ]
       }
     },
     {
       "label": "MatInventory",
       "oneToOne": {
         "tableSource": {
           "catalog": "iceberg_test",
           "schema": "supply",
           "table": "materialinventory"
         },
         "id": {
           "fields": [
             {
               "type": "Long",
               "field": "id",
               "alias": "id"
             }
           ]
         },
         "attributes": [
           {
             "type": "Long",
             "field": "quantity",
             "alias": "quantity"
           },
           {
             "type": "DateTime",
             "field": "lastupdated",
             "alias": "lastupdated"
           },
           {
             "type": "String",
             "field": "status",
             "alias": "status"
           }
         ]
       }
     },
     {
       "label": "Material",
       "oneToOne": {
         "tableSource": {
           "catalog": "iceberg_test",
           "schema": "supply",
           "table": "materials"
         },
         "id": {
           "fields": [
             {
               "type": "Long",
               "field": "id",
               "alias": "id"
             }
           ]
         },
         "attributes": [
           {
             "type": "String",
             "field": "materialname",
             "alias": "materialname"
           }
         ]
       }
     },
     {
       "label": "Customer",
       "oneToOne": {
         "tableSource": {
           "catalog": "iceberg_test",
           "schema": "supply",
           "table": "customers"
         },
         "id": {
           "fields": [
             {
               "type": "Long",
               "field": "id",
               "alias": "id"
             }
           ]
         },
         "attributes": [
           {
             "type": "String",
             "field": "customername",
             "alias": "customername"
           },
           {
             "type": "String",
             "field": "city",
             "alias": "city"
           }
         ]
       }
     },
     {
       "label": "ProductOrder",
       "oneToOne": {
         "tableSource": {
           "catalog": "iceberg_test",
           "schema": "supply",
           "table": "productsales"
         },
         "id": {
           "fields": [
             {
               "type": "Long",
               "field": "id",
               "alias": "id"
             }
           ]
         },
         "attributes": [
           {
             "type": "Long",
             "field": "customerid",
             "alias": "customerid"
           },
           {
             "type": "Long",
             "field": "productid",
             "alias": "productid"
           },
           {
             "type": "Long",
             "field": "quantity",
             "alias": "quantity"
           },
           {
             "type": "DateTime",
             "field": "saledate",
             "alias": "saledate"
           },
           {
             "type": "Double",
             "field": "totalprice",
             "alias": "totalprice"
           }
         ]
       }
     },
     {
       "label": "MaterialOrder",
       "oneToOne": {
         "tableSource": {
           "catalog": "iceberg_test",
           "schema": "supply",
           "table": "materialorders"
         },
         "id": {
           "fields": [
             {
               "type": "Long",
               "field": "id",
               "alias": "id"
             }
           ]
         },
         "attributes": [
           {
             "type": "Long",
             "field": "materialid",
             "alias": "materialid"
           },
           {
             "type": "Long",
             "field": "factoryid",
             "alias": "factoryid"
           },
           {
             "type": "Long",
             "field": "quantity",
             "alias": "quantity"
           },
           {
             "type": "DateTime",
             "field": "orderdate",
             "alias": "orderdate"
           },
           {
             "type": "DateTime",
             "field": "expectedarrivaldate",
             "alias": "expectedarrivaldate"
           },
           {
             "type": "String",
             "field": "status",
             "alias": "status"
           }
         ]
       }
     }
   ],
   "edges": [
     {
       "label": "FactoryLocation",
       "fromVertex": "Factory",
       "toVertex": "Location",
       "tableSource": {
         "catalog": "iceberg_test",
         "schema": "supply",
         "table": "factory"
       },
       "id": {
         "fields": [
           {
             "type": "Long",
             "field": "id",
             "alias": "id"
           }
         ]
       },
       "fromId": {
         "fields": [
           {
             "type": "Long",
             "field": "id",
             "alias": "from_id"
           }
         ]
       },
       "toId": {
         "fields": [
           {
             "type": "Long",
             "field": "locationid",
             "alias": "locationid"
           }
         ]
       },
       "attributes": []
     },
     {
       "label": "ProductInventory",
       "fromVertex": "Product",
       "toVertex": "Inventory",
       "tableSource": {
         "catalog": "iceberg_test",
         "schema": "supply",
         "table": "inventory"
       },
       "id": {
         "fields": [
           {
             "type": "Long",
             "field": "id",
             "alias": "id"
           }
         ]
       },
       "fromId": {
         "fields": [
           {
             "type": "Long",
             "field": "productid",
             "alias": "productid"
           }
         ]
       },
       "toId": {
         "fields": [
           {
             "type": "Long",
             "field": "id",
             "alias": "to_id"
           }
         ]
       },
       "attributes": [
         {
           "type": "Int",
           "field": "quantity",
           "alias": "quantity"
         },
         {
           "type": "DateTime",
           "field": "lastupdated",
           "alias": "lastupdated"
         }
       ]
     },
     {
       "label": "InventoryLocation",
       "fromVertex": "Inventory",
       "toVertex": "Location",
       "tableSource": {
         "catalog": "iceberg_test",
         "schema": "supply",
         "table": "inventory"
       },
       "id": {
         "fields": [
           {
             "type": "Long",
             "field": "id",
             "alias": "id"
           }
         ]
       },
       "fromId": {
         "fields": [
           {
             "type": "Long",
             "field": "id",
             "alias": "from_id"
           }
         ]
       },
       "toId": {
         "fields": [
           {
             "type": "Long",
             "field": "locationid",
             "alias": "locationid"
           }
         ]
       },
       "attributes": []
     },
     {
       "label": "CustomerLocation",
       "fromVertex": "Customer",
       "toVertex": "Location",
       "tableSource": {
         "catalog": "iceberg_test",
         "schema": "supply",
         "table": "customers"
       },
       "id": {
         "fields": [
           {
             "type": "Long",
             "field": "id",
             "alias": "id"
           }
         ]
       },
       "fromId": {
         "fields": [
           {
             "type": "Long",
             "field": "id",
             "alias": "from_id"
           }
         ]
       },
       "toId": {
         "fields": [
           {
             "type": "Long",
             "field": "location_id",
             "alias": "location_id"
           }
         ]
       },
       "attributes": []
     },
     {
       "label": "ProductComposition",
       "fromVertex": "Product",
       "toVertex": "Material",
       "tableSource": {
         "catalog": "iceberg_test",
         "schema": "supply",
         "table": "productcomposition"
       },
       "id": {
         "fields": [
           {
             "type": "Long",
             "field": "id",
             "alias": "id"
           }
         ]
       },
       "fromId": {
         "fields": [
           {
             "type": "Long",
             "field": "productid",
             "alias": "productid"
           }
         ]
       },
       "toId": {
         "fields": [
           {
             "type": "Long",
             "field": "materialid",
             "alias": "materialid"
           }
         ]
       },
       "attributes": [
         {
           "type": "Long",
           "field": "quantity",
           "alias": "quantity"
         }
       ]
     },
     {
       "label": "ProOrderToPro",
       "fromVertex": "ProductOrder",
       "toVertex": "Product",
       "tableSource": {
         "catalog": "iceberg_test",
         "schema": "supply",
         "table": "productsales"
       },
       "id": {
         "fields": [
           {
             "type": "Long",
             "field": "id",
             "alias": "id"
           }
         ]
       },
       "fromId": {
         "fields": [
           {
             "type": "Long",
             "field": "id",
             "alias": "from_id"
           }
         ]
       },
       "toId": {
         "fields": [
           {
             "type": "Long",
             "field": "productid",
             "alias": "productid"
           }
         ]
       },
       "attributes": [
         {
           "type": "Long",
           "field": "quantity",
           "alias": "quantity"
         }
       ]
     },
     {
       "label": "ProOrderToCus",
       "fromVertex": "ProductOrder",
       "toVertex": "Customer",
       "tableSource": {
         "catalog": "iceberg_test",
         "schema": "supply",
         "table": "productsales"
       },
       "id": {
         "fields": [
           {
             "type": "Long",
             "field": "id",
             "alias": "id"
           }
         ]
       },
       "fromId": {
         "fields": [
           {
             "type": "Long",
             "field": "id",
             "alias": "from_id"
           }
         ]
       },
       "toId": {
         "fields": [
           {
             "type": "Long",
             "field": "customerid",
             "alias": "customerid"
           }
         ]
       },
       "attributes": [
         {
           "type": "Long",
           "field": "quantity",
           "alias": "quantity"
         }
       ]
     },
     {
       "label": "MatOrderToMat",
       "fromVertex": "MaterialOrder",
       "toVertex": "Material",
       "tableSource": {
         "catalog": "iceberg_test",
         "schema": "supply",
         "table": "materialorders"
       },
       "id": {
         "fields": [
           {
             "type": "Long",
             "field": "id",
             "alias": "id"
           }
         ]
       },
       "fromId": {
         "fields": [
           {
             "type": "Long",
             "field": "id",
             "alias": "from_id"
           }
         ]
       },
       "toId": {
         "fields": [
           {
             "type": "Long",
             "field": "materialid",
             "alias": "materialid"
           }
         ]
       },
       "attributes": [
         {
           "type": "Long",
           "field": "quantity",
           "alias": "quantity"
         }
       ]
     },
     {
       "label": "MatOrderToFac",
       "fromVertex": "MaterialOrder",
       "toVertex": "Factory",
       "tableSource": {
         "catalog": "iceberg_test",
         "schema": "supply",
         "table": "materialorders"
       },
       "id": {
         "fields": [
           {
             "type": "Long",
             "field": "id",
             "alias": "id"
           }
         ]
       },
       "fromId": {
         "fields": [
           {
             "type": "Long",
             "field": "id",
             "alias": "from_id"
           }
         ]
       },
       "toId": {
         "fields": [
           {
             "type": "Long",
             "field": "factoryid",
             "alias": "factoryid"
           }
         ]
       },
       "attributes": [
         {
           "type": "Long",
           "field": "quantity",
           "alias": "quantity"
         }
       ]
     },
     {
       "label": "MaterialInventory",
       "fromVertex": "Material",
       "toVertex": "MatInventory",
       "tableSource": {
         "catalog": "iceberg_test",
         "schema": "supply",
         "table": "materialinventory"
       },
       "id": {
         "fields": [
           {
             "type": "Long",
             "field": "id",
             "alias": "id"
           }
         ]
       },
       "fromId": {
         "fields": [
           {
             "type": "Long",
             "field": "materialid",
             "alias": "materialid"
           }
         ]
       },
       "toId": {
         "fields": [
           {
             "type": "Long",
             "field": "id",
             "alias": "to_id"
           }
         ]
       },
       "attributes": [
         {
           "type": "Long",
           "field": "quantity",
           "alias": "quantity"
         },
         {
           "type": "DateTime",
           "field": "lastupdated",
           "alias": "lastupdated"
         }
       ]
     },
     {
       "label": "MatInventoryLocation",
       "fromVertex": "MatInventory",
       "toVertex": "Location",
       "tableSource": {
         "catalog": "iceberg_test",
         "schema": "supply",
         "table": "materialinventory"
       },
       "id": {
         "fields": [
           {
             "type": "Long",
             "field": "id",
             "alias": "id"
           }
         ]
       },
       "fromId": {
         "fields": [
           {
             "type": "Long",
             "field": "id",
             "alias": "from_id"
           }
         ]
       },
       "toId": {
         "fields": [
           {
             "type": "Long",
             "field": "locationid",
             "alias": "locationid"
           }
         ]
       },
       "attributes": []
     },
     {
       "label": "MatFactory",
       "fromVertex": "Material",
       "toVertex": "Factory",
       "tableSource": {
         "catalog": "iceberg_test",
         "schema": "supply",
         "table": "materialfactory"
       },
       "id": {
         "fields": [
           {
             "type": "Long",
             "field": "id",
             "alias": "id"
           }
         ]
       },
       "fromId": {
         "fields": [
           {
             "type": "Long",
             "field": "material_id",
             "alias": "material_id"
           }
         ]
       },
       "toId": {
         "fields": [
           {
             "type": "Long",
             "field": "factory_id",
             "alias": "factory_id"
           }
         ]
       },
       "attributes": []
     },
     {
       "label": "Distance",
       "fromVertex": "Location",
       "toVertex": "Location",
       "tableSource": {
         "catalog": "iceberg_test",
         "schema": "supply",
         "table": "distance"
       },
       "id": {
         "fields": [
           {
             "type": "Long",
             "field": "id",
             "alias": "id"
           }
         ]
       },
       "fromId": {
         "fields": [
           {
             "type": "Long",
             "field": "from_loc_id",
             "alias": "from_loc_id"
           }
         ]
       },
       "toId": {
         "fields": [
           {
             "type": "Long",
             "field": "to_loc_id",
             "alias": "to_loc_id"
           }
         ]
       },
       "attributes": [
         {
           "type": "Double",
           "field": "distance",
           "alias": "distance"
         }
       ]
     }
   ]
 }
}
Figure: PuppyGraph Schema View

Feel free to check out the graph data in the dashboard.

Figure: PuppyGraph UI Dashboard feature

Query the Graph

  • Select Query to open the query panel. The Gremlin Query tab allows you to interactively compose queries using Gremlin.

  • After each query, select Clear to clear the graph panel before executing the next query. This makes sure that the visualization of each query result remains clear and updated.
Figure: PuppyGraph UI Query View

Now let’s run some example queries:

Execute the following query to find the five best-selling products:

g.V().hasLabel('ProductOrder').as('order')
  .group().by('productid').by(__.values('quantity').sum()).as('sales')
  .order(local).by(values, desc)
  .unfold()
  .limit(5)
  .project('productid', 'total_sales')
    .by(keys)
    .by(value)
Figure: PuppyGraph UI - Query Results

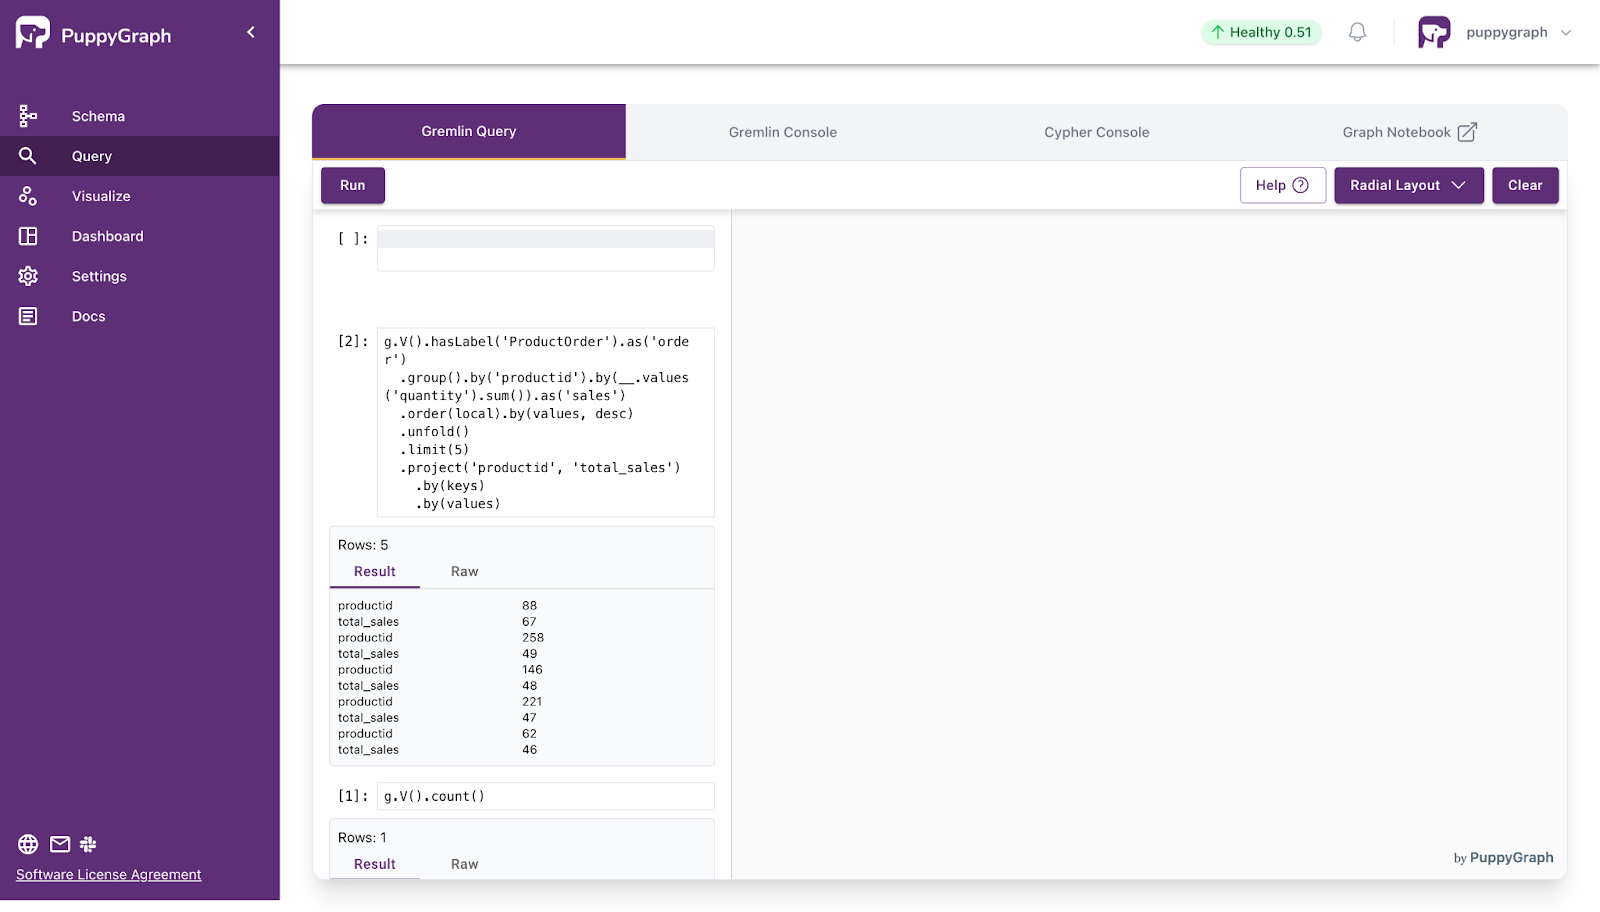
Now let’s dive into the orders for a specific best selling product—the one with product ID 88. We also want to know details like whether the product has sufficient inventory, the materials that product depends on, and inventory details of those materials.

g.V("Product[88]").as('product')
  .union(
    __.out('ProductInventory').out('InventoryLocation').path(),
    __.in('ProOrderToPro').path(),
    __.out('ProductComposition').out('MaterialInventory').out('MatInventoryLocation').path(),
    __.out('ProductComposition').in('MatOrderToMat').out('MatOrderToFac').out('FactoryLocation').path()
  
Figure: PuppyGraph UI - Query & Interactive Graph Visualization

For more example queries, see the GitHub repository of the tutorial. If you prefer to watch a video format for this guide, see the accompanying video below.

Clean up

When finished, stop and remove the services:

sudo docker compose down --volumes --remove-orphans

Conclusion

Supply chain graphs transform complex operational data into clear, actionable insights. While traditional implementations require complex ETL processes and dedicated graph databases, PuppyGraph makes these capabilities accessible by operating directly on your existing relational data. This eliminates the need for data migration while maintaining exceptional performance and scalability.

To try out PuppyGraph for yourself and see how it can help your business, get the forever free PuppyGraph Developer Edition, or book a free demo today with our graph expert team.

Sa Wang is a Software Engineer with exceptional math abilities and strong coding skills. He earned his Bachelor's degree in Computer Science from Fudan University and has been studying Mathematical Logic in the Philosophy Department at Fudan University, expecting to receive his Master's degree in Philosophy in June this year. He and his team won a gold medal in the Jilin regional competition of the China Collegiate Programming Contest and received a first-class award in the Shanghai regional competition of the National Student Math Competition.

Join our newsletter

See PuppyGraph
In Action

See PuppyGraph
In Action

Graph Your Data In 10 Minutes.

Get started with PuppyGraph!

PuppyGraph empowers you to seamlessly query one or multiple data stores as a unified graph model.

Dev Edition

Free Download

Enterprise Edition

Developer

$0
/month
  • Forever free
  • Single node
  • Designed for proving your ideas
  • Available via Docker install

Enterprise

$
Based on the Memory and CPU of the server that runs PuppyGraph.
  • 30 day free trial with full features
  • Everything in Developer + Enterprise features
  • Designed for production
  • Available via AWS AMI & Docker install
* No payment required

Developer Edition

  • Forever free
  • Single noded
  • Designed for proving your ideas
  • Available via Docker install

Enterprise Edition

  • 30-day free trial with full features
  • Everything in developer edition & enterprise features
  • Designed for production
  • Available via AWS AMI & Docker install
* No payment required