

What is a Vulnerability Graph?
How Vulnerability Graphs Can Help Model Modern Cyber Risks
In cybersecurity, our established process in modern security programs revolves around vulnerability scanners. We rely on them to meticulously scan our environments and produce lists of CVEs. This gives us a comprehensive inventory of potential weaknesses.
However, a 9.8 CVSS score signifies extreme risk in a vacuum; it lacks the context of the asset it affects. This single score cannot tell you if the flaw exists on an isolated development server or on a public-facing gateway that processes customer payments.
A vulnerability graph solves such problems by synthesizing raw vulnerability data with an architectural map of your environment, moving beyond simple lists to provide a rich, contextual model of risk. In this post, we’ll explore what vulnerability graphs are and how PuppyGraph helps build them directly on top of your existing data to support practical security operations.
What is a Vulnerability Graph?
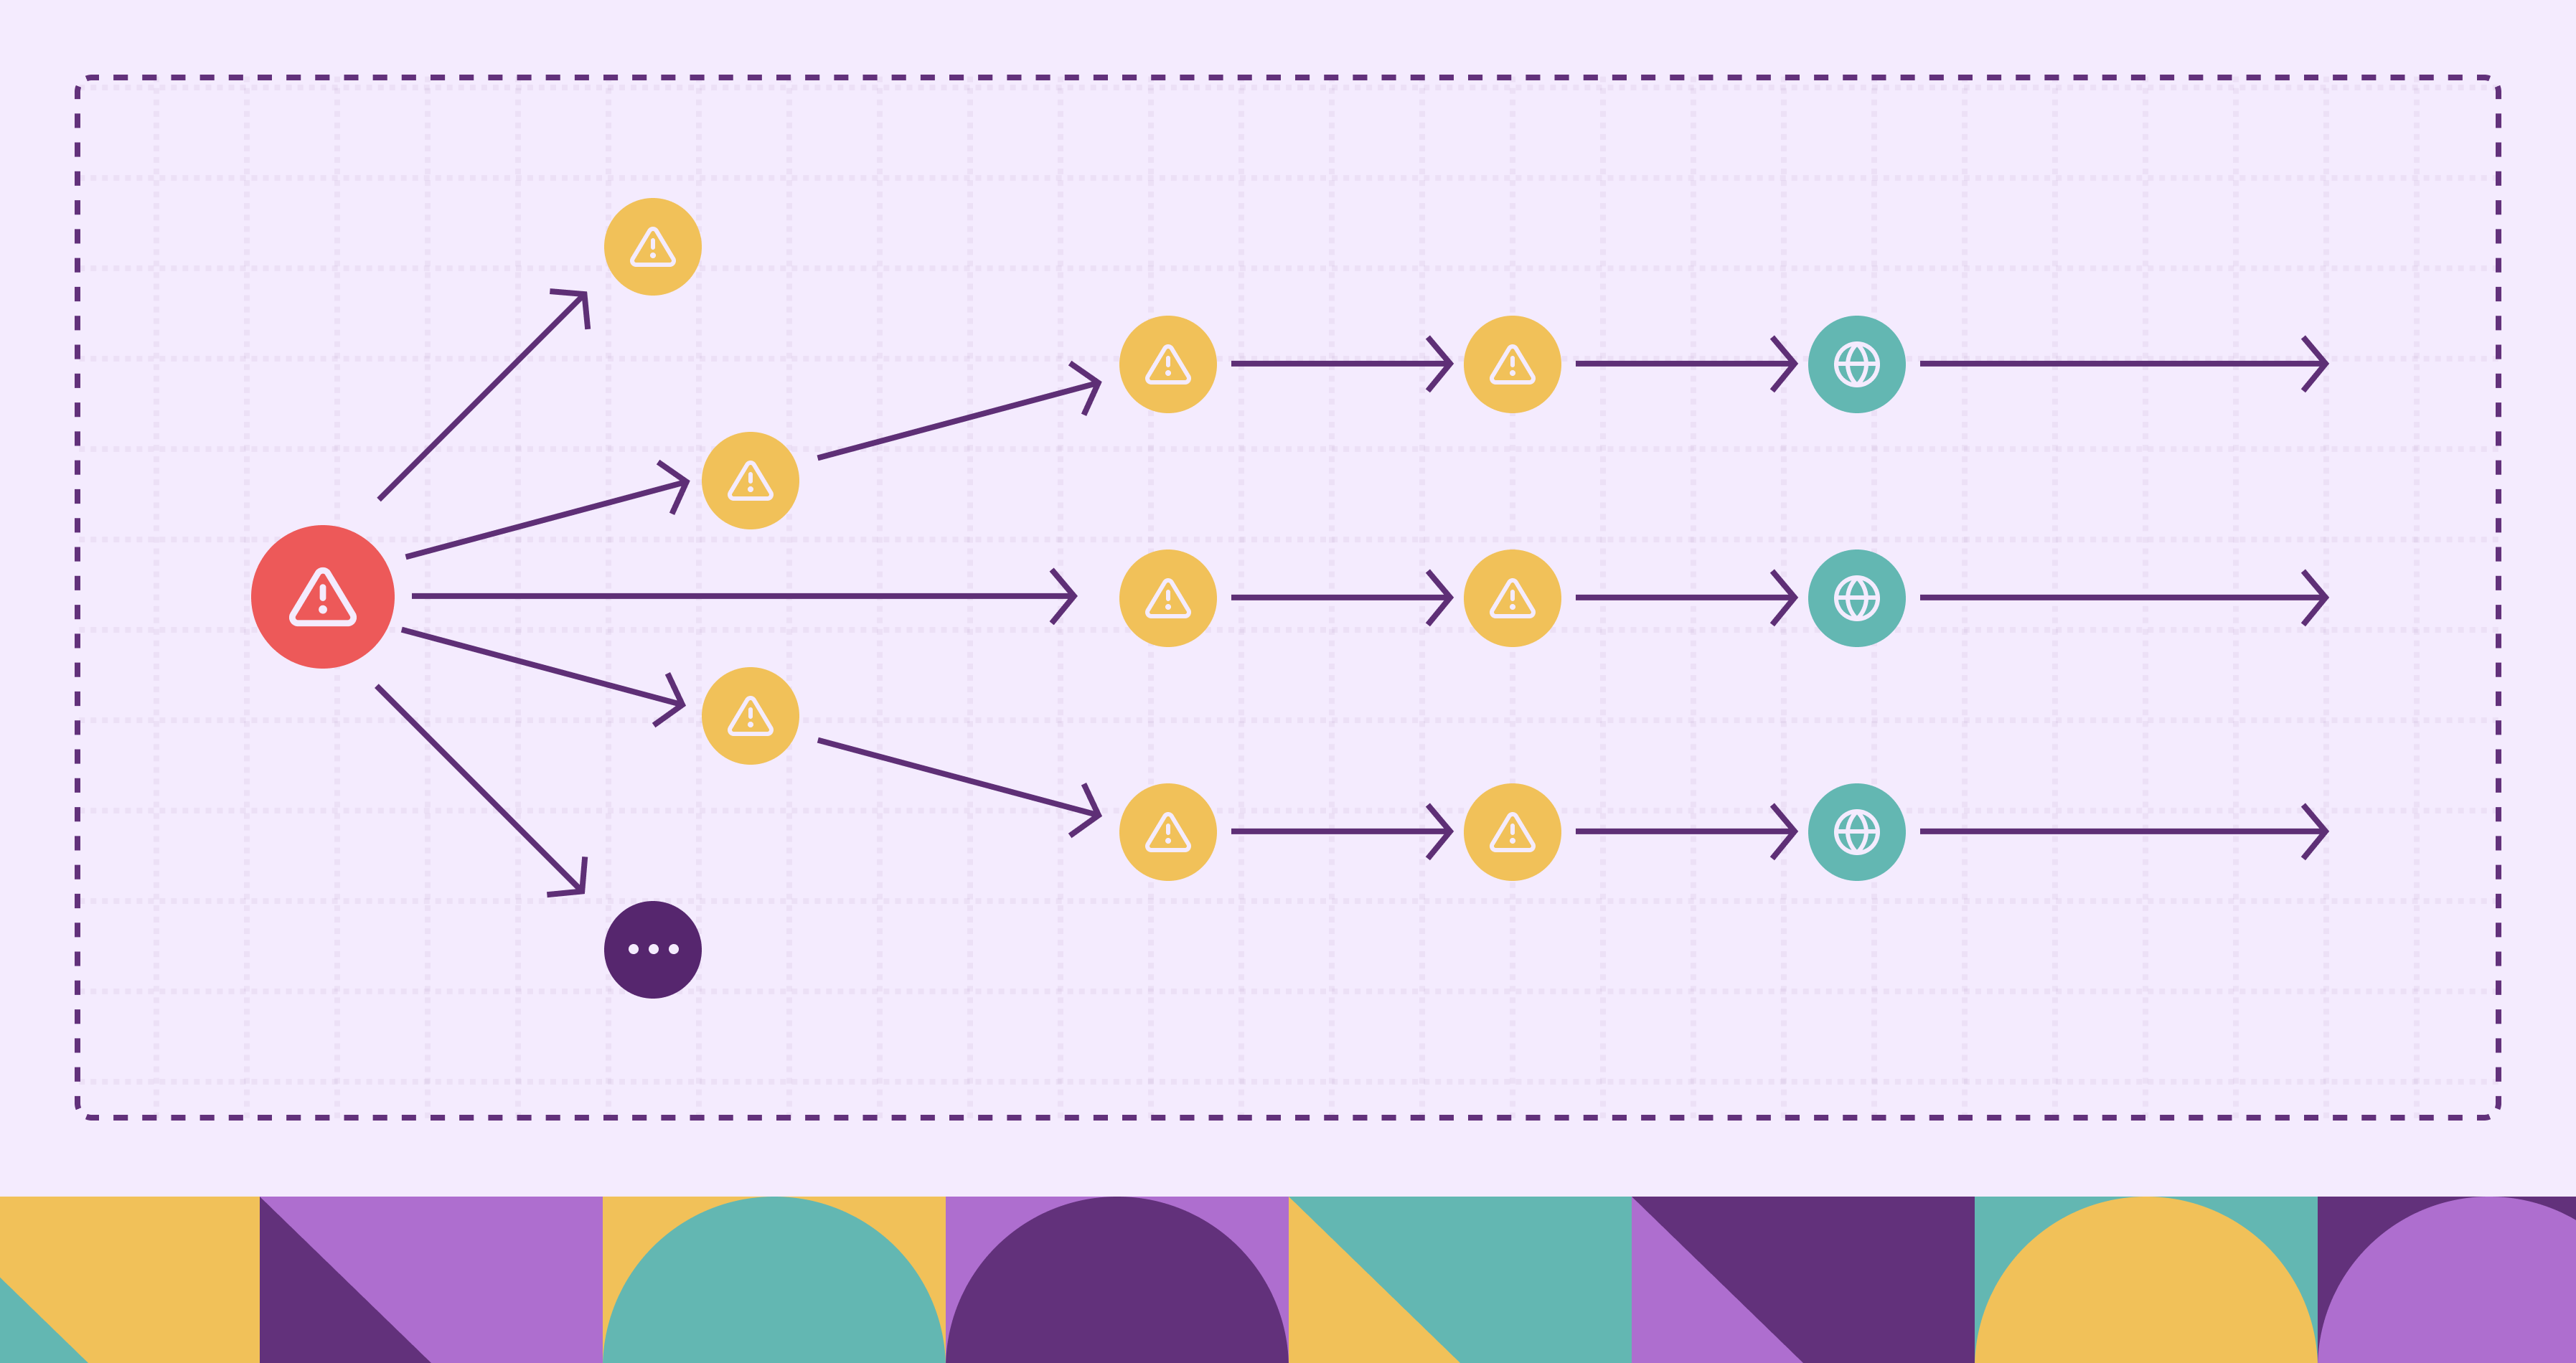
Instead of analyzing disconnected CVE lists, a vulnerability graph models your IT environment as it actually operates — as a network of interconnected assets, users, and vulnerabilities. It captures how risk flows through systems, making it possible to understand not just what is vulnerable, but how attackers could reach and exploit those weaknesses.
A vulnerability graph transforms static scan data into a dynamic, queryable model of your attack surface. By mapping systems, identities, access relationships, and known exploits, it enables you to ask meaningful security questions:
- What is the shortest path from the internet to a critical database?
- Which systems, if compromised, expose the most downstream assets?
- What lateral movement paths exist from a low-privilege user?
To support these queries, a vulnerability graph is built on three core components: nodes, edges, and properties.
Nodes: The Assets and Entities
Nodes are the primary objects within your environment. Each node represents a distinct entity that can have security relevance. This is not limited to just physical hardware; a robust vulnerability graph models a wide array of logical, physical, and even abstract assets. The goal is to represent every element that could be a part of an attack path.
Let’s look at some examples of nodes:
- Hardware assets: Servers, workstations, routers, switches
- Virtual assets: Virtual machines, containers, Kubernetes pods, cloud instances like EC2, Compute Engine
- Software and code: Applications, code repositories, microservices, and individual software libraries
- Network entities: IP addresses, subnets, VPCs, security groups
- Identity and access: Users, roles, permissions, service accounts
- Data: Databases, storage buckets like S3, file shares
Edges: The All-Important Relationships
Edges, or relationships, connect the nodes. Each edge defines how two nodes relate to each other, creating the explicit context that flat lists miss. By mapping these connections, the graph builds a traversable map of your infrastructure, software dependencies, and access pathways.
Edges describe a specific type of interaction, for example:
- Network paths: A host can reach another over TCP
- Access relationships: A user has read or write access to a system
- Trust links: A service can assume another role
- Containment: A subnet contains certain IPs
- Vulnerability exposure: A host has a known CVE
Properties: Rich Context for Better Analysis
Properties provide detailed, rich context. Every node and edge in the graph can be enriched with key-value pairs of data ingested from your various security and IT tools. This is how raw data from scanners and asset inventories gets integrated directly into the model.
For example:
- A server node might include:
{ ipAddress: "10.1.2.3", os: "Ubuntu 22.04", hostname: "prod-db-01", isPublicFacing: false } A vulnerability node could have:
{ cveId: "CVE-2024-XXXX", cvssScore: 9.8, isExploited: true }An access edge might include:
{ permissionLevel: "read-only" }By combining nodes, edges, and properties, you create a high-fidelity model of your environment. An attacker doesn't see isolated assets with CVSS scores; they see a graph of connected opportunities. With a vulnerability graph, your organization can observe through that same lens.
The Limits of Traditional Vulnerability Management
Traditional vulnerability management follows a routine cycle: scan assets, generate findings, and assign remediation tickets.
The volume of vulnerability disclosures makes this even harder. With tens of thousands of new CVEs published each year, security and development teams face a backlog they can’t realistically work through. Prioritization often defaults to the Common Vulnerability Scoring System (CVSS), a static measure of theoretical severity. But CVSS scores don’t reflect your environment. They don’t account for whether an asset is public-facing, whether it handles sensitive data, or whether mitigating controls are already in place.
This lack of context leads to misallocated effort and blind spots. For example, many vulnerabilities with high CVSS scores are never exploited in the wild — something reflected in systems like EPSS (Exploit Prediction Scoring System). Yet teams may spend hours patching a critical CVE on a development VM, while a medium-severity flaw on a production payment system goes unnoticed.
To make matters worse, the information needed to judge true risk is scattered. The vulnerability scanner knows the CVE, but only the Configuration Management Database (CMDB) tracks asset criticality. Firewall rules live in the cloud console. Access control data sits in IAM policies. The Software Bill of Materials (SBOM) reveals which libraries are in use. Without a unified view, assessing risk means manually stitching together disconnected data sources, which is a slow and error-prone process that rarely keeps up with the pace of change.
Practical Use Cases of Vulnerability Graphs
Once you shift from flat vulnerability lists to a graph-based model, a new set of capabilities opens up. A vulnerability graph isn’t just a different way to store scan results — it becomes a powerful tool for exploring how risk flows through your environment. By mapping relationships among assets, users, access paths, and known vulnerabilities, the graph helps security teams prioritize more effectively, respond faster to incidents, and simulate threats before they materialize.
Understanding Attack Paths Before They’re Exploited
One of the most direct applications is attack path analysis. Security teams can use the graph to simulate how an attacker might navigate the environment — starting from a low-privilege account or a public-facing server and moving laterally toward critical systems. Instead of asking “what vulnerabilities exist,” teams can ask more practical questions like: What’s the shortest path to our production database? How many systems lie along exposed routes? This allows teams to anticipate real-world attack patterns rather than reacting to them.
Prioritizing Fixes Based on Exposure, Not Just Scores
Vulnerability graphs also improve prioritization. Traditional vulnerability management often relies on CVSS scores alone, but that approach overlooks critical context. A high-severity CVE buried in an isolated subnet may be far less urgent than a medium-severity one sitting on an internet-facing node with access to crown-jewel assets. By modeling reachability, access, and exposure, graphs help teams focus on the vulnerabilities that actually introduce exploitable paths, not just those that appear risky in theory.
Speeding Up Incident Response and Investigation
During incidents, vulnerability graphs can significantly reduce response time. Instead of manually collecting context from various tools and spreadsheets, responders can explore a prebuilt map of how assets, identities, and vulnerabilities relate. This helps them quickly assess the blast radius of a compromise, identify lateral movement risks, and contain threats before they spread. It also speeds up post-incident analysis by showing which paths were used and where controls failed.
Running “What-If” Simulations Before Making Changes
Beyond detection and response, vulnerability graphs also support forward-looking security practices. For example, before approving a new firewall rule or deploying a new service, teams can simulate the proposed change by temporarily adding nodes and edges to the graph. They can then rerun attack path queries to see whether the change introduces a new route to critical data. This kind of “what-if” modeling embeds security into the design phase, reducing rework and helping developers and architects make more informed decisions.
Tracking Security Posture Over Time
Finally, graph-based analysis makes it easier to measure security posture over time. By running scheduled queries across the graph, teams can track meaningful metrics like the number of internet-exposed critical vulnerabilities, average attack path length, or percentage of production systems with unresolved high-risk CVEs. These indicators support clearer reporting, goal setting, and executive communication, helping to translate technical risk into strategic insight.
How to Build and Visualize a Vulnerability Graph
A vulnerability graph is not a product you install. It is a data model built from the systems, configurations, and security data already present in your environment. The value of this graph comes not only from how well it represents your infrastructure, but also from how clearly it reveals the relationships that attackers can exploit. Building one begins with aggregating and connecting data from across your environment. Once constructed, the graph can be explored and queried to support triage, investigation, and risk analysis.
Building the Graph: From Disparate Data to Unified Model
A meaningful vulnerability graph combines data from four major areas of an environment: assets, infrastructure, application code, and identity. Each contributes a different layer of context that turns raw vulnerability data into a model of real-world risk.
Asset and vulnerability data
Scanners such as Tenable or Qualys provide the initial CVE findings tied to individual machines. This forms the basis of asset nodes linked to vulnerability nodes. Additional detail comes from sources like a CMDB, which may provide ownership, business unit, and criticality. These become properties of nodes that help with prioritization.
Infrastructure context
Infrastructure data helps determine exposure and reachability. In cloud environments, APIs from AWS, Azure, or GCP describe compute instances, network configurations, and security rules. On-premises environments might rely on firewall policies or network flow logs. These relationships show which assets can communicate, which is essential for identifying lateral movement or ingress routes.
Application layer insight
Application-level insight comes from tools like SBOM generators or application security scanners. A Software Bill of Materials shows what open-source components are present in an application or container. SAST and DAST tools identify vulnerabilities in proprietary code. Together, they link software components and services to relevant CVEs in the graph.
Identity and access relationships
Identity and access data adds another critical layer. It includes users, roles, permissions, and trust relationships that often define the true attack paths. Mapping access flows can reveal privilege escalation routes or hidden links between services and data.
Resolving duplicate representations
One of the hardest technical steps is resolving entities that appear differently across systems. The same server might be known by its hostname in one system, its IP address in another, and its cloud instance ID elsewhere. Without resolving these references into a single node, the graph becomes fragmented and incomplete. A consistent strategy that uses identifiers such as MAC address, hostname, or cloud tags is essential to unify views across tools.
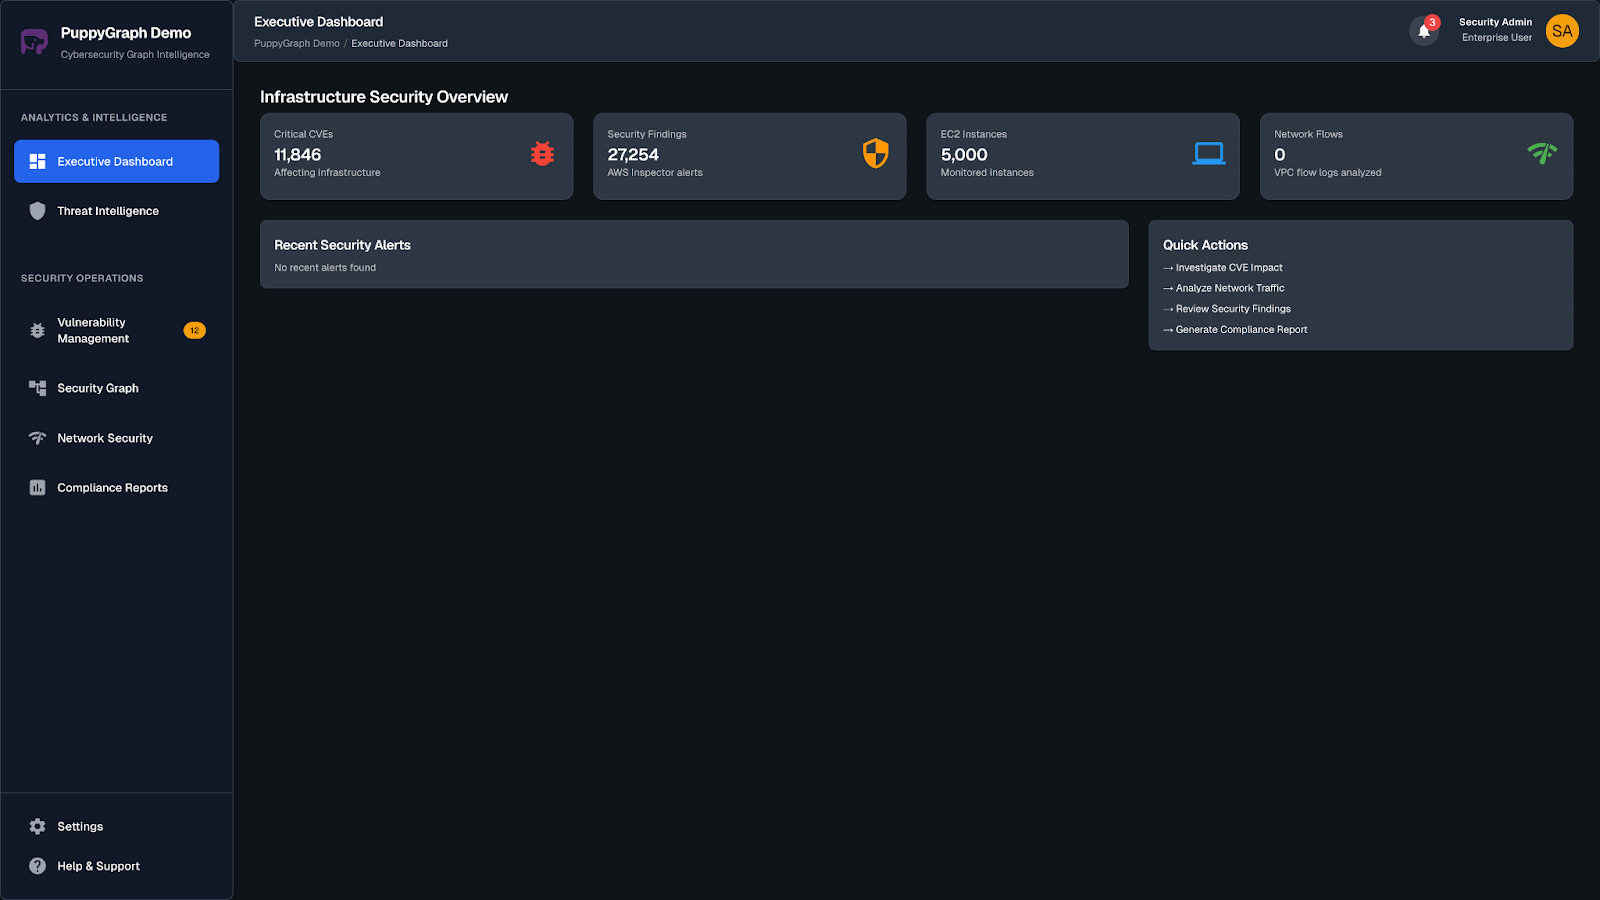
Using the Graph: Visualization, Queries, and Risk Insight
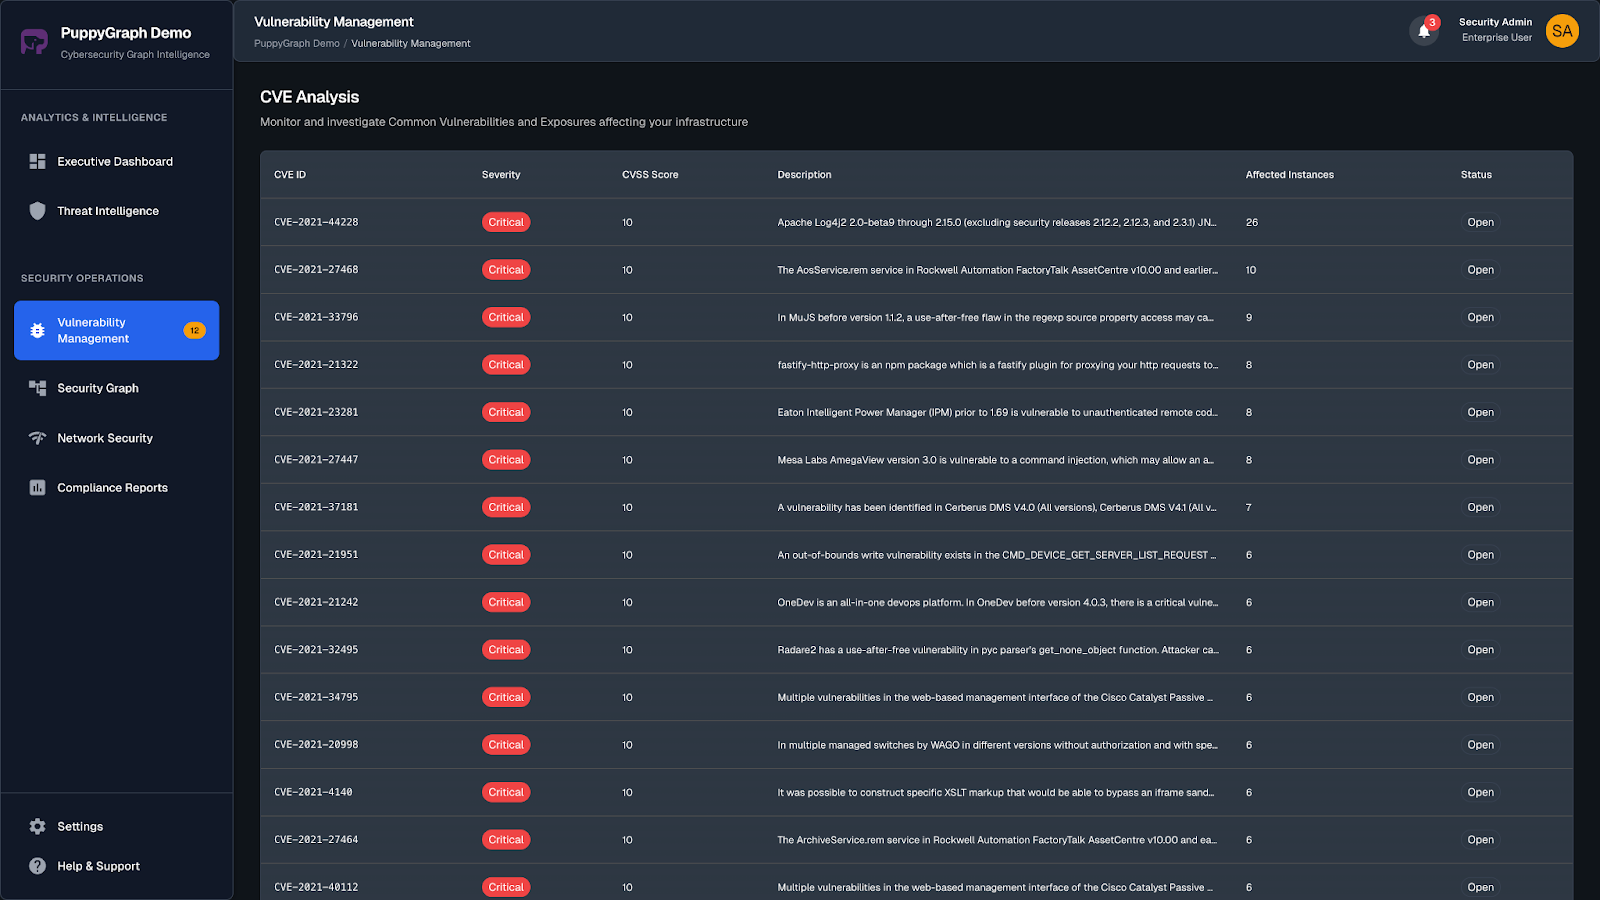
Once the graph is built, the next step is to explore and analyze it. One common task is filtering vulnerabilities using environmental context. For example, a team might look for high-severity CVEs that exist only on production-facing servers or focus on exposures tied to specific business units. This transforms a broad scanner feed into a focused remediation plan.
Graphs also support more tailored risk modeling. By combining asset metadata, such as criticality or owner, with structural signals like shortest path from an internet entry point or the number of downstream dependencies, teams can create custom risk scores that reflect actual exposure, not just abstract severity.
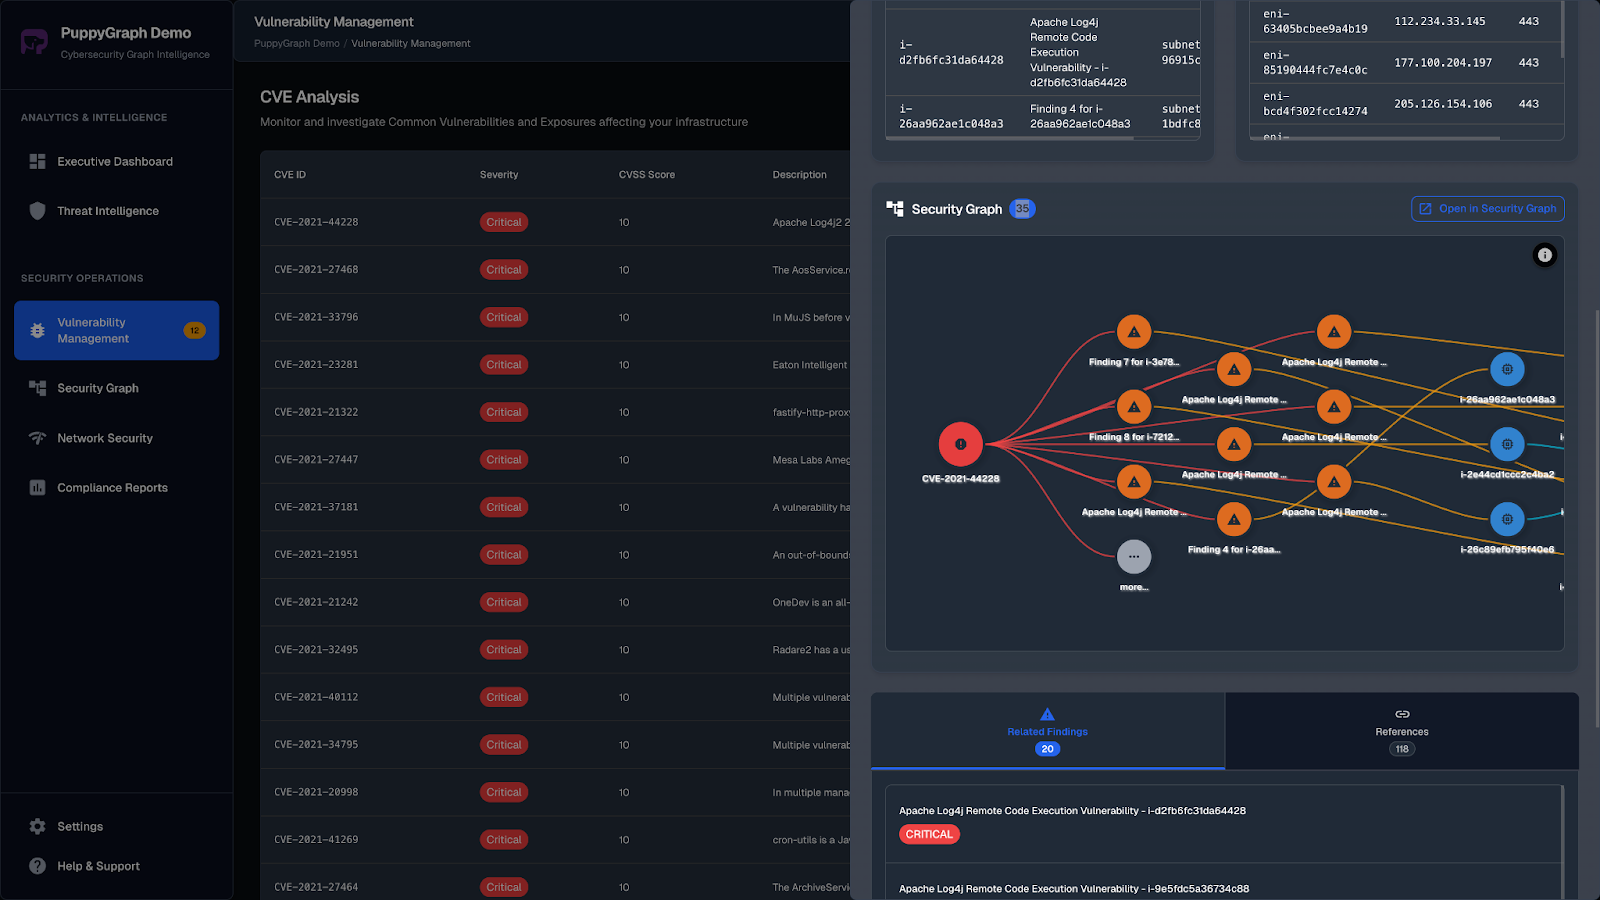
Visualizing the graph brings hidden connections into view. An attacker might exploit a chain of minor weaknesses: a vulnerable browser on a developer laptop, cached SSH keys used to reach a staging server, and a code injection flaw that poisons a build artifact. When modeled as a graph, the entire chain becomes visible and understandable, making it easier to identify which link can be broken to neutralize the risk.
Whether used for triage, simulation, or architecture review, the vulnerability graph provides a structured, flexible view of how risk spreads across an environment and where action will have the greatest impact.
How PuppyGraph Enables Vulnerability Graphs
PuppyGraph is a graph query engine designed to work directly on top of relational data sources, including databases, data lakes, and cloud catalogs. It allows security teams to model, query, and visualize graph structures without moving or duplicating data. For vulnerability graphs, this means you can define how systems, users, and vulnerabilities are connected using your existing data — and start querying attack paths or risk exposure in minutes.

Direct Graph Modeling Without ETL
PuppyGraph connects directly to relational databases, data lakes, and cloud catalogs, allowing you to define a graph over existing tables without building data pipelines. The graph schema specifies how tables correspond to assets, vulnerabilities, identities, and relationships. You can define the schema using a JSON file or build it visually in the schema editor. Once the schema is in place, the graph becomes immediately queryable using Cypher or Gremlin.
This zero-ETL approach avoids data duplication and keeps your model aligned with live data. As your environment changes — for example, new scan results or updated configurations — those changes are reflected in graph queries without manual refreshes.
Multiple Graph Views from the Same Data
Security teams often need different graph models for different purposes. PuppyGraph allows you to define multiple schemas over the same underlying data. One schema might highlight attack paths between assets, another might trace lateral movement risks based on identity and permissions, and a third might model software dependencies.
Because each schema is defined virtually, there’s no need to rebuild pipelines or reprocess data. This flexibility supports fast iteration during exploratory modeling and allows multiple teams to work from a shared data foundation.
Query and Visualize in Real Time
With PuppyGraph, graph queries run directly on source data. This enables live exploration of the environment without staging or duplication. You can use Cypher or Gremlin to ask complex security questions, such as shortest attack paths to critical systems or nodes with excessive trust relationships.
This also means your graph visualizations are always up to date. You can overlay asset metadata, highlight key paths, and track exposure across systems without needing to refresh an external graph database.
Built for Security, Scale, and Control
PuppyGraph maintains all security data within your existing infrastructure. It reuses your current access controls and integrates with governance tools such as Unity Catalog, Polaris, and AWS Glue Data Catalog. This avoids new governance overhead and simplifies compliance.
The underlying architecture separates compute from storage, enabling scalable performance for large and complex graphs. Whether you're modeling a few hundred nodes or thousands of systems and relationships, PuppyGraph maintains responsive query performance without additional engineering effort.
PuppyGraph is already used by half of the top 20 cybersecurity companies, as well as engineering-driven enterprises like AMD and Coinbase. Whether it’s multi-hop security reasoning, asset intelligence, or deep relationship queries across massive datasets, these teams trust PuppyGraph to replace slow ETL pipelines and complex graph stacks with a simpler, faster architecture.


Conclusion
Moving beyond the limitations of isolated CVE lists, vulnerability graphs empower security teams with a profound, contextual understanding of risk. By modeling your environment as an interconnected network of assets, users, and vulnerabilities, these graphs transform static data into dynamic insights. This enables precise attack path analysis, intelligent prioritization, accelerated incident response, and proactive "what-if" simulations, fundamentally shifting how organizations manage cyber exposure.
With tools like PuppyGraph, it’s now possible to build these models directly on top of your existing data — without duplicating, transforming, or moving it. That means you can bring graph-based security analysis into production environments faster and with less operational burden. If you’re interested in exploring what a vulnerability graph could look like for your environment and seeing how PuppyGraph can help, feel free to try the forever-free PuppyGraph Developer Edition, or book a free demo with our graph expert team.

Sa Wang is a Software Engineer with exceptional mathematical ability and strong coding skills. He holds a Bachelor's degree in Computer Science and a Master's degree in Philosophy from Fudan University, where he specialized in Mathematical Logic.

Get started with PuppyGraph!


Developer Edition
- Forever free
- Single noded
- Designed for proving your ideas
- Available via Docker install
Enterprise Edition
- 30-day free trial with full features
- Everything in developer edition & enterprise features
- Designed for production
- Available via AWS AMI & Docker install