

7 Best Business Analytics Tools in 2026
Business analytics software is consolidating even as the market it serves keeps growing. Progress Software agreed in July 2026 to acquire substantially all of Domo's assets and operating business for $400 million in cash, a deal expected to close before the end of the year that would fold one of the category's cloud-native platforms into a data-infrastructure vendor. Qlik took a minority investment from the Abu Dhabi Investment Authority alongside majority owner Thoma Bravo in a deal signed in November 2024, and Alteryx went private in a $4.4 billion buyout that closed in March 2024. None of that has slowed demand: Fortune Business Insights' 2025 Business Intelligence (BI) Market report values the global market at $34.82 billion in 2025, projected to reach $72.21 billion by 2034 at an annual growth rate of 8.4%.
This guide covers what business analytics tools actually do, why organizations keep investing in them, seven tools worth evaluating in 2026 with an honest read on where each fits, and a framework for choosing among them.
What are business analytics tools?
A business analytics tool connects to an organization's data, models it into a form business users can query, and presents the results as dashboards, reports, or answers to ad hoc questions. It is the layer between where data is stored (a warehouse, a lakehouse, an operational database) and the people who need to act on it, whether that person is an analyst building a report or an executive scanning a dashboard on a phone.
Concretely, the tools in this guide bundle some combination of five capabilities. Connectivity: pre-built connectors to warehouses, databases, and SaaS applications, so a new data source is a configuration step rather than a custom integration. Modeling and a semantic layer: a place to define metrics, joins, and business logic once (a table model, LookML, a QIX associative model) so that "revenue" means the same thing in every report built on top of it. Visualization and dashboarding: drag-and-drop chart and dashboard authoring, with drill-down and filtering built in. Self-service exploration: enough governance to keep numbers trustworthy while letting business users build their own views without filing a ticket with the data team. Natural-language and AI querying: the newest layer, where a user types or speaks a question and the tool translates it into a query against the underlying model, an area every major vendor has shipped a version of in the past two years.
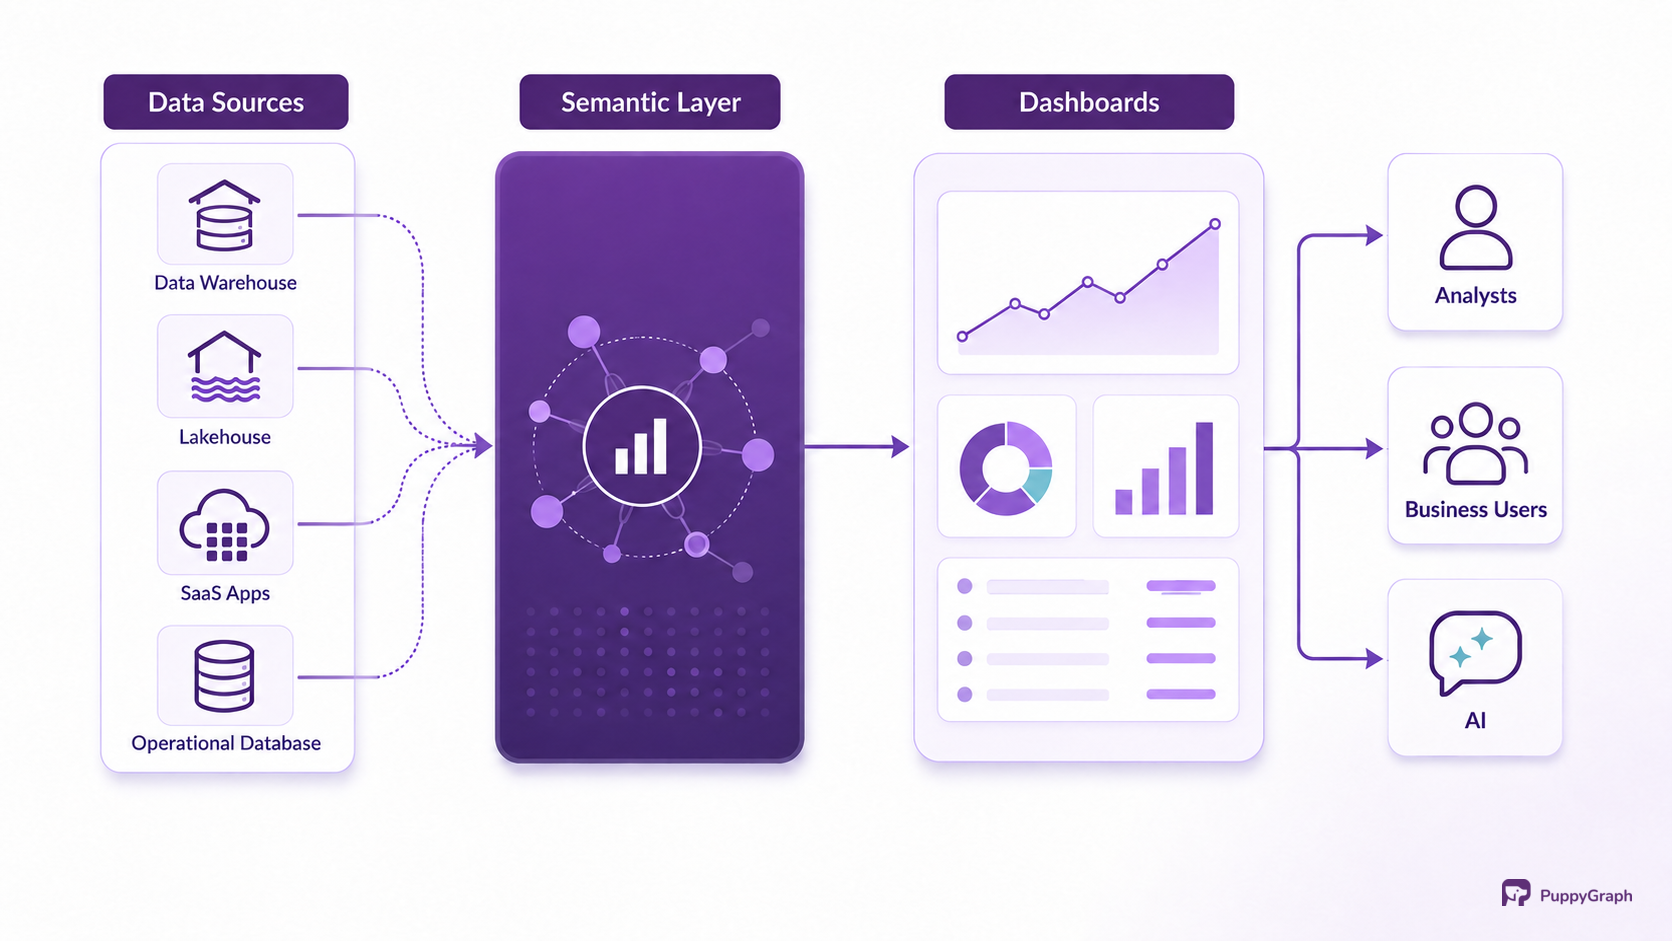
No tool weights those five capabilities equally, and the weighting is the product. A governed semantic-layer tool invests heavily in modeling and treats visualization as a thin layer on top; a fast associative engine invests in letting users click through relationships with no query written at all. Reading a tool through this lens predicts its fit better than a feature checklist does. A business analytics tool is not a replacement for the warehouse or the pipelines that feed it; it turns data already sitting in those systems into something a human can act on without writing SQL.
Why businesses need analytics tools
Before self-service tools were common, getting a number in front of a decision-maker meant an analyst pulling a query, exporting it to a spreadsheet, and emailing it around, a cycle that could take days and was stale by the time anyone acted on it. Business analytics tools exist because that cycle does not scale with the volume of questions an organization asks or the speed at which it needs answers.
Decisions degrade as data ages. A dashboard refreshed overnight is fine for a quarterly business review and useless for an operations team watching inventory or fraud signals in real time. The tools below differ widely in how fresh the numbers they show can be, from cached extracts refreshed on a schedule to live queries against the warehouse, and that freshness gap is often the deciding factor between two otherwise similar platforms.
Self-service scales the data team. Every question a business user can answer by exploring a governed model themselves is a question that never becomes a ticket in an analytics team's backlog. This is the core economic argument for these tools: they do not just make dashboards prettier, they change who is capable of getting an answer.
Natural-language querying lowers the skill floor further. Microsoft's Copilot in Power BI, Google's Conversational Analytics in Looker, Qlik Answers, and ThoughtSpot's Spotter all let a user ask a question in plain language and get a query run against a governed model in response. The underlying model still has to be trustworthy for the answer to be trustworthy: a natural-language interface over an ungoverned model produces confident-sounding wrong answers faster than a human could write them.
These pressures explain why business analytics spending keeps growing even as the vendor landscape consolidates: getting a trustworthy answer quickly has only gotten more acute as data volume and the pace of decisions have both increased.
Top 7 best business analytics tools
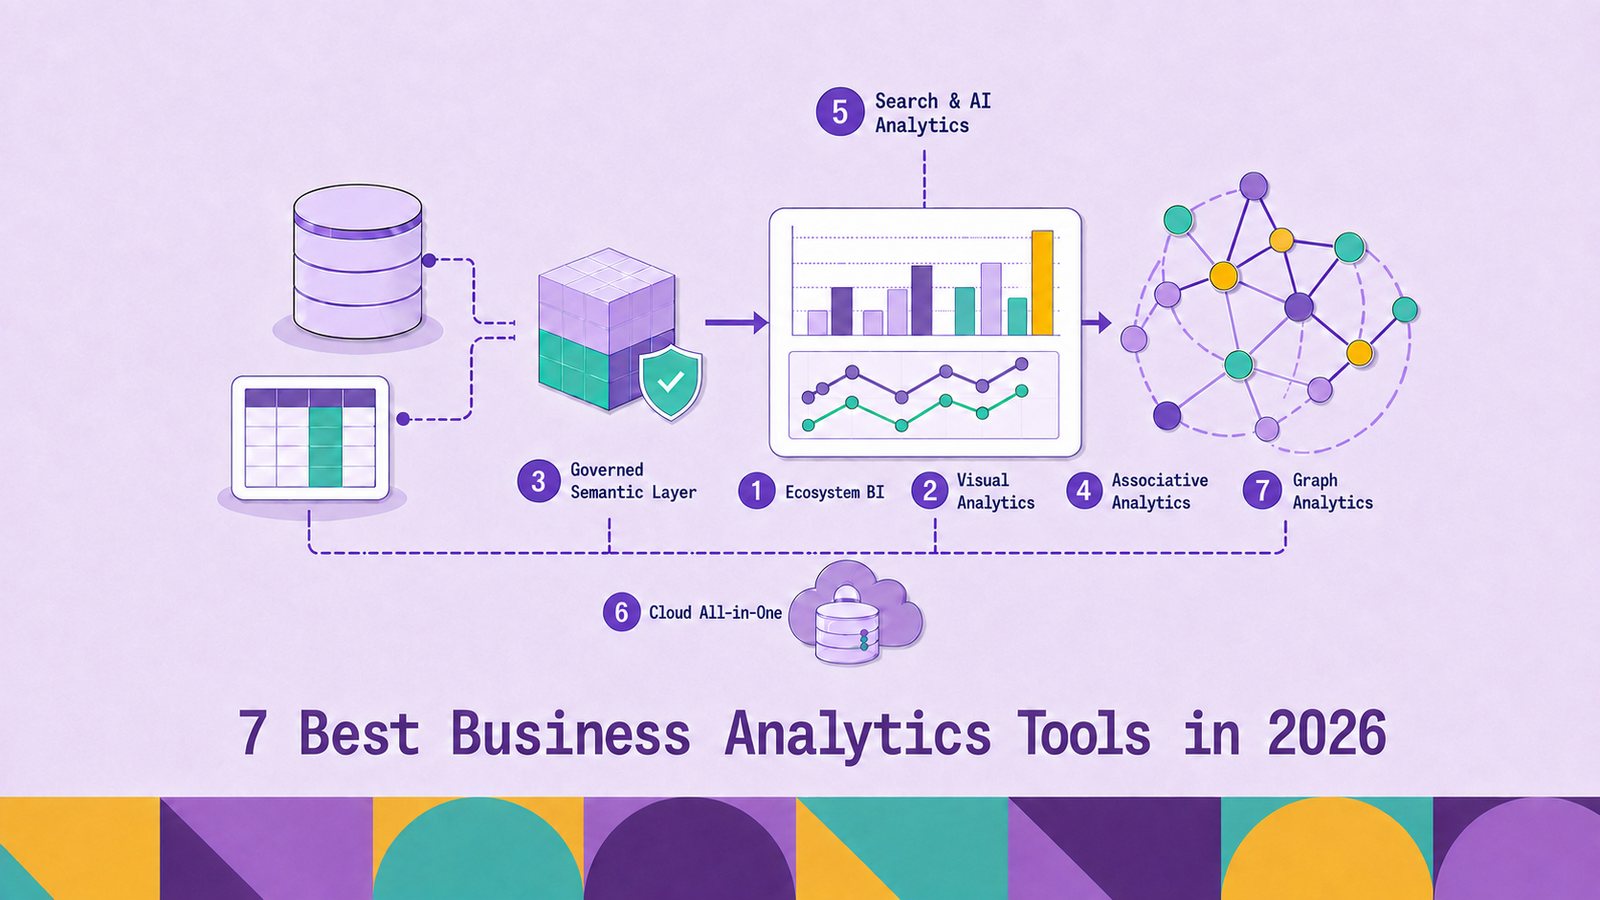
The seven tools below span the market's major camps: an ecosystem-native platform, the standalone visualization leader, a governed semantic layer built for the warehouse era, an associative in-memory engine, a search-and-AI-driven interface, a cloud-native all-in-one platform, and a graph analytics engine for the relationship questions the other six were not built to answer.
Read down the table and the market sorts into camps rather than a single ranking. The useful decision is which camp fits your stack and constraints; tool-versus-tool comparison inside a camp comes after that.
1. Microsoft Power BI
Microsoft Power BI is the ecosystem-native entry, built into the Microsoft Fabric and Power Platform family. Reports run on DAX (Data Analysis Expressions) evaluated against a tabular in-memory model, with three connectivity modes: Import, which caches data in memory; DirectQuery, which pushes queries live to the source; and composite models that mix both table by table. Power BI Desktop, the authoring tool, is free, and the product deploys primarily as SaaS through the Power BI service, with an on-premises path via Power BI Report Server. Sharing a report inside an organization requires paid licensing, either per-user Pro or Premium tiers or capacity-based Fabric SKUs; Copilot in Power BI reached general availability in June 2024 on sufficient Premium or Fabric capacity, generating report pages and answering natural-language questions against the semantic model. Microsoft has been named a Leader in Gartner's 2024 Magic Quadrant for Analytics and BI Platforms, extending a streak of multiple consecutive years. Power BI fits organizations already standardized on Microsoft 365 or Azure, where the incremental cost of adding BI is low; teams outside that ecosystem will find less of that advantage.
2. Tableau
Tableau, owned by Salesforce since the acquisition closed in August 2019, remains the standalone visualization leader. Its VizQL engine translates drag-and-drop visual actions directly into database queries and renders the result, the mechanism behind Tableau's reputation for fast, exploratory chart-building. It deploys as Tableau Cloud, a fully hosted SaaS product, or Tableau Server, which a customer manages on its own infrastructure, making it one of the few tools here with a genuine self-hosted path at enterprise scale. Licensing runs on three per-user role tiers, Creator, Explorer, and Viewer, applied consistently across both deployment options; Tableau Public is a separate, permanently free product restricted to public, non-private data. Salesforce first previewed agentic AI features under the Tableau Einstein name at Dreamforce in September 2024, then rebranded and relaunched them as Tableau Next at Tableau Conference 2025, with individual agents rolling out through the rest of the year. Tableau fits teams that prioritize visual exploration quality above all else, and its Salesforce ownership makes it a natural default in organizations already invested in that ecosystem.
3. Google Looker
Google Looker, part of Google Cloud since the acquisition closed in February 2020, takes a different architectural bet than the other visualization-first tools: LookML, a modeling language, defines metrics and joins once in a governed semantic layer, and Looker compiles that model into SQL that runs live against the underlying warehouse (BigQuery, Snowflake, and others) rather than caching data into its own engine. That design means every dashboard, embedded report, and API consumer built on a given LookML model shares one definition of a metric. Looker's Google Cloud core product deploys as SaaS only, hosted and managed by Google, though the original Looker product line also supports customer-hosted deployment with some feature limitations; pricing runs through an annual platform license plus per-user role tiers. It is worth distinguishing Looker from Looker Studio, Google's separate, free, lower-end reporting product that does not share Looker's semantic-modeling layer. Google added Conversational Analytics, a Gemini-powered natural-language interface grounded in the LookML model, reaching general availability in November 2025. Looker fits teams already centered on a cloud warehouse that want one governed metric layer reused across BI, embedded analytics, and AI tools alike.
4. Qlik Sense
Qlik Sense is built around the QIX associative engine, an in-memory, columnar model that indexes every relationship in a dataset at load time. Clicking any value highlights both the data associated with it and the data that is not, across the entire model at once, rather than issuing a new query per click. Qlik is privately held, majority-owned by Thoma Bravo since taking the company private in 2016, with the Abu Dhabi Investment Authority adding a minority investment alongside Thoma Bravo in November 2024. It deploys as Qlik Cloud, a SaaS product, or as Qlik Sense Enterprise on Windows, a self-managed on-premises deployment, and prices Qlik Cloud on capacity-based tiers metered by data analyzed rather than by seat. Qlik's 2023 acquisition of Talend added data transformation, quality, and governance tooling alongside the data-integration capability the platform already had from its 2019 Attunity acquisition, and Qlik Answers, a retrieval-augmented generation feature for querying unstructured business content with explainable citations, reached general availability in July 2024. Qlik Sense fits teams wanting fast, click-driven exploration across large in-memory models with a genuine choice between cloud and on-premises deployment.
5. ThoughtSpot
ThoughtSpot is privately held and built around a search- and natural-language-driven query interface rather than a drag-and-drop dashboard canvas. Its current iteration, Spotter, launched in November 2024 as what ThoughtSpot calls an agentic AI analyst: it uses a patented search-token architecture and a modeling layer to translate a natural-language question into deterministic SQL against an indexed in-memory engine, rather than relying on an LLM to generate SQL directly against raw tables. It deploys as ThoughtSpot Cloud, hosted on AWS or Google Cloud, or as self-hosted software, and licenses on per-user tiers from Essentials through custom-quoted Enterprise, with a restricted free Developer plan for proof of concept. ThoughtSpot's 2023 acquisition of Mode Analytics extended the platform toward notebook-style embedded analytics alongside its core search interface. It fits organizations whose primary interface is business users asking questions in plain language rather than building dashboards, and companies embedding analytics directly into their own products.
6. Domo
Domo, publicly traded on NASDAQ since its 2018 IPO, is a cloud-native platform that bundles a transformation layer, managed storage, and dashboarding into one product rather than pairing separate tools. Magic ETL, its drag-and-drop transformation layer, requires no SQL and can push transformations down to run directly on Snowflake, Databricks, BigQuery, or Oracle instead of moving data into Domo's own storage first, and Domo Everywhere handles embedding dashboards into other applications. Domo is SaaS only, with no on-premises option, a deliberate contrast to Power BI, Tableau, and Qlik. Pricing runs on a consumption or credit model, metered by data storage volume, workflow runs, and AI feature usage, with unlimited user seats included rather than per-seat licensing. The significant near-term fact for anyone evaluating Domo: Progress Software agreed in July 2026 to acquire substantially all of its assets and operating business for $400 million, a deal expected to close before the end of 2026 but not yet closed as of this writing. Domo fits teams wanting one product spanning ETL through dashboarding, though the pending ownership change makes near-term roadmap questions worth asking before committing.
7. PuppyGraph
The six tools above all model data as tables and present it through dashboards. PuppyGraph starts from a different premise: some of the most valuable business questions, which accounts share a device with one already flagged for fraud, what breaks downstream of a schema change, how an approval chain routes through a management hierarchy, are naturally relationship questions, and answering them in SQL means writing and maintaining a wall of joins that gets slower and harder to read with every additional hop.
PuppyGraph queries a graph schema declared directly over tables already in a SQL database, warehouse, or lakehouse, including direct reads of open table formats like Iceberg and Delta Lake, with no separate graph database and no ETL pipeline duplicating the data into one. Queries run in openCypher or Gremlin, compiled into a plan of node and edge operators that executes in PuppyGraph's own distributed engine rather than being translated into one large generated SQL query, and the engine issues only simple projection and filter SQL back to the source. Because the query is represented as graph operators end to end, the engine optimizes specifically for multi-hop traversals, which is where its traversal performance comes from. It ships with an AI assistant that generates and self-corrects graph queries against that same schema, a natural-language entry point comparable to the AI features shipping across the tools above. PuppyGraph is not a replacement for the dashboards the other six tools provide; it fits alongside them, answering the relationship questions that keep resurfacing as a wall of joins in the same tables those dashboards already read.
How to choose the right business analytics tool
The seven tools above look interchangeable on a feature list and diverge sharply once a team is running them in production.
Data location, deployment, and licensing. A tool that queries the warehouse live, like Looker, stays consistent with whatever else reads it, at the cost of depending on the warehouse's own performance, while a tool that caches data into its own in-memory model, like Power BI's Import mode or Qlik's associative engine, trades freshness for speed. That same location question shapes deployment: SaaS-only tools (Looker's Google Cloud core product, Domo, ThoughtSpot Cloud) are usually fastest to stand up, tools with a genuine self-hosted option (Tableau Server, Qlik Sense Enterprise on Windows, Power BI Report Server, ThoughtSpot Software) matter for regulated estates, and PuppyGraph's default deployment queries data in place rather than moving it anywhere. Licensing tends to follow the same operational shape: per-user tiers (Power BI, Tableau, ThoughtSpot) punish organizations with many occasional viewers, while capacity- or consumption-based pricing (Qlik Cloud, Domo) punishes usage spikes instead, so match the shape to how concentrated or broad your user base actually is.
Semantic layer and governance. Decide whether metrics should be defined once in a shared layer every report reuses, Looker's LookML being the clearest example, or whether each report author builds their own model. The first prevents two dashboards from quietly disagreeing about what "active customer" means; the second moves faster for a small team without the discipline to maintain a shared model yet.
Natural-language and AI query maturity. Every vendor above now ships some form of it, Copilot, Conversational Analytics, Qlik Answers, Spotter, and the useful question is what the feature is grounded in, not whether it exists. A natural-language layer over a governed semantic model produces trustworthy answers; the same layer over an ungoverned pile of tables produces confident-sounding wrong ones faster.
Vendor trajectory. The consolidation is not finished. Domo's pending acquisition by Progress Software, Qlik's new ownership under Thoma Bravo and ADIA, and Alteryx's move to a private-equity owner are reminders that a roadmap evaluated today may answer to a different owner within a year or two.
Whether the question is tabular at all. Most business questions fit rows, columns, and aggregates, exactly what the six dashboard-first tools above are built for. A smaller but recurring class, the kind that traces a relationship across several hops, degrades badly as a chain of SQL joins regardless of which tool runs it, and is worth recognizing on its own terms rather than forcing into a dashboard that was never built to answer it.
The strongest evaluation starts from the recurring question your team cannot answer well today, and works backward to the tool shape that removes the most of that pain.
Conclusion
The business analytics market of 2026 is consolidating through acquisitions even as the underlying spend keeps growing, and its structure is stable underneath that churn: ecosystem-native tools for teams that want BI bundled with a platform they already own, standalone visualization and governed semantic-layer tools for teams that want the model decoupled from any one warehouse, an associative engine for fast click-driven exploration, a search-driven interface for business users who would rather ask than build, a cloud-native platform for teams that want one vendor across the pipeline, and a graph layer for the relationship questions the rest were not built to answer. There is no single best tool, only the best fit for where your data lives, how much governance your organization can sustain, and the shape of the questions your team keeps asking.
Try the forever-free PuppyGraph Developer Edition and book a demo with the team to see how openCypher and Gremlin queries traverse warehouse and lakehouse tables, with no graph-specific ETL, for the relationship questions your dashboards were never built to answer.

Hao Wu is a Software Engineer with a strong foundation in computer science and algorithms. He earned his Bachelor’s degree in Computer Science from Fudan University and a Master’s degree from George Washington University, where he focused on graph databases.


