
What Is a Correlation Engine?
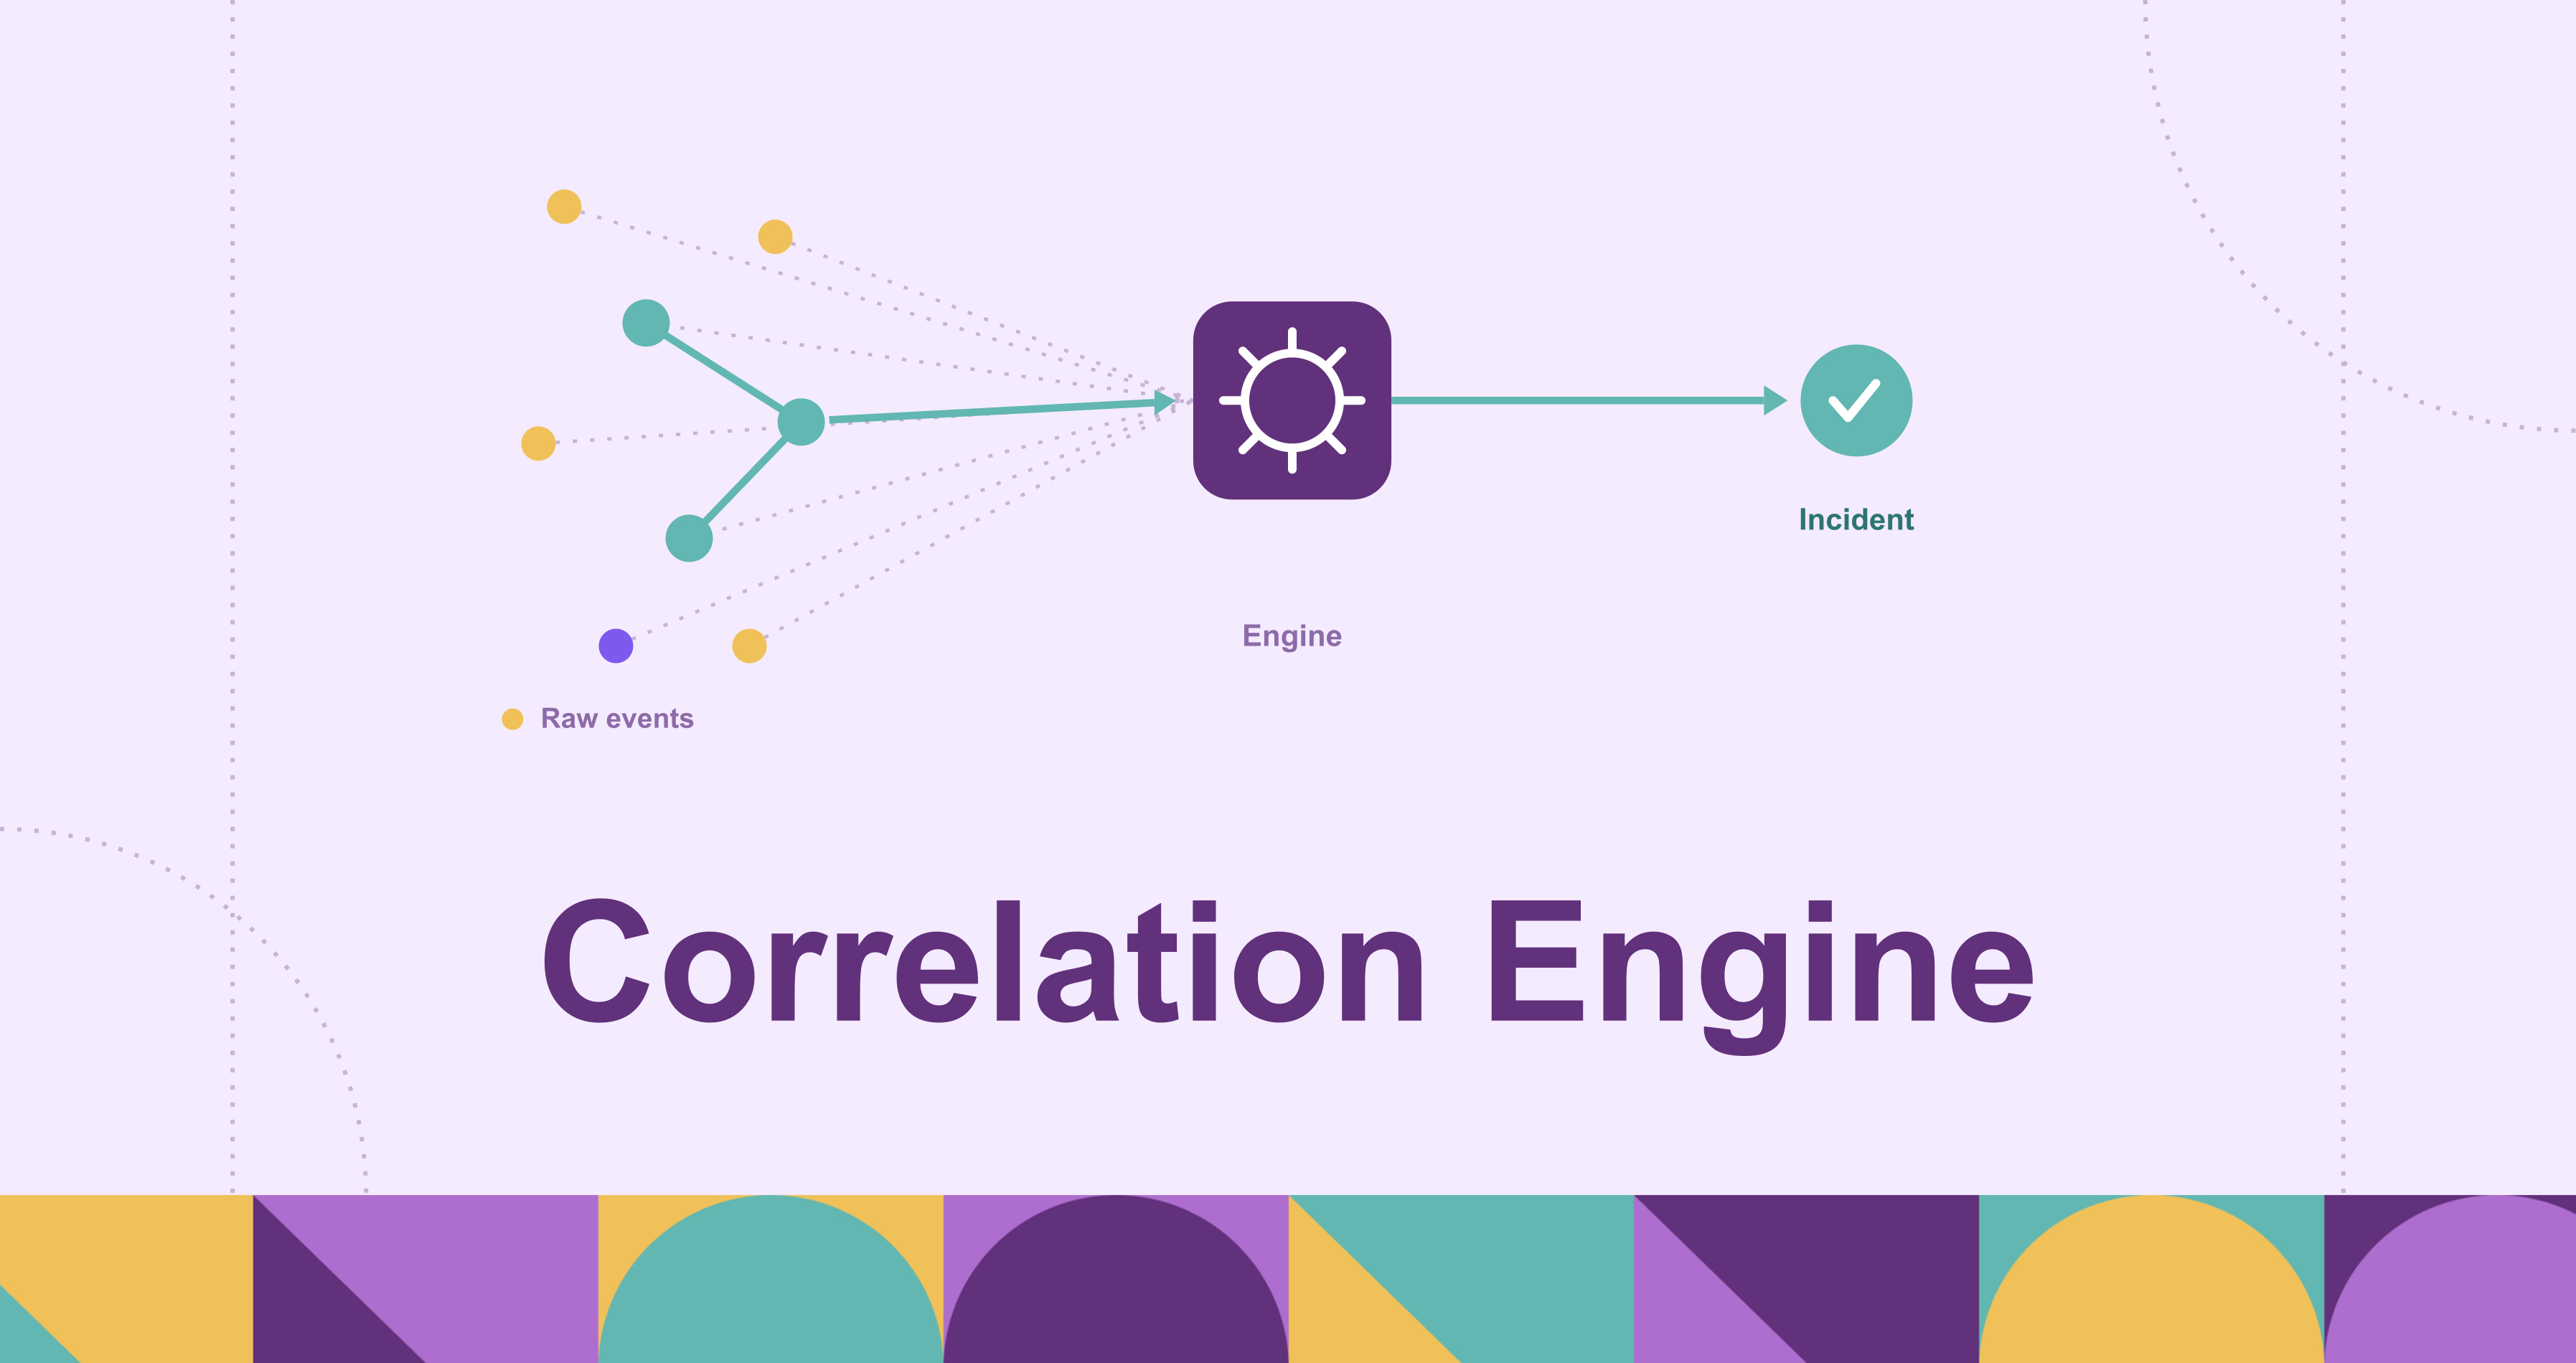
A single log line rarely tells you anything. A failed login, a port scan, a spike in latency, a new process on a host: in isolation each is ambiguous, and a modern environment produces millions of them an hour. The signal that matters almost never lives in one event. It lives in the relationship between several, often spread across different systems and separated in time. A correlation engine is the component that finds those relationships, collapsing a flood of individual events into a much smaller set of findings a human or an automated workflow can actually act on.
This post explains what a correlation engine is and why it has become a core piece of security and observability stacks. It walks through how one works end to end, the kinds of data it consumes, the architecture it is typically built from, and the methods it uses to relate events. It then looks at two things that decide whether a correlation engine is useful in practice rather than just busy: how it cuts alert fatigue, and how it uses context to tell a real finding from a coincidence.
What is a correlation engine?
A correlation engine is a system that ingests streams of events from many sources and applies logic to find meaningful relationships among them, turning a large volume of low-level events into a smaller number of higher-level, actionable findings. The events can be security logs, application traces, infrastructure metrics, network flows, or alerts emitted by other tools. The output is a correlated event, an incident, or an alert that represents a pattern rather than a single data point.
The idea predates the current tooling. Event correlation grew out of decades of work in network and systems management, and by the 1990s was closely tied to complex event processing (CEP), the broader discipline of detecting patterns across event streams in near real time. In security, the correlation engine is the analytical heart of a SIEM (security information and event management) platform: the SIEM stores the logs, and the engine reasons over them to flag a brute-force attempt, a lateral-movement pattern, or data exfiltration. In observability and IT operations, the same idea groups the cascade of alarms from a single underlying failure into one incident.
It helps to separate correlation from two things it is often confused with. Aggregation simply counts or groups similar events (how many failed logins in the last minute). Deduplication collapses identical or near-identical events into one. Correlation is the step beyond both: it relates events that are not identical and may come from different sources, asserting that together they mean something a single event does not. Ten failed logins followed by one success, then an outbound connection to an unfamiliar address, is not twelve separate events. It is a candidate account-takeover, and recognizing that is the correlation engine’s job.
Why correlation engines are important
The first reason is volume. The number of events a mid-sized environment generates exceeds what any team can read, let alone reason about. Endpoints, servers, network devices, cloud control planes, identity providers, and applications each emit a continuous stream, and the totals run to billions of events a day in large deployments. Without something that reduces that stream to the few items that warrant attention, the evidence of an attack or an outage is present in the logs but buried too deep for anyone to find in time.
The second reason is ambiguity. A single event seldom carries enough information to decide anything. A failed login could be a typo or the start of a credential-stuffing campaign; a process spawning a shell could be an admin script or a foothold. The information that disambiguates the event is usually in other events: what happened just before, what the same user or host did elsewhere, whether the pattern matches a known attack sequence. Correlation supplies that missing context automatically, instead of leaving every analyst to reconstruct it by hand.
The third reason is that the things worth catching are inherently cross-system. An intrusion moves from a phishing email to a credential to an endpoint to a server to a data store, touching a different tool at each step; a production outage shows up at once as elevated latency, error-rate spikes, and failed health checks across services that depend on one degraded component. In both cases the event in any single tool is only a fragment, and the real situation is visible only when the fragments are joined. A correlation engine does that joining, which is why it sits at the center of both the security operations center and the modern observability stack: the detection and collection tools are necessary, but correlation turns their output into a decision.
How a correlation engine works
A correlation engine runs as a continuous pipeline. The stages below trace the path an event takes from arrival to action.
Collection and normalization come first. Events arrive from collectors, agents, log forwarders, and APIs in a sprawl of formats, and the engine cannot compare them until they share a schema. Normalization parses each event into common fields (timestamp, source and destination, user, host, action, outcome) so that a Windows event log, a firewall syslog message, and a cloud audit record become comparable records. The quality of this step bounds everything downstream, because correlation across sources is only possible once the sources speak the same field names.
Enrichment adds context the raw event lacks. The engine annotates events with information from other systems: geolocation for an IP address, the criticality of an asset from a CMDB, the role and department of a user from an identity provider, or a threat-intelligence reputation for a domain. An enriched event carries not just what happened but enough about the entities involved for later stages to judge whether it matters.
Correlation is the core. The engine evaluates incoming events against its correlation logic, whether that is a set of rules, a statistical baseline, or a model, and looks for the patterns that logic describes. This usually involves maintaining state across a time window, because most meaningful patterns are sequences rather than single events: the engine holds recent events in memory and tests whether a new arrival completes a pattern that earlier ones began.
Scoring and prioritization rank what correlation surfaces. The engine assigns a severity or risk score based on factors like the criticality of the assets involved, the confidence of the match, and how closely the pattern resembles known malicious behavior, which lets a downstream team work the highest-risk findings first instead of a flat, undifferentiated queue.
Action closes the loop. A correlated finding can raise an alert, open or update an incident, notify a responder, or trigger an automated playbook in a SOAR (security orchestration, automation, and response) tool: isolating a host, disabling an account, or opening a ticket. The range of authorized automated responses is one of the main things that separates a passive monitoring setup from an active one.
These stages form a loop, not a funnel. Incidents the engine creates become events other rules can reference, analyst dispositions tune scoring over time, and new threat intelligence reshapes enrichment and correlation alike, so the engine keeps refining what it treats as significant.
Types of data processed by correlation engines
A correlation engine is only as good as the breadth and quality of what it ingests, because a relationship it cannot see across is one it cannot find. The common input types span several categories.
Logs are the traditional backbone: system and application logs, authentication logs, firewall and proxy logs, DNS logs, cloud audit trails. They are the richest record of discrete actions and the primary fuel for most security correlation.
Metrics are numeric time series such as CPU, memory, request rate, and latency. They dominate observability correlation, where a pattern across metrics from related services often pinpoints a degradation faster than logs do.
Traces and events capture structured occurrences: distributed traces that follow a request across services, application events, and lifecycle events from orchestration systems, tying activity in one component to its cause or effect in another.
Network and flow data (NetFlow, packet metadata, connection records) describe what is talking to what. This is central to detecting lateral movement, exfiltration, and command-and-control traffic, where the relationship between endpoints is the signal.
Threat intelligence supplies external context: known-malicious IPs, domains, file hashes, and adversary tactics, used both to enrich events and to drive rules that fire when internal activity matches a known indicator.
Identity, asset, and configuration context comes from identity providers, CMDBs, asset inventories, and vulnerability scanners. It is less about events than about the entities events refer to (who a user is, how critical a host is, which vulnerabilities sit on it), and it lets the engine weigh an event by the importance and exposure of what it touches.
Alerts from other tools are increasingly an input in their own right. EDR, cloud security, and application-security tools each emit their own alerts, and a higher-level engine relates those alerts to one another, a pattern sometimes called alert correlation or, in security, the job of XDR (extended detection and response).
The breadth across all of these matters: the more sources the engine can normalize and relate, the more complete the picture it assembles, and the fewer cross-system patterns slip through the gaps between tools.
Correlation engine architecture
The internal architecture of a correlation engine follows the pipeline above, implemented as a set of components that can usually be identified in any product, whether a SIEM, an observability platform, or a standalone CEP system.
Ingestion and collectors receive data from agents, forwarders, message queues, and APIs, handling buffering and back-pressure so a burst of events does not overwhelm the system, and parsing and normalization transform raw input into the common event schema. An event store or streaming layer then holds the data: older designs index events into a searchable store, streaming-first designs route them through a bus such as Kafka so correlation logic can evaluate them as they pass, and many modern systems do both, writing to durable storage while a streaming path handles real-time correlation.
The correlation engine proper evaluates events against rules or models, and is frequently built on a complex event processing core designed to match patterns over continuous streams with low latency. State and window management support it, holding the recent events and partial matches that time-based and sequence-based patterns require and expiring them as windows close. This is one of the harder parts of the design, because it has to track many partial patterns at once without unbounded memory growth. Outputs and integrations deliver results to dashboards, alerting channels, ticketing systems, and SOAR platforms.
The architectural divide worth naming is batch versus streaming. A batch-oriented engine periodically runs correlation queries over stored events, which is simple and good for retrospective analysis but adds latency before a pattern is caught. A streaming engine evaluates events as they arrive, which is what real-time threat detection and live incident correlation require. Most current platforms lean streaming for detection and keep stored data for investigation. Underneath, most of these engines sit on flat, tabular, or indexed event stores, which shapes what kinds of correlation are cheap and what kinds are awkward, a point that matters when the patterns of interest are about relationships rather than sequences.
Event correlation methods and techniques
Correlation engines do not use a single technique. They combine several, each suited to a different kind of pattern, and the mix is much of what distinguishes one engine from another.
Rule-based correlation is the oldest and still the most common. An analyst encodes a pattern as an explicit rule, often Boolean logic over fields plus a threshold and a time window: more than N failed logins from one source within M minutes followed by a success, for example. Rules are precise and transparent, which is why they remain the backbone of SIEM detection, but they only catch what someone thought to write.
Temporal correlation relates events by their ordering and timing: a specific sequence within a window, or events that consistently occur together in time. It is what lets an engine recognize an attack chain or distinguish a cause from its downstream effects, and it underlies most rule-based sequence detection.
Spatial or topological correlation relates events by a shared entity or by their position in a known topology: events touching the same host, user, or IP, or alarms that propagate along the dependency graph of a network or service mesh. In IT operations this is how a storm of downstream alarms gets traced back to the one upstream component that failed. The relationships it depends on (which host belongs to which user, which service depends on which) are exactly the context that flat event tables represent poorly.
Statistical and anomaly-based correlation establishes a baseline of normal behavior and flags deviations rather than matching a predefined pattern, through counting, moving averages, and outlier detection over metrics or event rates. It catches novel patterns a rule would miss, but an anomaly is not the same as a problem, so it needs careful tuning.
Machine-learning-based correlation extends the statistical approach with models that learn patterns from historical data: clustering related alerts, classifying events, or scoring sequences by learned likelihood. Behavioral analytics (UEBA, user and entity behavior analytics) is the best-known security example. ML can surface relationships no one specified in advance, at the price of less transparency and a dependence on representative training data.
No single method is sufficient, and a capable engine layers them: rules for the known and high-confidence cases, statistical and ML methods for the unknown, and temporal and topological logic threading through both to assemble sequences and trace common causes. The practical challenge is less choosing a method than combining them without each one’s failure mode flooding the others’ output, which is the problem the next two sections address.
How correlation engines reduce alert fatigue
Alert fatigue is the state in which analysts face more alerts than they can investigate, so real threats get lost among false positives and the team grows numb to the queue. It is well documented: in the SANS 2025 Detection and Response Survey, 73% of organizations named false positives as their number one challenge in threat detection, and industry studies routinely find that a large share of alerts go uninvestigated simply because there are too many. The cost is not only missed detections but burnout and turnover among the analysts who work the queue.
Correlation is one of the main mechanisms for fighting it, because reducing many events to a few findings is the same operation as reducing many alerts to a few worth acting on. Several techniques do the reducing.
Deduplication and grouping collapse repeated or related alerts into one. The hundred identical alarms from a flapping service, or the dozens of EDR alerts from one malware execution, become a single finding with a count, not a hundred queue entries.
Aggregation into incidents assembles the separate alerts that belong to one situation into a single incident object. Instead of triaging the phishing alert, the suspicious-login alert, and the data-access alert independently, an analyst works one incident that already ties them together, which is both faster and less error-prone.
Suppression and filtering silence the alerts a team has decided are not worth seeing, through allowlists, maintenance windows, and rules that mute known-benign patterns. Done carefully this removes noise; done carelessly it hides real signal, which is the risk to manage.
Prioritization and risk scoring reorder what remains so the highest-risk findings rise to the top. By weighting findings by asset criticality, confidence, and threat context, the engine turns a flat queue into a ranked one, so limited analyst time goes to what matters most.
The honest caveat is that a correlation engine reduces alert fatigue only when its logic is well built. Poorly written rules and untuned anomaly detection are themselves major sources of false positives, so an engine can just as easily add to the noise it is meant to cut. The reduction is a property of the rules and models, not an automatic benefit of having an engine. That is why the context an engine brings to bear, the subject of the next section, matters so much: context is often the difference between a finding that is correctly suppressed and one that is correctly escalated.
The role of context in correlation engines
Context is what separates a correlated finding that is real from one that is a coincidence. The same pattern of events means very different things depending on the entities involved: a burst of database queries from a batch-analytics service account is routine, while the identical burst from a developer’s laptop at 3 a.m. is worth a look. Without context, a correlation engine can only reason about the events themselves; with it, the engine can reason about what the events mean for the specific assets, identities, and relationships in play.
Enrichment context is the first layer, and the pipeline already supplies much of it: asset criticality, user identity and role, geolocation, vulnerability state, and threat-intelligence reputation, attached to events so scoring and rules can use them. This is what lets an engine raise the priority of an event touching a crown-jewel database, or discount one from a sandboxed test host. The richer this context, the more precisely the engine tells important from unimportant.
Relationship context is the deeper layer, and the one flat event data represents worst. Many of the most valuable correlation questions are about how entities connect rather than about any single event: which assets a compromised account can reach, what the blast radius of a given host is, which exposed vulnerabilities sit on a path to regulated data, or which seemingly unrelated alerts all touch the same underlying identity. These are multi-hop, relational questions, and answering them means traversing a graph of how assets, identities, events, and alerts connect. In a flat or indexed event store, that traversal is awkward and slow, because the relationships are implicit in shared identifiers scattered across many tables rather than modeled as first-class links.
A graph approach fits this kind of context directly, because attack paths, asset dependencies, and identity relationships are naturally a graph. The traditional way to get one was to export event and asset data into a separate graph database through an ETL pipeline, then keep that copy in sync, which adds latency, cost, and another system to secure. PuppyGraph takes a different path: it is a graph query engine that maps existing tables (assets, identities, events, alerts, vulnerabilities) to nodes and edges and runs multi-hop traversals over them where the data already lives, in a SQL database, a warehouse, or a data lake using open table formats like Iceberg, with no copy into a separate database. Analysts query the graph with openCypher (Gremlin is also supported), asking what a compromised credential can reach or which paths lead to a sensitive asset, and get the connected subgraph back rather than a stack of disconnected findings. Because it is a query engine that compiles a traversal into graph operators executed in its own engine, rather than a layer that translates the query into SQL and pushes it down to the source, deep multi-hop queries stay practical over data that was never modeled as a graph. PuppyGraph is not itself a correlation engine and does not replace the SIEM or observability platform that produces the events; it is a relationship layer that complements them, turning the entities those tools reference into a graph an analyst can traverse. This kind of graph layer for security correlation, unified asset inventory, and exposure analysis is used by Palo Alto Networks, Datadog, Netskope, Trend Micro, Sola Security, and Blackpoint Cyber.
Context, in both layers, is the multiplier on everything a correlation engine does. The methods decide which patterns the engine can match; the context decides whether a matched pattern is worth a human’s attention. An engine rich in enrichment and relationship context produces fewer, sharper findings, no matter how sophisticated its correlation logic.
Conclusion
A correlation engine is the component that turns a flood of individual events into a small set of findings worth acting on. It collects and normalizes data from many sources, enriches it with context, relates events through a combination of rule-based, temporal, topological, statistical, and machine-learning methods, scores what it finds, and drives an alert, an incident, or an automated response. Its value is not in collecting more data, which every tool in the stack already does, but in the correlation step that no single tool performs on its own, which is why it sits at the heart of both the security operations center and the modern observability platform.
Two things determine whether that value is realized: how well the engine cuts alert fatigue rather than adding to it, and how much context it can bring to each finding. Both come down to relationships, between events, and between the entities those events touch. To see how a graph layer over existing event, asset, and identity data makes relationship-context questions like attack paths and blast radius queryable without standing up a separate database, try the forever-free PuppyGraph Developer Edition and book a demo with the team to see how openCypher and Gremlin queries run over warehouse and lakehouse tables, with no graph-specific ETL, alongside the correlation engine that produces the findings.

Sa Wang is a Software Engineer with exceptional mathematical ability and strong coding skills. He holds a Bachelor's degree in Computer Science and a Master's degree in Philosophy from Fudan University, where he specialized in Mathematical Logic.


