

Customer-Facing Analytics: Benefits, Examples & Tools
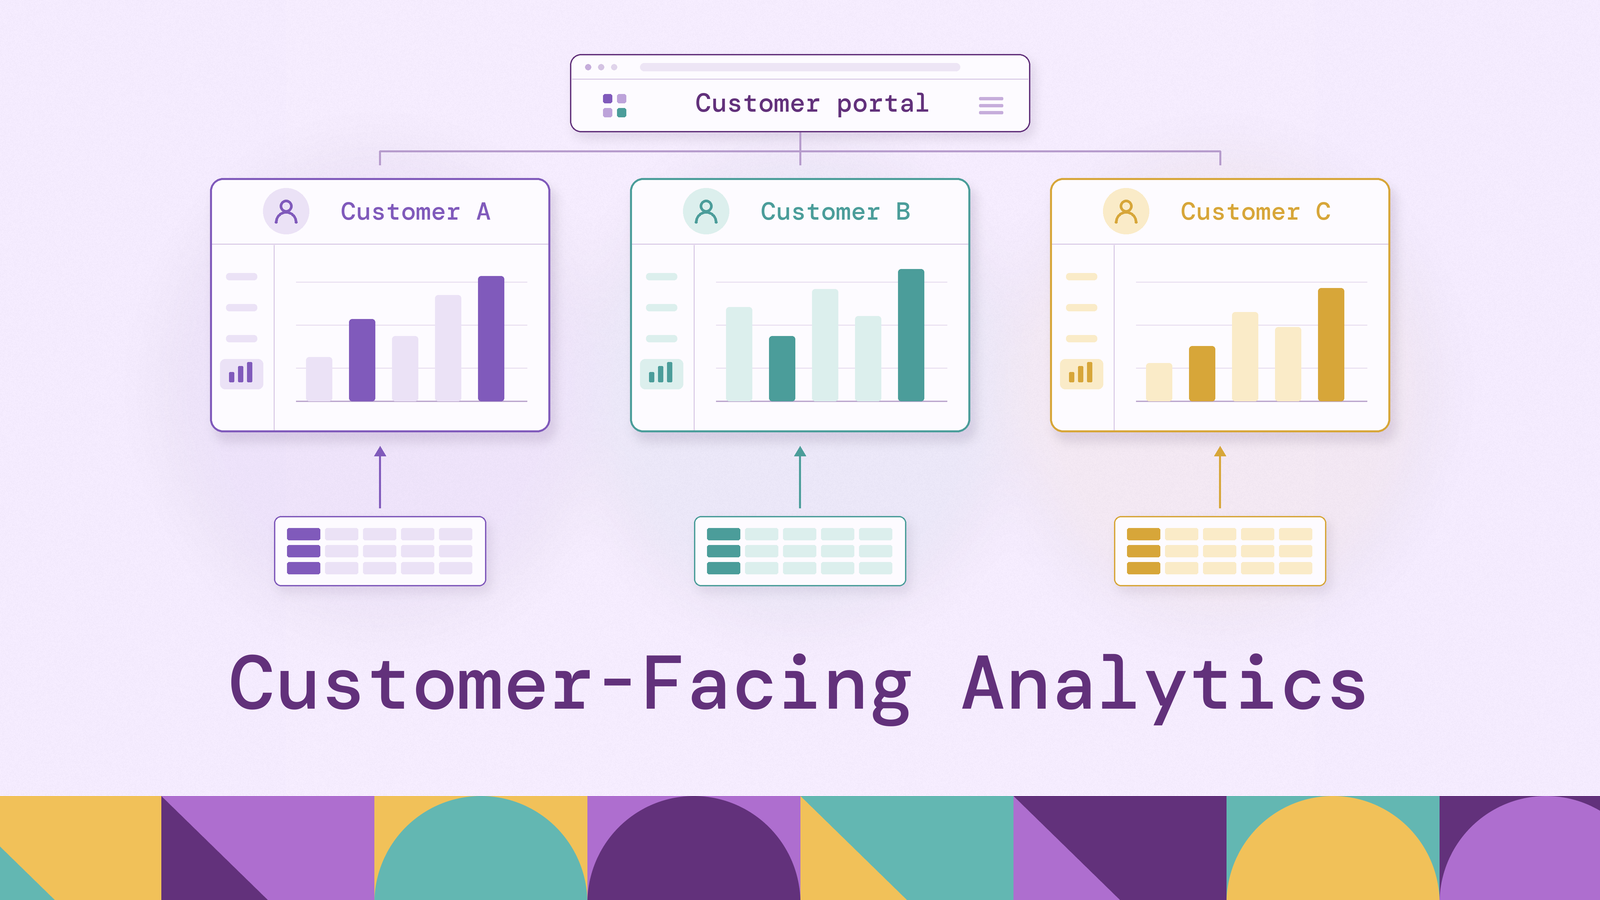
Customer-facing analytics looks like business intelligence turned outward. A store owner checks last month's sales, a developer checks how many API calls an integration made, and a security team checks how many threats a tool blocked, each inside the software they already use. The engineering behind it is different, though. Internal BI serves a known group of employees who will wait for a slow dashboard. Customer-facing analytics serves thousands of customer organizations at once, which SaaS engineers call tenants. Each tenant must see only its own data, and the charts have to load as fast as the rest of the app.
That difference drives every decision, from which database answers the queries to whether the team builds the dashboards or buys them from an embedded BI vendor. This guide covers what customer-facing analytics is, with real examples; why companies add it; how it differs from traditional BI; the features it needs; the build-versus-buy decision and the tools on each side; and the benefits.
What is customer-facing analytics?
Customer-facing analytics means the dashboards, reports, and data a software company shows its own customers inside its product, built from each customer's own data. It is also called embedded analytics or user-facing analytics, though vendors draw the lines between the terms differently. Embedded analytics, for example, also covers dashboards built into internal tools for employees.
Three traits follow from the viewer being a customer rather than an employee. They see only their own organization's data. They sign in through the app's normal login, not a separate BI tool. And because the analytics is part of the app, customers expect it to look like the rest of the app, stay up when the app is up, and load just as quickly.
A few well-documented examples show the range:
- LinkedIn's "Who's Viewed Your Profile." The feature was built on Apache Pinot, an analytics database LinkedIn developed in-house. By LinkedIn Engineering's 2014 account, Pinot powered 18 member-facing analytics products, with the profile-views feature handling thousands of requests at latencies in the tens of milliseconds.
- Uber Eats Restaurant Manager. Uber's 2017 engineering post on Restaurant Manager describes a dashboard that shows restaurant partners how their business is doing. Data arrives through Kafka streams and batch jobs, and Pinot answers the dashboard's queries.
- Shopify merchant analytics. Every Shopify store gets an analytics dashboard and core reports on sales, sessions, and channels. Shopify makes its main analytics features available on any subscription plan.
- Stripe Sigma. Sigma lets Stripe users write SQL queries against read-only data about their own payments, subscriptions, customers, and payouts. Queries can run on a schedule and deliver results by email or webhook.
The examples also differ in how much control customers get. The simplest version is a set of fixed charts the product team designs. Next come interactive dashboards with filters, drill-downs, and date pickers. Beyond that, customers build their own reports, and at the far end they query the data directly, as with Sigma, or receive it in their own data warehouse through data sharing. Most products start with fixed charts and add control as customers ask for it. Each step adds engineering work: keeping customers' data separate, keeping query costs in check, and supporting more ways to use the data.
Why do you need customer-facing analytics?
Customers usually ask for their data before the company decides to offer analytics. The requests show up as support tickets asking for CSV exports, as account managers building quarterly review decks by hand, and as customers pulling data through the API to build their own reports. Each one is a sign that customers value the data and are not yet getting it from the app.
Showing value the customer cannot see. Some products deliver value that is invisible without numbers: an email platform's delivered messages, a security tool's blocked attacks, a logistics platform's on-time deliveries. Without analytics, the person who decides on the renewal has to take that value on trust.
Decisions where the work happens. A restaurant owner adjusting a menu or a seller repricing stock makes better calls when the numbers are on the same screen where they make the change. Exporting to a spreadsheet and coming back breaks that loop.
Manual reporting that does not scale. Hand-built exports and quarterly decks grow with the number of customers, and the work falls on support, customer success, and internal data teams.
Competitive pressure. Once the leading products in a category offer analytics, buyers start to treat it as a requirement rather than a differentiator.
Customer-facing analytics is not always worth building right away. If only a handful of large accounts ask for data, a scheduled export or a data-sharing feed may meet the need at a fraction of the cost. A full analytics feature makes more sense as more customers would use it, and as the numbers do more to show what the product is worth.
Customer-facing analytics vs. traditional business intelligence (BI)
Both turn data into charts and tables, and some tools do both jobs. The differences come from who is looking at the charts and what happens when something goes wrong.
The last row explains most of the others. A mistake in internal BI stays inside the company. A mistake in customer-facing analytics is a bug customers see, and showing one customer another customer's data is a data breach. That is why customer-facing analytics enforces access control in the data layer rather than only in the front end, treats speed as a requirement, and needs a cost model that does not grow with every new viewer. Microsoft splits Power BI embedding into two distinct solutions along the same line. With embed for your organization, each internal user needs a Power BI license. With embed for your customers, users sign in through the app instead and need no license, and the company pays for capacity.
Key features of customer-facing analytics
These features separate a dashboard that looks good in a demo from one that holds up with thousands of customers using it.
Tenant isolation in the data layer. Every query must return only the viewer's own organization's data, and that must not depend on the front-end code remembering to add a filter. Common ways to enforce it are row-level security policies in the database; access filters in the BI tool or semantic layer that add a tenant condition to every generated query; signed tokens that carry the tenant ID from the app to the analytics service; and, for the strictest requirements, a separate schema or database per tenant. Caches need the same care: a cached result stored without the tenant ID in its key can show one customer's numbers to another.
Consistent speed under load. Each dashboard page runs several queries, and many customers open pages at the same time. The database answering those queries has to stay fast under that load. That usually means pre-computing common aggregates, using an analytical database built for many small queries, caching results, or a mix of the three. Per-tenant query limits stop one large customer from slowing everyone else down.
Data as fresh as the rest of the app. Customers compare the charts with what they see on other pages. If an order shows up on the orders page but stays out of the revenue chart for six hours, they notice. How fresh the data must be decides whether a nightly batch load is enough or the pipeline needs streaming.
Native look and feel. The analytics should look like the rest of the app, use its login, and work with its navigation. Options range from iframes with custom themes, which are quick to ship but hard to make feel native, through JavaScript SDKs and web components, to charts the team draws itself from data returned by an analytics API.
Self-service, exports, and API access. As customers get more sophisticated, they ask for filters, custom date ranges, saved views, scheduled email reports, CSV exports, and eventually an API or a direct data feed. Each of these must pass through the same tenant checks as the dashboards. Metric definitions should also live in one place, so that a metric such as revenue is calculated the same way in the chart, the export, and the API.
Build vs. buy: implementing customer-facing analytics
Teams usually answer the build-versus-buy question one layer at a time. A customer-facing analytics stack has four layers, and each can be built, bought, or assembled from open-source parts:
- Storage: where the data lives, usually the company's data warehouse or lakehouse, or the app's own production database for smaller products.
- Serving: the engine that answers dashboard queries fast enough for many users at once, such as a warehouse with result caching or a real-time analytical database like Apache Pinot, ClickHouse, Apache Druid, or StarRocks. Our real-time analytics tools overview covers this layer in more depth, using ClickHouse as its worked example.
- Semantic and API layer: shared metric definitions, tenant filtering, caching, and an API for the front end. Teams either build it by hand or use a semantic layer such as Cube, which limits each query to the right tenant using a security context carried in a signed token.
- Presentation: the charts and controls customers see, either drawn by the team with a charting library or supplied by an embedded BI tool.
Buying an embedded BI tool. The major BI platforms each have a way to embed dashboards for external users. Power BI has its embed-for-your-customers model, also called app-owns-data. Looker uses signed embedding, where user attributes drive row-level access filters. Tableau uses its Embedding API with connected apps, which sign viewers in with a JSON Web Token issued by the host app and can pass user attributes that control which data they see. Open-source Apache Superset offers an embedded SDK whose guest tokens can carry row-level security rules. Embedded-first vendors such as Sisense and Luzmo focus their products on this use case. Buying puts dashboards, drill-downs, exports, and self-service reports into the app quickly, and the vendor keeps adding chart types and features. The trade-offs are dashboards that can feel bolted on, pricing that has to be modeled carefully against the expected number of customers and viewers, and a dependence on the vendor's roadmap for features customers request. An embedded BI tool's dashboards are only as fast as the database underneath.
Building in-house. A team that builds controls the whole experience: charts made from the app's own UI components, an analytics API designed around its own data model, and costs tied to infrastructure rather than licenses. It also has to build everything a vendor would otherwise supply, including tenant filtering, caching, export formats, scheduled reports, and every new chart type customers ask for. Building fits best when analytics is central to what the product sells, when the needed views are well defined, and when license fees at the expected scale would be large.
The hybrid default. Many teams end up in between. They build the serving and API layers themselves, because speed, data isolation, and cost are decided there. On top, they either draw a focused set of charts themselves or add an embedded BI tool for less common, exploratory reports. Where to draw the line depends on how central analytics is to the product, how many customers and simultaneous viewers it must handle, how closely the charts must match the app's design, and how much engineering time the team can commit over the long run.
The serving layer also has to handle a different kind of question: some are about connections rather than totals. A cloud security product shows a customer which resources an exposed credential can reach through a chain of role assumptions. A payments platform shows a business which counterparties are two or three links away from a flagged account. A supply-chain portal shows which lower-tier suppliers feed a delayed order. In SQL, each step along the chain is another self-join, and a chain of unknown length needs a recursive query. PuppyGraph answers these questions as graph queries over the same warehouse and lakehouse tables that feed the rest of the analytics stack, so a view of these connections can sit next to the app's other dashboards without a separate copy of the data.
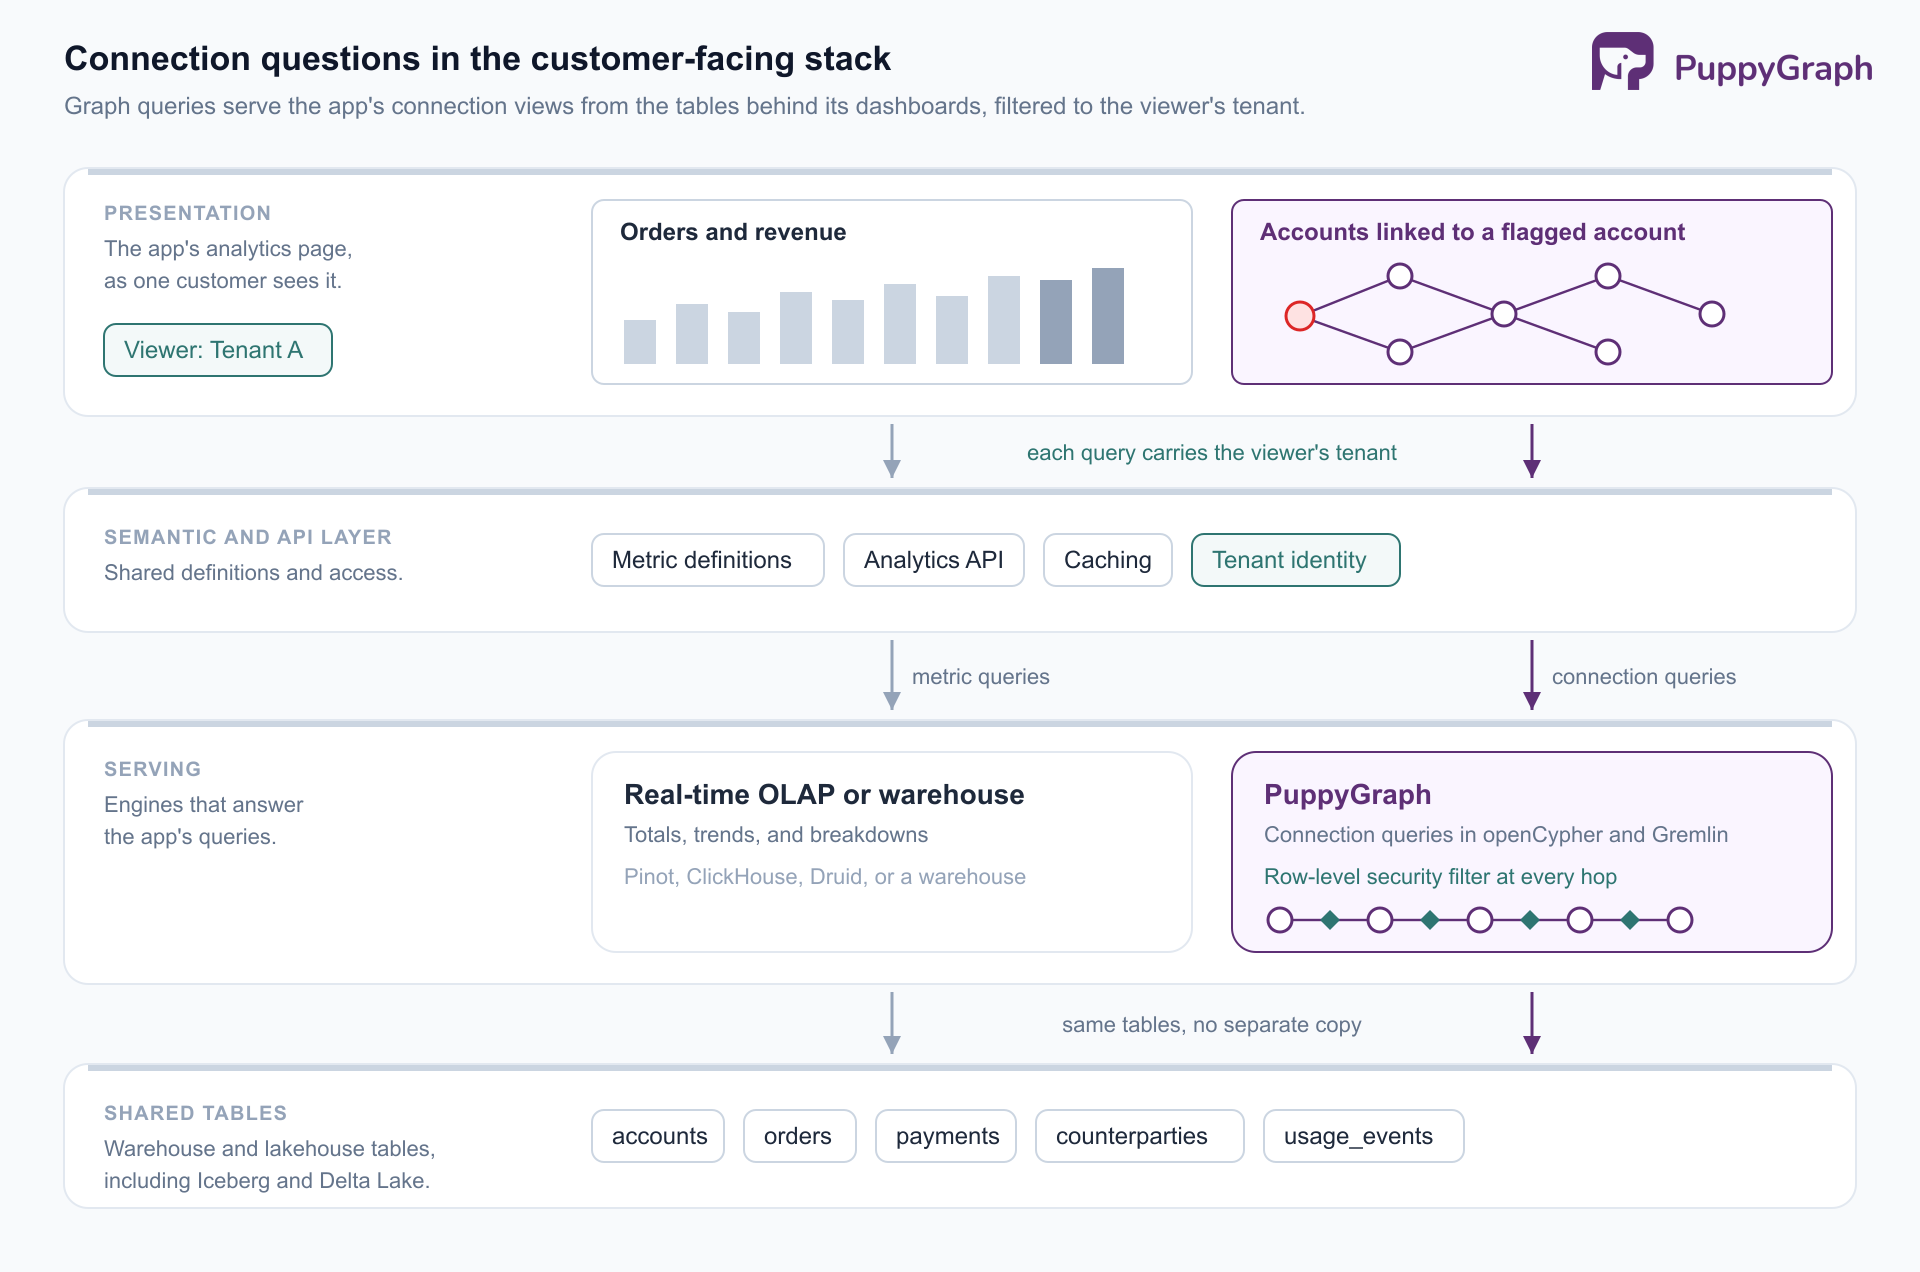
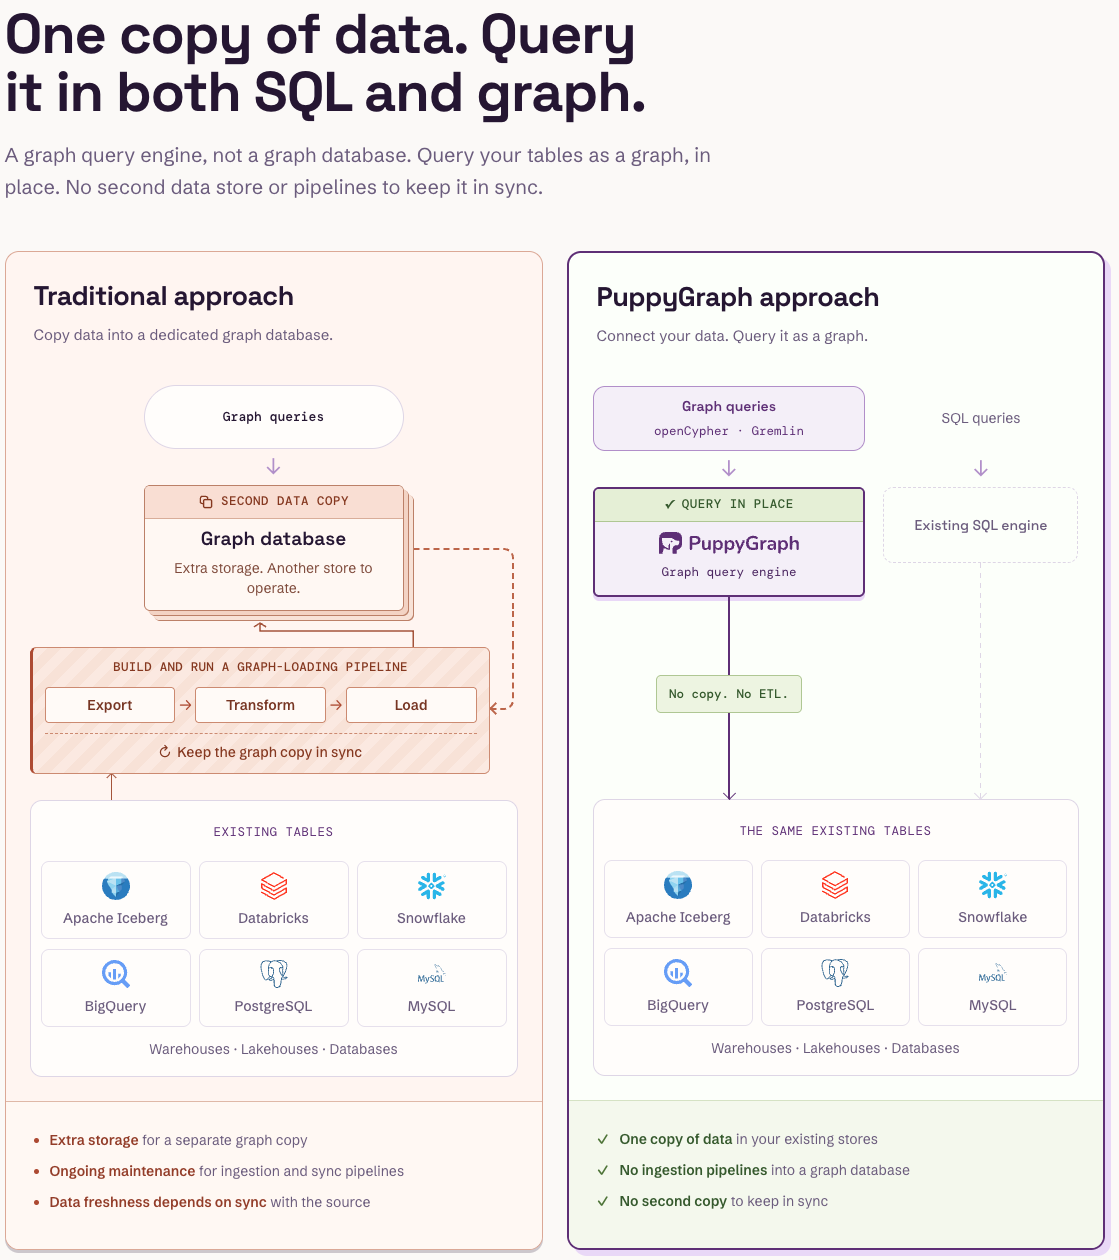
PuppyGraph is a distributed graph query engine. Teams connect it to existing SQL databases, data warehouses, and lakehouses, including direct reads of open table formats like Iceberg and Delta Lake. A graph schema maps tables to nodes and edges, and the built-in AI assistant can build that schema from the connected tables; teams then query with openCypher and Gremlin, or ask the assistant questions in plain language. There is no ETL into a separate graph database, and the same tables stay queryable with SQL. For multi-tenant products, PuppyGraph's row-level security can enforce the tenant boundary inside the engine: filters based on each user's entitlements apply at every step of a traversal, so a path cannot cross into another customer's data through a shared node.
Benefits of customer-facing analytics
With those features in place, both the customer and the company offering the analytics gain.
Customers act on their own data. They get answers when they need them instead of waiting for an export or a review meeting, and they make day-to-day decisions with current numbers on the same screen where they act.
The product's value becomes visible. Renewal and upsell conversations go better when customers can see in their own dashboard what the product delivered, in numbers both sides trust.
A new source of revenue. Advanced analytics can be packaged as a premium tier or add-on. Stripe includes its standard Dashboard with every account and sells Sigma, its SQL environment for custom reports, as a paid product.
Product feedback from usage. The reports customers open, the filters they apply, and the exports they schedule show the product team what customers actually track. That guides both the analytics roadmap and the rest of the product.
All of these benefits depend on trust. A customer who sees a wrong number, a chart that takes too long to load, or someone else's data even once stops relying on the feature. That is why data isolation, speed, and consistent metric definitions come first, and visual polish second.
Conclusion
Customer-facing analytics shows each customer their own data inside the app they already use, and it has to be as fast and reliable as the rest of that app. The charts look like BI, but the requirements are stricter: every query limited to one customer's data, fast responses with many customers using it at once, data as fresh as the rest of the app, and costs that stay manageable as the customer base grows. Teams rarely make a single build-or-buy choice. They decide layer by layer, usually building the serving and API layers, where isolation and speed are decided, and buying or building the charts on top. Questions about connections, such as which accounts or assets link to a flagged one, can be answered as graph queries over the same tables.
Try the forever-free PuppyGraph Developer Edition and book a demo with the team to see how openCypher and Gremlin queries traverse warehouse and lakehouse tables, with no graph-specific ETL, so views of connected data read the same tables as the rest of the app's analytics.

Sa Wang is a Software Engineer with exceptional mathematical ability and strong coding skills. He holds a Bachelor's degree in Computer Science and a Master's degree in Philosophy from Fudan University, where he specialized in Mathematical Logic.


