

What Is Data Cleaning ? The Ultimate Guide
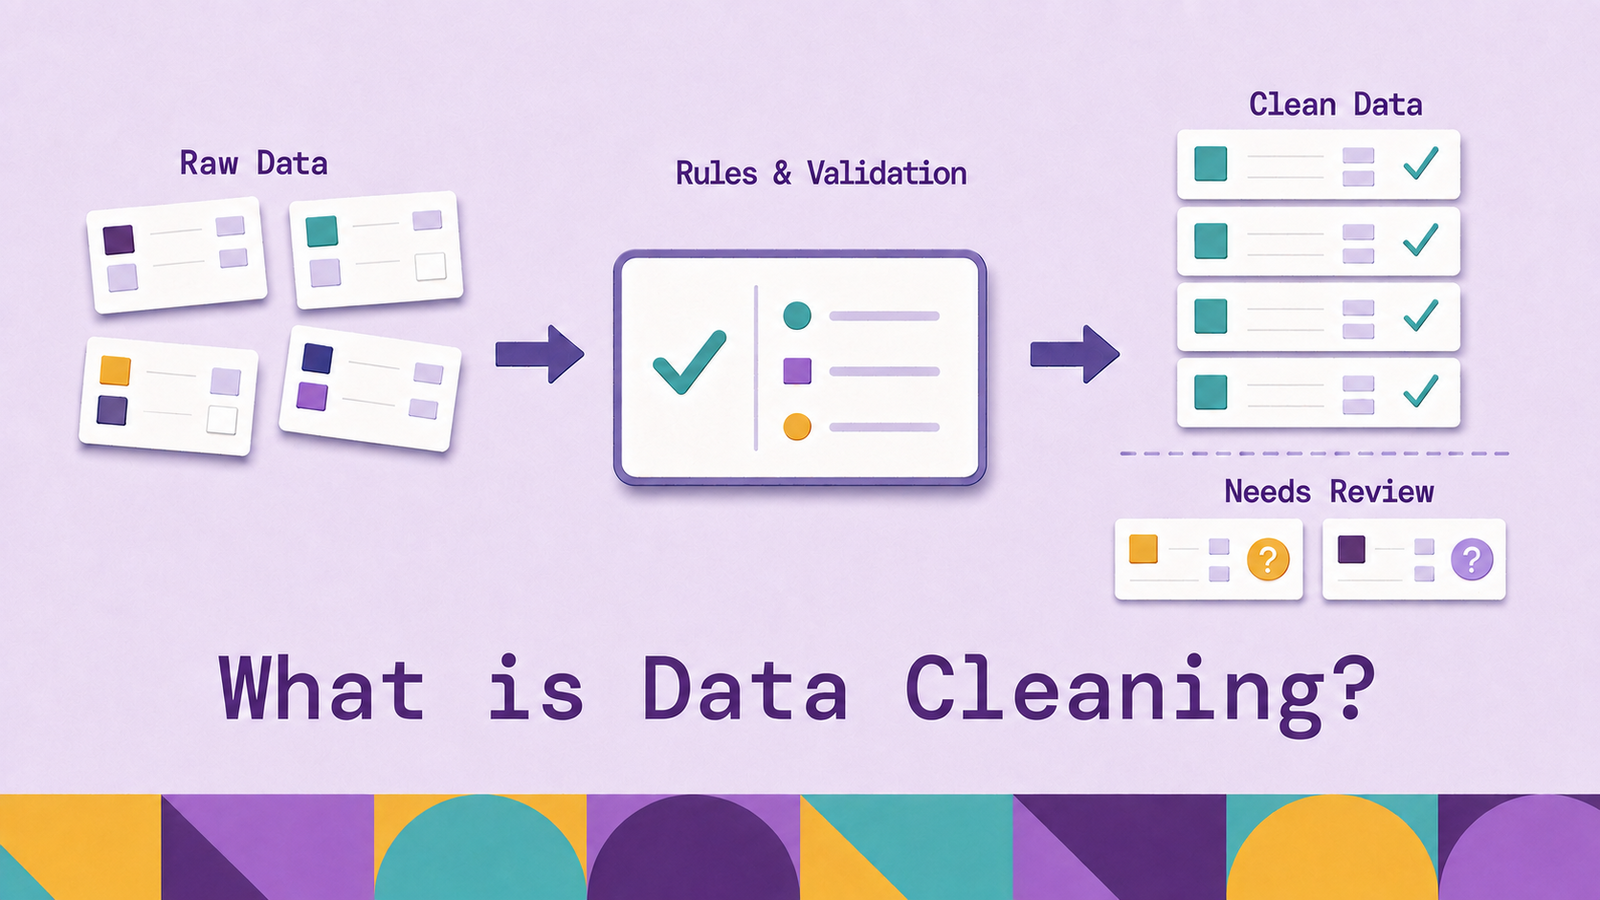
Reliable data cleaning depends less on changing values than on deciding which changes preserve meaning, proving that the rules work, and preventing the same defects from returning with the next data load.
This guide explains how the data cleaning process works, the issues it should detect, the techniques available, and how to turn a one-time cleanup into a repeatable quality control. It also separates useful automation and AI assistance from decisions that still require domain knowledge.
What is data cleaning?
Data cleaning, also called data cleansing, converts raw data into a more accurate, consistent, and usable form. It can include parsing dates, standardizing category labels, resolving duplicate records, correcting invalid values, handling missing fields, and checking relationships between records. Cleaning may happen in a spreadsheet, a script, an ETL or ELT pipeline, or inside the database that stores the data.
Quality is always relative to a purpose. A blank middle name may be acceptable for customer analytics, while a missing account identifier can make a payment record unusable. A temperature of 45 may be valid in Celsius but suspect in Fahrenheit. The UK Government Data Quality Framework expresses this idea as fitness for purpose and evaluates input data through six dimensions: completeness, uniqueness, consistency, timeliness, validity, and accuracy.
Cleaning and validation are closely related but do different jobs. Validation tests whether data follows a rule. Cleaning changes, removes, merges, or quarantines records in response. A validation rule might identify an order whose customer_id has no matching customer; the cleaning decision might restore the missing customer, remap the order to a surviving customer record, or quarantine the order for review. Validation supplies evidence. Cleaning applies a policy.
Data transformation is broader. Calculating revenue from quantity and unit price is a transformation even when the inputs are already clean. Data preparation includes both cleaning and other work needed for analysis, such as joining sources, selecting columns, aggregating rows, and creating features. Keeping the terms separate makes pipelines easier to reason about because a correction should not be hidden inside an unrelated analytical calculation.
Clean data matters because defects compound. A duplicate customer can split transaction history across two identities. A malformed timestamp can place an event outside an incident window. Inconsistent product codes can undercount a category. A model trained on systematically missing values can learn the collection process rather than the phenomenon it is meant to predict. The output may still look plausible, which makes explicit quality rules more useful than a final visual inspection.
How the data cleaning process works
The process is a feedback loop, not a single pass over a file. It begins with an intended use and a data contract: the fields, types, allowed values, relationships, freshness requirements, and tolerances that make a dataset usable. Profiling compares actual data with that contract. Remediation applies approved changes or routes ambiguous records for review. Validation then measures the result, and monitoring checks whether later runs stay within the same limits.
Four artifacts make this loop reproducible:
A raw, immutable input. Preserve the source data or a recoverable snapshot. Cleaning in place destroys evidence and makes it difficult to investigate a bad rule.
A quality specification. Write rules as executable assertions where possible. Examples include order_id must be unique and non-null, quantity must be positive, status must belong to an approved set, and every customer_id must resolve to a customer.
A deterministic transformation. The same input and rule version should produce the same output. Store code, lookup tables, thresholds, and model versions alongside the pipeline.
A quality report. Record row counts, rejected records, duplicate groups, missingness rates, rule failures, and changes made. A clean table without an audit trail cannot explain where values came from.
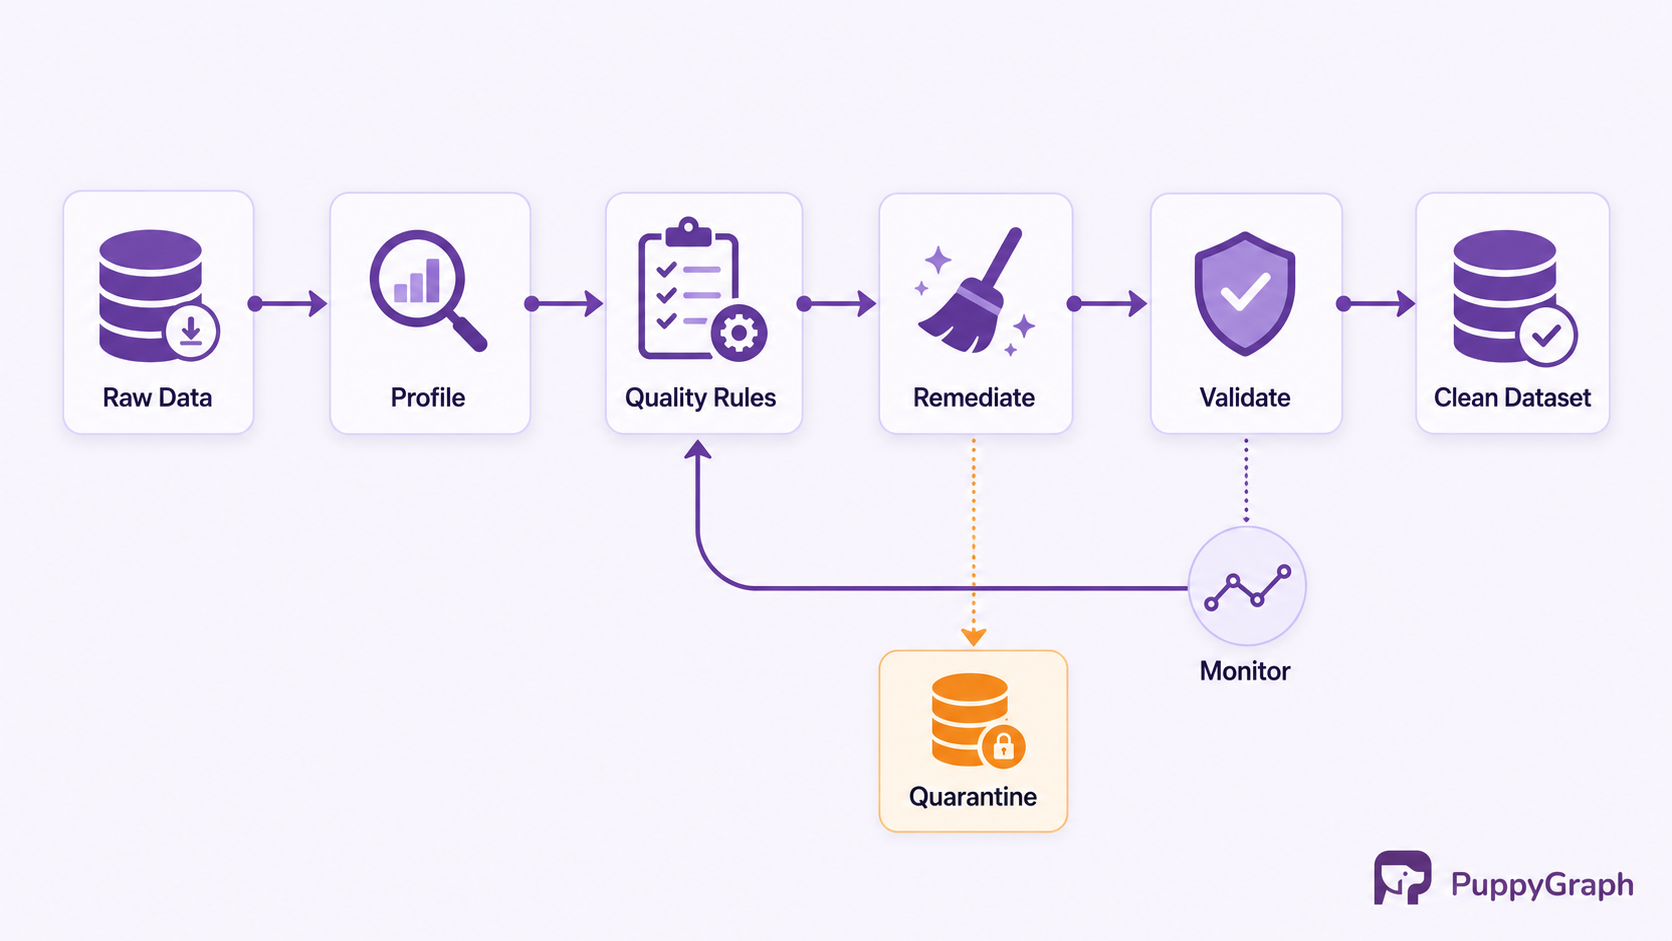
This design makes failures inspectable. If a new source begins sending dates as DD/MM/YYYY instead of ISO 8601, the pipeline can reject or quarantine those rows, surface the failing rule, and retain the raw values. Quietly coercing ambiguous dates would produce a complete-looking table with incorrect facts.
Common data quality issues
The same defect can affect several quality dimensions, so classification is a diagnostic aid rather than a set of exclusive boxes.
Field-level defects concern whether individual values are present, valid, and represented consistently.
Missing data. Values may be absent because a field was optional, collection failed, a join found no match, or the fact does not apply. Blank strings, sentinel values such as -999, SQL NULL, and missing rows all need separate treatment. Completeness does not imply accuracy: a filled field can still be wrong.
Invalid values and types. Examples include a string in a numeric column, an impossible calendar date, a negative quantity, or a category outside the approved vocabulary. Validity means conformance to a type, format, range, or rule. It does not prove truth. A syntactically valid postal code may still belong to the wrong customer.
Inconsistent representations. The values US, USA, and United States may denote the same country. Timestamps may use different zones, weights may mix kilograms and pounds, and identifiers may vary in case or punctuation. Standardization makes equivalent values comparable, but it must retain enough source context to avoid collapsing genuinely distinct meanings.
Identity and relationship defects appear when records must be matched or connected across tables.
Duplicate entities and events. Exact duplicate rows are easy to detect. Entity duplicates are harder because two records can describe the same customer with different spellings, addresses, or identifiers. Repeated events may be legitimate retries or duplicate ingestion. Deduplication therefore needs a business key and a survivorship rule, not just row equality.
Broken relationships. Orphaned foreign keys, many-to-many joins created by duplicate keys, and contradictory hierarchies often appear only when tables are considered together. These defects can multiply rows during joins or create paths that should not exist. Relationship checks deserve the same status as column-level tests.
Contextual defects depend on time, the surrounding population, or the use for which the data was collected.
Inaccurate or stale data. Accuracy concerns whether a value matches reality, while timeliness concerns whether it reflects the period relevant to the use. An old address may be historically accurate and operationally stale. These issues often require comparison with an authoritative source or confirmation by the data owner; syntax checks alone cannot resolve them.
Outliers and anomalies. An extreme value can be an error, a rare but real observation, or the most important record in the dataset. A sudden transaction spike may be a duplicated batch, a promotion, or fraud. Statistical detection should flag candidates for contextual review rather than automatically erase them.
Biased coverage. A dataset can pass every format and uniqueness check while underrepresenting a region, device type, or customer group. Cleaning cannot manufacture observations that were never collected. Teams should measure coverage, document known gaps, and avoid presenting imputation as if it restores the missing population.
Together, these issues show why a generic command such as “remove bad rows” is not a cleaning policy. Each class requires a definition of what is bad, evidence for the decision, and an appropriate response.
Data cleaning techniques
Data cleaning combines simple operations with domain-specific judgment. The following techniques cover most workflows.
Begin with techniques that reveal defects and test whether values fit their context.
Profile before changing. Calculate null counts, distinct values, distributions, string lengths, type patterns, and key frequencies. Inspect results by source and time window because an overall average can hide a broken partition or supplier feed.
Validate ranges and business rules. A date may need to fall after account creation, an end time after a start time, and a currency code within an approved reference set. Cross-field rules often catch defects that individual column checks miss.
Detect outliers with context. Interquartile ranges, robust z-scores, isolation-based models, and time-series change detection can identify unusual records. Apply them within meaningful peer groups. A high transaction amount may be normal for an enterprise account and anomalous for a new consumer account.
Once a defect is understood, correction and resolution techniques put values into a usable form.
Standardize types, units, and formats. Parse values into explicit data types, normalize time zones, map controlled vocabularies, and convert measurements to a canonical unit. Preserve the original value when conversion is lossy or the source convention is uncertain.
Handle missing values by cause. Drop a row only when the missing field makes it unusable and the removal will not distort the population. Fill a value from an authoritative source when possible. For analysis or machine learning, statistical imputation may be appropriate, but the method and an imputation indicator should travel with the data. The scikit-learn imputation guide distinguishes univariate methods, which use one feature at a time, from multivariate methods that estimate a missing value from other features.
Deduplicate with explicit identity rules. Exact matching works for repeated rows or stable identifiers. Fuzzy matching can compare normalized names, addresses, phone numbers, or other attributes, but it produces candidates rather than proof. Set thresholds using labeled examples, send uncertain pairs to review, and define which source wins when records merge.
Resolve records against reference data. Map free-text values to maintained product, geography, currency, or organization identifiers. Version the reference set so a historical cleaning run can be reproduced after the taxonomy changes.
Keep ambiguous records outside the accepted dataset until a rule or reviewer can resolve them safely.
Quarantine instead of guessing. Route records that cannot be corrected safely to a review table with the failed rule and source context. A pipeline can continue publishing accepted records while preserving ambiguous ones for investigation.
Small datasets can use a spreadsheet or OpenRefine, whose editing workflow supports transformations and clustering similar text values. Python users can detect missing values with isna(), fill them with fillna(), and remove exact duplicates with drop_duplicates() as documented in the pandas missing-data guide and drop_duplicates() reference. At pipeline scale, SQL transformations plus tests are often easier to operate close to the data.
No tool decides what a value should mean. Techniques become reliable only when business rules, source ownership, and review paths are explicit.
How to clean data step by step
The following sequence works for a one-time analysis and can mature into a production pipeline.
- Define the intended use and quality thresholds. Identify the decision, report, model, or application the data will support. Name critical fields and set measurable acceptance criteria. For example: all accepted orders have a unique
order_id; every order resolves to a customer; currency is present; and ingestion delay stays within the reporting window. Do not demand perfection from noncritical fields simply because they exist.
- Preserve and inventory the inputs. Save a read-only copy or snapshot, then record source systems, extraction times, schemas, owners, row counts, and join keys. Check character encodings, delimiters, partitions, and time zones before interpreting values. Many apparent content errors begin as parsing errors.
- Profile the data. Measure missingness, uniqueness, distributions, category frequencies, pattern matches, and referential integrity. Break the profile down by source, date, and other operational boundaries. Review samples from both common and rare values.
- Prioritize defects by impact. Rank findings according to the intended use. A duplicate key that multiplies revenue in a join is more urgent than inconsistent capitalization in an unused comment field. Assign an owner to each high-impact rule and agree on the permitted response: correct, merge, exclude, quarantine, or accept with documentation.
- Implement rules as repeatable transformations. Write transformations in SQL, Python, or the platform that owns the pipeline. Separate detection from correction so each rule reports what it found. Apply low-risk normalization first, then deduplication and relationship repairs that depend on normalized values. Make reruns idempotent so applying the job twice does not keep changing the output.
- Validate the result. Run the quality specification against the cleaned table and reconcile counts with the source. Check how many records each rule modified or rejected. Compare important aggregates before and after cleaning, and inspect samples near thresholds. Tools can turn these assertions into pipeline controls: dbt supports
unique,not_null,accepted_values, andrelationshipsas built-in data tests, while Great Expectations represents rules as Expectations and returns validation results.
- Publish with lineage and monitor drift. Publish the cleaned output separately from raw data. Attach the rule version, run timestamp, quality metrics, and rejected-record location. Monitor those metrics on every load. Alert on material changes in missingness, schema, category distribution, duplicate rate, or freshness, then trace the failure back to its source.
This sequence turns cleaning from an undocumented intervention into an observable data product. The result is not merely a tidier table. It is a table with known rules, measured exceptions, and a recovery path when assumptions change.
Manual vs automated data cleaning
Manual and automated cleaning solve different parts of the problem. Most reliable workflows use both.
Manual work is appropriate when an analyst is learning an unfamiliar dataset, reconciling a small reference list, or adjudicating fuzzy duplicate candidates. Even then, record the operations. Spreadsheet edits should become a mapping table or script if the task will recur.
Automation is appropriate when the rule is stable and explainable: trim surrounding whitespace, parse a documented date format, enforce a key, convert known units, or reject values outside an agreed domain. Automated validation can stop a bad load before downstream consumers see it and can make quality trends visible over time.
The boundary should follow uncertainty. Automate high-confidence decisions. Send low-confidence cases to an exception queue with enough evidence for a reviewer. Sample accepted and rejected results because a rule can pass its own tests while encoding the wrong assumption. This human-in-the-loop design concentrates manual attention where it changes outcomes instead of repeating mechanical edits.
AI-powered data cleaning
AI can help where rules are difficult to enumerate but examples and context are available. Research has used language models to extract structured records and construct or canonicalize schemas from text and to detect and reason about anomalies in tabular data. Separate work found that models can draft validation tests from supplied context or data samples, but that even the strongest tested configurations complemented rather than replaced a suite created by an experienced analyst. Embedding and classification models can rank possible duplicate pairs or map free text to a taxonomy. Predictive models can estimate missing values from correlated features.
These systems should produce proposals with confidence and provenance, not silent facts. A model can infer that Acme Intl. and ACME International may be the same organization, but an authoritative identifier or human review must settle the merge when the consequence matters. An imputed income is a model output, not an observed income. Store that distinction explicitly.
A controlled AI cleaning workflow has five safeguards:
Constrain the task. Give the model an approved schema, reference vocabulary, and allowed operations. Free-form rewriting is difficult to validate.
Require structured output. Return the source value, proposed value, reason, confidence, and rule or reference used. Reject responses that do not conform to the output schema.
Set decision thresholds. Auto-apply only changes that have demonstrated acceptable precision on labeled examples. Route the uncertain middle to review and leave low-confidence values unchanged.
Evaluate by error cost. False merges can be harder to reverse than missed duplicates. Build evaluation sets that reflect rare categories and operational edge cases, not just average records.
Monitor and version. Record prompts, models, reference data, thresholds, and reviewer decisions. Distribution changes can degrade a model even when the code does not change.
AI expands the set of defects a pipeline can triage, especially in text and entity resolution. Its output still needs the same controls as any other cleaning rule: a stated purpose, evidence, validation, auditability, and a safe path for exceptions.
Relationship structure provides another useful check. Duplicate identities may share accounts, devices, addresses, or transactions, while a proposed merge may create contradictory relationships. PuppyGraph lets teams define a graph schema that maps existing warehouse and lakehouse tables to nodes and edges, then runs openCypher and Gremlin queries over those relationships without graph-specific ETL. This can help teams investigate cross-table quality issues in place. It does not correct dirty source values automatically, and the underlying sources remain the systems of record. PuppyGraph validates each query against the graph schema before execution and rejects references to entities or relationships outside the defined model. This catches semantic errors without certifying that every source value is accurate.
Conclusion
Data cleaning makes data fit for a defined use. It starts by translating that use into measurable rules, then profiles the raw inputs, corrects or quarantines defects, validates the result, and monitors future loads. Missing values, duplicates, invalid formats, inconsistent representations, stale facts, outliers, broken relationships, and biased coverage require different responses. Treating them all as rows to delete loses information and can introduce new errors.
The durable approach combines automation with judgment. Code handles stable, repeatable rules. People resolve ambiguity and own the business definition. AI can rank and propose difficult corrections, but its inferences should remain distinguishable from observed facts. Raw inputs, rule versions, quality reports, and exception records make the entire process explainable and reversible.
Try the forever-free PuppyGraph Developer Edition and book a demo with the team to see how openCypher and Gremlin queries examine quality across relationships in warehouse and lakehouse tables, with no graph-specific ETL, while corrections remain governed in the source data.

Hao Wu is a Software Engineer with a strong foundation in computer science and algorithms. He earned his Bachelor’s degree in Computer Science from Fudan University and a Master’s degree from George Washington University, where he focused on graph databases.


