

What Is Data Collection? Methods, Process
.png)
Data collection determines what an analysis, dashboard, or AI system can know. A pipeline can move every record without error and still produce a weak dataset if the design measures the wrong population, asks a leading question, or drops essential context.
This guide explains what data collection includes, why its design matters, how the process works, and which methods fit different questions. It also distinguishes primary from secondary collection and structured from unstructured data so teams can choose tools and controls that match the evidence they need.
What is data collection?
Data collection is the planned acquisition and recording of observations for a defined purpose. Observations may come from people, transactions, software, sensors, experiments, documents, or datasets assembled by another organization. They need enough context for interpretation, including who or what they describe, when and how they were captured, and their units and source.
The purpose is part of the definition. Recording every page view may support product analytics, but it does not by itself measure whether a user accomplished a task. A survey response may capture satisfaction, but only for the people reached by the sampling and response process. Collection turns a question into observable evidence, so the design must connect the intended decision to a measurable concept.
Several adjacent activities follow the design choice. Data generation creates a potential observation. Data collection decides what to capture and records it. Data ingestion transports records, data integration combines sources, and data cleaning resolves defects. Reliable transport cannot repair a biased sample or ambiguous question.
A complete collection record includes more than a value. It carries identifiers, timestamps, source and method, coding rules, use restrictions where relevant, and quality indicators. These details make analysis reproducible and distinguish observed facts from inferred, transformed, or imputed values.
Why data collection matters
Every downstream result inherits the boundaries of the collection process. The process affects not only accuracy, but also which questions the data can answer and which conclusions it cannot support.
Validity. The collected variable must represent the concept of interest. Session duration is easy to record, but it may be a poor proxy for engagement if a tab can remain idle. A valid design defines the construct first, then selects a measurement that reflects it.
Coverage and representation. A large dataset can systematically miss a relevant group. An online-only survey excludes people who cannot or will not use that channel. An application dataset describes current users rather than people who abandoned signup. For AI systems, the NIST AI Risk Management Framework specifically calls for documenting data availability, representativeness, suitability, and construct validation for the intended context of use.
Consistency and comparability. Stable definitions, units, instruments, and timestamps make observations comparable. If one service records gross order value while another records net value after returns, putting both in a field named revenue creates a semantic defect that format validation will not catch.
Traceability. Analysts need to know where a record came from and what happened to it. The W3C PROV model represents provenance through the entities, activities, and agents involved in producing data. In practice, a useful trail includes the source, collection time, instrument or software version, transformations, and responsible owner.
Privacy and control. Collecting data creates obligations as well as analytical options. The EU General Data Protection Regulation's Article 5 principles include purpose limitation, data minimization, accuracy, and storage limitation for personal data. Defining a purpose and collecting only necessary fields also reduces exposure and operating cost.
These dimensions work together. A dataset is useful only when it measures the intended concept across the relevant population, preserves comparable definitions and provenance, and stays within its permitted purpose. Collection design establishes those boundaries before downstream tools begin processing the records.
How the data collection process works
The process begins before a form, connector, or tracking library is configured. It converts a decision into a collection plan, tests that plan, and monitors the evidence as it arrives.
- Define the decision and questions. Name who will use the data, what decision it supports, and when the answer is needed. Replace a broad goal such as “understand churn” with a testable question about a defined population and period.
- Operationalize the concepts. Translate each concept into observable variables. Define events, labels, units, time windows, inclusion rules, and what one record represents. Separate measurements from proxies and document their assumptions.
- Identify the population and sources. Decide which people, devices, transactions, systems, or documents are in scope. Define sampling rules, list exclusions, and consider whether they correlate with the measured outcome.
- Choose methods and tools. Match the method to the question. Surveys capture self-reports, interviews expose reasoning, experiments estimate effects under stated assumptions, and telemetry records behavior or system state. Cost, latency, burden, and precision constrain the choice.
- Set governance and access rules. Establish the basis for collection, notice and consent requirements, retention, permitted uses, access controls, and deletion procedures. Assign owners before data accumulates.
- Design the instrument and data contract. Build the questionnaire, interview guide, event schema, sensor configuration, extraction query, or annotation protocol. Define required fields, identifiers, types, units, allowed values, timestamp semantics, source metadata, and versioning.
- Pilot and calibrate. Test realistic cases. Cognitive testing can reveal how respondents interpret a question, shadow deployment can expose duplicate events, and sensor calibration can detect drift. Revise before scaling.
- Collect and monitor. Track response rates, missing fields, event volumes, lag, schema changes, device health, and sampling balance. Preserve raw inputs or recoverable snapshots so a failing instrument can be investigated.
- Validate, document, and hand off. Reconcile counts, test constraints, inspect samples, and document limitations. Publish provenance, definitions, quality metrics, and exclusions with the dataset. Keep downstream transformations distinguishable from collected observations.
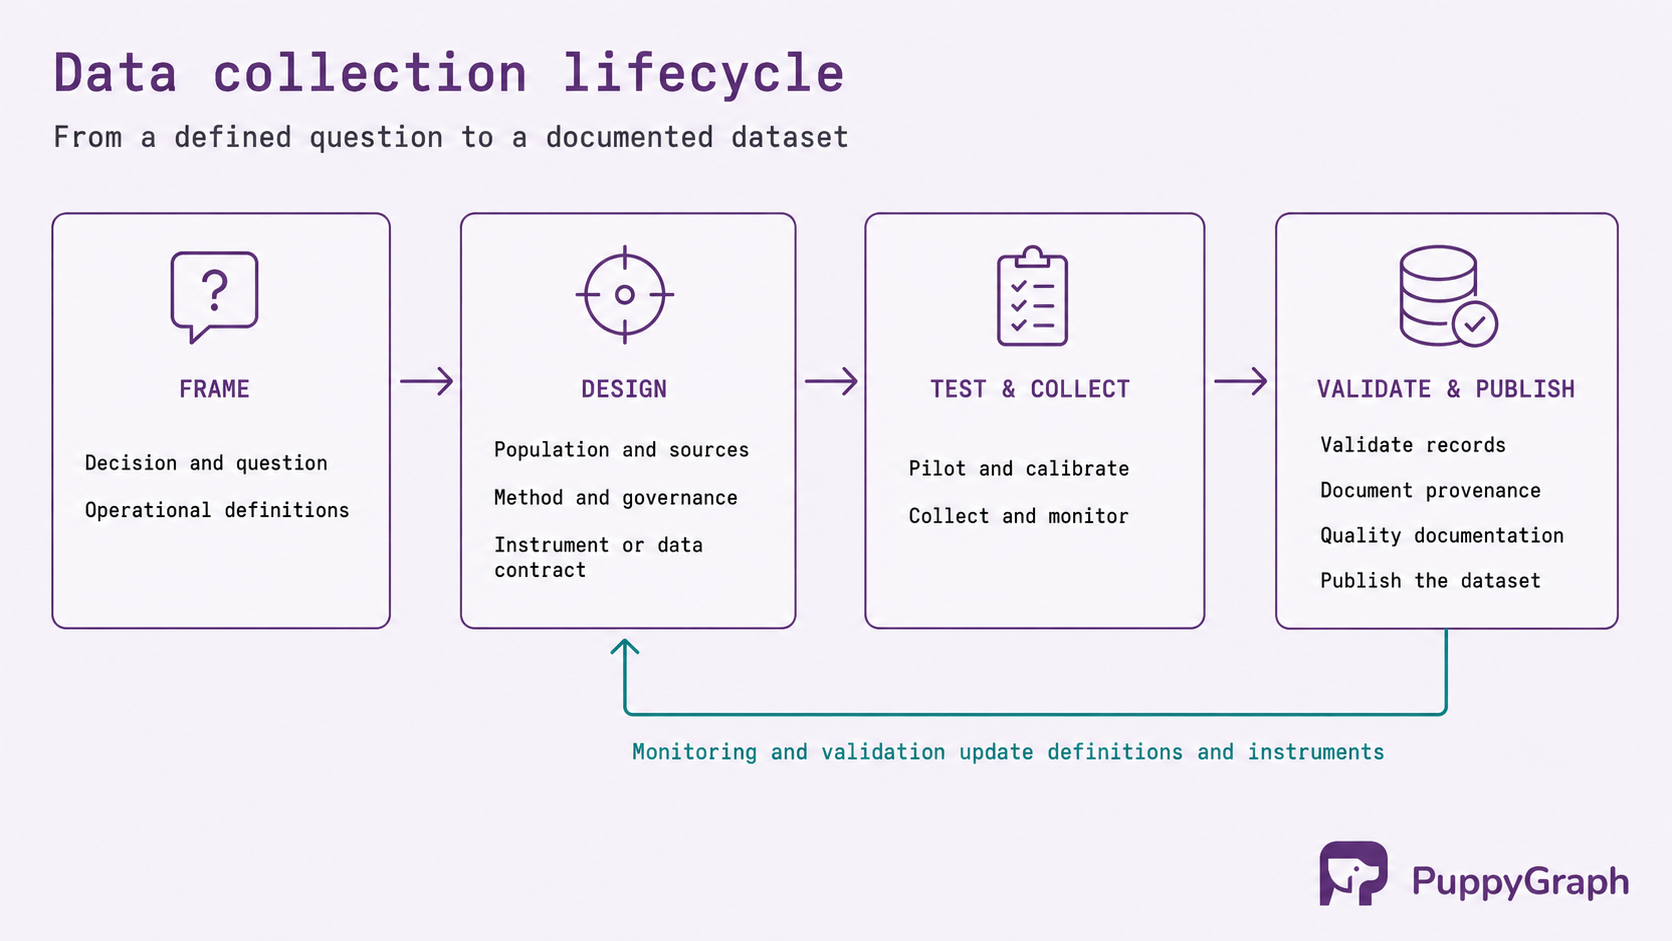
Collection conditions change. Application redesigns alter event paths, new customer segments change the observed population, and sensors drift while emitting valid-looking readings. Versioned definitions and monitoring keep the dataset interpretable.
Types of data collection
Data collection can be classified along several independent dimensions. A project can be quantitative, longitudinal, and automated at the same time, so these labels describe different design choices rather than exclusive categories.
Quantitative collection records numeric measurements or coded categories that support counts, comparisons, statistical estimates, and models. Examples include transaction amounts, response scales, click events, and temperature readings. The categories still require definitions. Turning an interview response into a numeric code does not remove interpretive judgment.
Qualitative collection records language, images, observations, or artifacts to understand meaning, context, and process. Interviews, open-text responses, field notes, and document collections can explain why a pattern occurs or reveal concepts that a fixed questionnaire did not anticipate. Analysis is systematic, but its outputs are not limited to numerical estimates.
Mixed-method collection combines both. A product team might analyze funnel events, survey users at exit points, and interview a smaller sample. The event data shows where behavior changes, while qualitative evidence helps explain why. The methods need a shared question and sampling plan.
Cross-sectional collection captures a population or system during a defined period. It is useful for prevalence, comparison, or a current-state baseline. Longitudinal collection follows the same units or repeated samples over time to measure change. Continuous operational streams are a longitudinal form, but their high frequency does not guarantee that the same entities remain observable throughout.
The right type follows the inferential need. Quantitative telemetry cannot explain every motive, while an interview sample cannot estimate population frequency without an appropriate design. Combining types can strengthen a study when each source has a defined role.
Data collection methods
Methods determine how observations enter the dataset. Most production programs use several and reconcile them through common identifiers, definitions, and time boundaries.
Methods that collect evidence directly from people provide self-reported attitudes, explanations, and group discussion.
Surveys and questionnaires. Respondents answer standardized questions on the web, by mail, by phone, or in person. Surveys scale to large populations and support consistent coding, but wording, question order, response options, channel, sampling, and nonresponse all affect results. The U.S. Census Bureau describes internet, mail, telephone, and in-person response modes, showing that available options vary by survey.
Interviews and focus groups. Structured interviews apply consistent questions, while semi-structured interviews can follow relevant details. Focus groups reveal how participants discuss a topic together. These methods require careful recruitment, facilitation, and coding.
Methods that observe behavior or vary conditions record what happens instead of relying only on recall.
Observation. Researchers or operators record behavior, events, or conditions in their setting. Observation can reveal what people do rather than what they recall doing. A protocol should define what counts as an event, how observers record it, and how their presence or judgment may affect the result.
Experiments. An experiment assigns or varies a treatment and compares outcomes under a prespecified design. Randomization can support causal inference, but implementation failures, attrition, spillovers, and multiple testing can weaken the result. Define the assignment unit, outcome, stopping rule, and analysis plan in advance.
Automated methods capture physical and software activity as it occurs.
Sensors and instruments. Physical devices measure temperature, vibration, position, pressure, images, or other signals. Collection software must retain units, sampling frequency, device identity, calibration, location, and status. A precise timestamp from an uncalibrated sensor is still an unreliable measurement.
Transactions and application telemetry. Operational systems create orders, payments, state changes, audit records, and user events. Observability instrumentation captures software behavior. OpenTelemetry currently supports traces, metrics, logs, and baggage; baggage carries contextual information between the other signals. Event naming, cardinality, retries, clock behavior, and identity resolution need explicit rules if those records will support analysis.
Existing-source methods acquire records created for an earlier operational, regulatory, or research purpose.
Records, documents, APIs, and data exports. Teams can acquire administrative records, public filings, partner feeds, research datasets, documents, or permitted web data. Preserve source terms, retrieval time, version, query parameters, coverage, and usage restrictions. An API makes access convenient but does not establish fitness for a new purpose.
Method choice follows the question, population, and errors the analysis can tolerate. Teams often combine methods because each observes a different part of the problem, but the sources need compatible identities, definitions, and time boundaries before their evidence can be interpreted together.
Primary vs secondary data collection
Primary and secondary describe a dataset's relationship to the current purpose. Primary data is collected firsthand for the present question. Secondary data already exists because someone collected it for another operational, regulatory, or research purpose. The same record can be primary for its creator and secondary for a later analyst.
A team studying checkout friction might collect primary session events and interviews, then supplement them with secondary support tickets. The tickets provide useful language and failure examples, but their frequency does not estimate prevalence because only some customers contact support.
Public data is a common secondary source. The SEC's EDGAR data APIs provide JSON-formatted submissions history by filer and extracted XBRL data from financial statements. An analyst can acquire those records without conducting the original collection, but still needs to account for filing periods, taxonomies, company-specific extensions, amendments, and the SEC's access policies.
Review secondary data's original purpose, population, definitions, dates, missingness, transformations, update policy, rights, and known breaks. Combining primary and secondary sources is efficient when the final dataset preserves which source supplied each fact.
Structured vs unstructured data collection
Structure describes how a record's meaning is represented, not whether the underlying subject is orderly. Collection systems usually handle three shapes.
Structured data conforms to a declared schema of fields, types, and relationships. Point-of-sale transactions, sensor readings, survey choice codes, and database change events can arrive as rows with stable identifiers and constraints. This shape is efficient for validation and SQL analysis, but a rigid schema can silently lose facts if the collector discards responses or events that do not fit.
Semi-structured data carries labels and hierarchy without requiring every record to share the same fields. JSON API responses, nested application events, XML forms, and many log formats fit here. Schema evolution is easier, but producers and consumers still need contracts for required fields, versions, timestamp meanings, and nested structures.
Unstructured data lacks a predefined field model for its content. Interview audio, free-text notes, PDFs, images, and video preserve detail that fixed columns cannot express. Transcription, optical character recognition, extraction, annotation, and embedding create derived representations that should remain linked to the source and the model or reviewer that produced them.
Structured records can satisfy types while carrying the wrong definition. Semi-structured events can drift field by field. Unstructured collections can lack usable labels, permissions, or coverage. Store identifiers, timestamps, provenance, access terms, and collection context alongside all three.
For AI, volume alone is a weak target. NIST's AI RMF playbook recommends examining representativeness, data quality, and sourcing and documenting collection and labeling methods. Version training, evaluation, retrieval, and feedback datasets separately to detect leakage and distribution changes.
These data shapes often converge in analytical systems, where native structured records join metadata and entities derived from semi-structured or unstructured inputs. Once those records land in SQL databases, data warehouses, or data lakes and lakehouses, relationship analysis may need to connect customers, devices, events, documents, and accounts across sources. PuppyGraph lets teams define those records as nodes and their known relationships as edges over existing tables. openCypher and Gremlin queries can then traverse the connected data without graph-specific ETL or a separate graph store. PuppyGraph starts with the structured representation the organization has chosen to persist; collection systems still own capture, consent, and source quality.
Data collection examples
Concrete examples show how the question, method, and data shape determine one another.
Product onboarding analysis. A software team defines events for workspace creation, invitation, first data import, failed import, and first successful query. Each event includes a stable account identifier, user role, client and server timestamps, schema version, and relevant result code. A short survey appears after an abandoned import, and a sampled set of users joins interviews. Telemetry measures the path, while responses provide explanations the event stream cannot contain.
Predictive maintenance. A manufacturer collects vibration and temperature at a defined frequency from identified machines, along with calibration and device-health records. Maintenance work orders and component replacements provide outcome labels. The team preserves operating regime, load, and location because a reading that is anomalous for one machine state may be normal for another. A pilot tests whether the sensors capture precursors early enough to change maintenance decisions.
Public-health case surveillance. Healthcare providers and laboratories report qualifying cases to public-health authorities under applicable rules, and authorities use standard case definitions to assemble comparable records. The CDC's description of case surveillance shows how demographic, clinical, epidemiological, and geographic information supports outbreak detection and response. The example also shows why collection is a governed network of definitions and reporting responsibilities, not just a transfer into a central database.
Across these examples, the method serves a specific decision. Each program preserves context that a later user would otherwise have to guess: population, identity, time, instrument, definitions, provenance, and limits.
Conclusion
Data collection is the design and execution of a measurement process. It translates a decision into observable variables, a defined population, appropriate methods, governance, a tested instrument, and monitored evidence. Each method answers different questions and introduces different errors.
High-quality collection is fit for purpose, not merely large or technically complete. Primary data offers control for a current question, while secondary data offers speed when its original meaning and limitations are understood. Structured, semi-structured, and unstructured inputs require different tools, but all need identifiers, provenance, definitions, and quality evidence. Those controls give analytics and AI systems a defensible account of what the data represents.
Try the forever-free PuppyGraph Developer Edition and book a demo with the team to see how openCypher and Gremlin queries connect collected records across warehouse and lakehouse tables, with no graph-specific ETL, while source systems retain ownership of collection and governance.

Hao Wu is a Software Engineer with a strong foundation in computer science and algorithms. He earned his Bachelor’s degree in Computer Science from Fudan University and a Master’s degree from George Washington University, where he focused on graph databases.


