

Predictive Analytics Models: Types, Examples & Uses
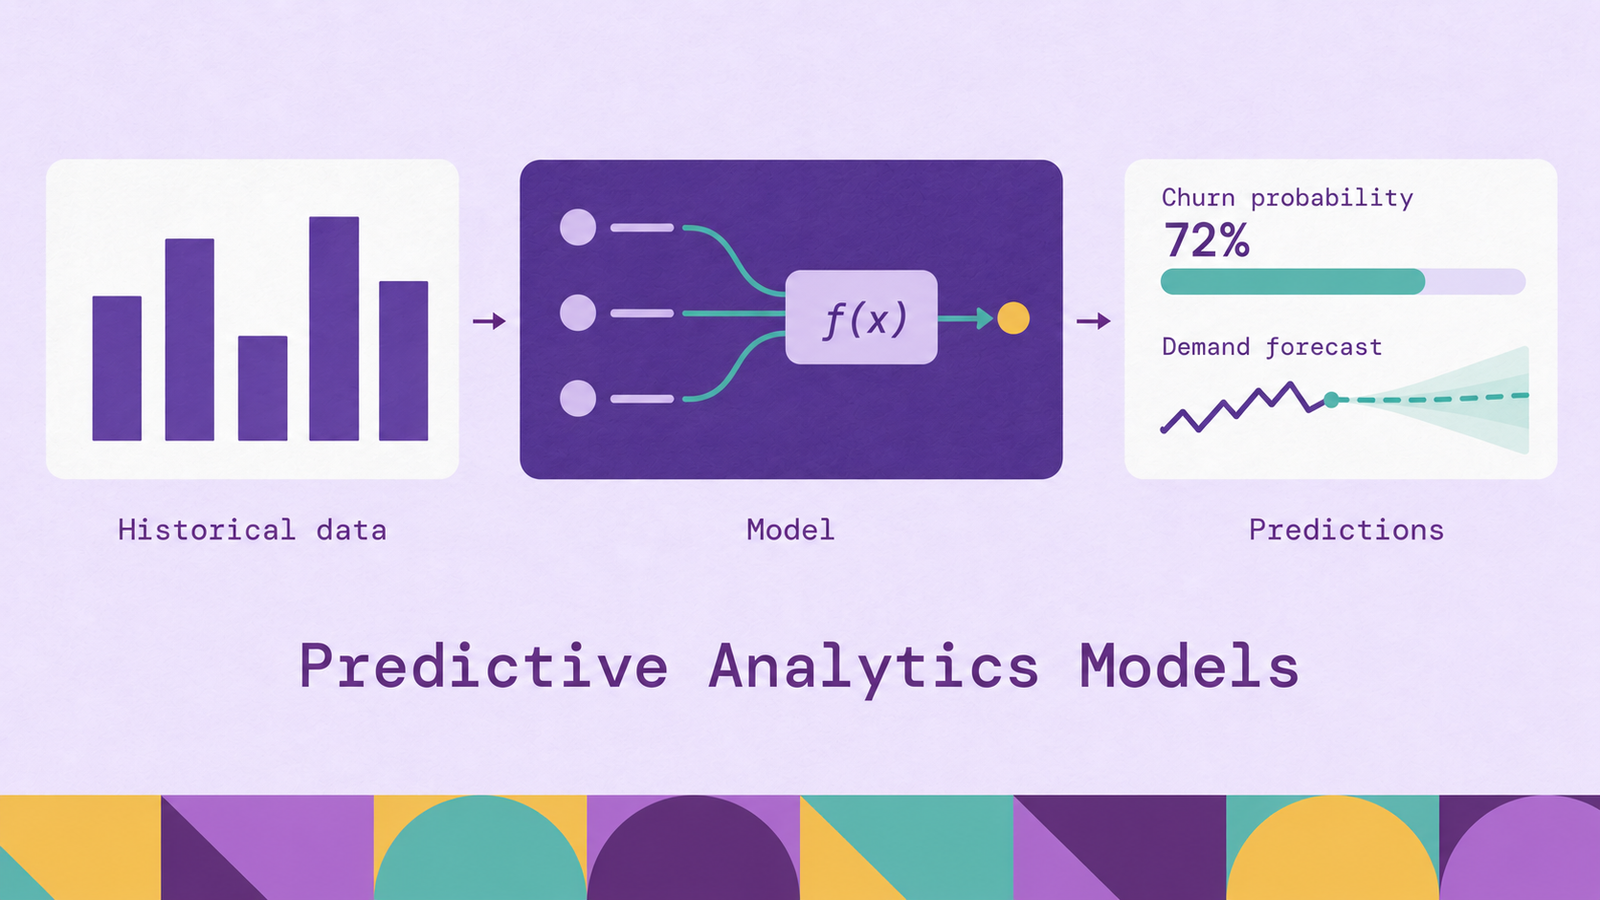
Choosing a predictive analytics model starts with the decision its output will support. Estimating next month's demand, identifying accounts likely to cancel, and prioritizing unusual transactions require different targets, evaluation methods, and operational responses. An algorithm's name tells you only part of what you need to know.
This article explains how predictive analytics models work, distinguishes the main prediction tasks from the algorithms used to solve them, and shows how to choose and evaluate a model against a business need.
What are predictive analytics models?
Predictive analytics models use patterns in observed data to estimate an unknown outcome. That outcome might be a future quantity, such as next week's order volume, or a condition whose label is not yet known, such as whether a transaction is fraudulent. Outputs can include numerical estimates, category probabilities, and forecasts with uncertainty intervals.
In supervised learning, a model learns from examples that pair inputs, called features, with a known outcome, called the target. For a subscription business, features might include account tenure, recent product usage, and unresolved support cases. The target could be whether the account cancels within the following 30 days. That time horizon is part of the model's definition: predicting cancellation tomorrow and predicting it next year are different tasks.
Predictive analytics also uses unsupervised techniques, such as clustering and anomaly detection, to discover structure or unusual observations without outcome labels. These techniques can support a prediction workflow, but identifying a customer segment does not by itself predict whether its members will cancel.
A useful model produces estimates that hold up on new data. Its business value then depends on whether someone can take a useful action from those estimates. A churn score may help prioritize outreach, but it does not establish that a particular discount will prevent cancellation.
How do predictive analytics models work?
A predictive workflow connects a defined target to historical examples, a fitted model, and a decision process. Consider a team that scores active subscriptions each Monday for cancellation risk over the next 30 days.
Define the observation and outcome. Each example represents an account at a particular scoring date. The outcome records whether it cancels during the following 30 days. A cancellation observed within 30 days establishes a positive label; a non-cancellation label requires complete follow-up through the 30-day window.
Build features available at scoring time. The team aggregates usage and support activity recorded before each Monday. A cancellation reason entered afterward cannot become an input. Using information unavailable at prediction time creates data leakage, which can inflate evaluation results. The scikit-learn guidance on leakage also recommends learning preprocessing steps, such as imputation and scaling, from training data only.
Train and validate the model. Training adjusts model parameters to reduce a chosen loss, a measure of prediction error. Validation data helps select algorithms, settings, and decision thresholds. A separate test set estimates performance after those choices are fixed. For this forward-looking deployment, evaluate on later periods and ensure training labels would already have been available at each simulated scoring date. The scikit-learn cross-validation guide explains why time-dependent and grouped observations need split strategies suited to their structure.
Connect predictions to action. A model might output cancellation probabilities, while the business process selects the highest-risk accounts that the support team has capacity to contact. The score and the action rule are separate: the same model can support different workloads by changing the threshold or queue size.
Monitor the deployed workflow. Track missing inputs, score distributions, operational failures, and prediction quality once outcomes arrive. For the 30-day churn target, outcome-based evaluation necessarily lags scoring. Compare later performance with the original validation results before deciding whether to retrain or change the intervention.
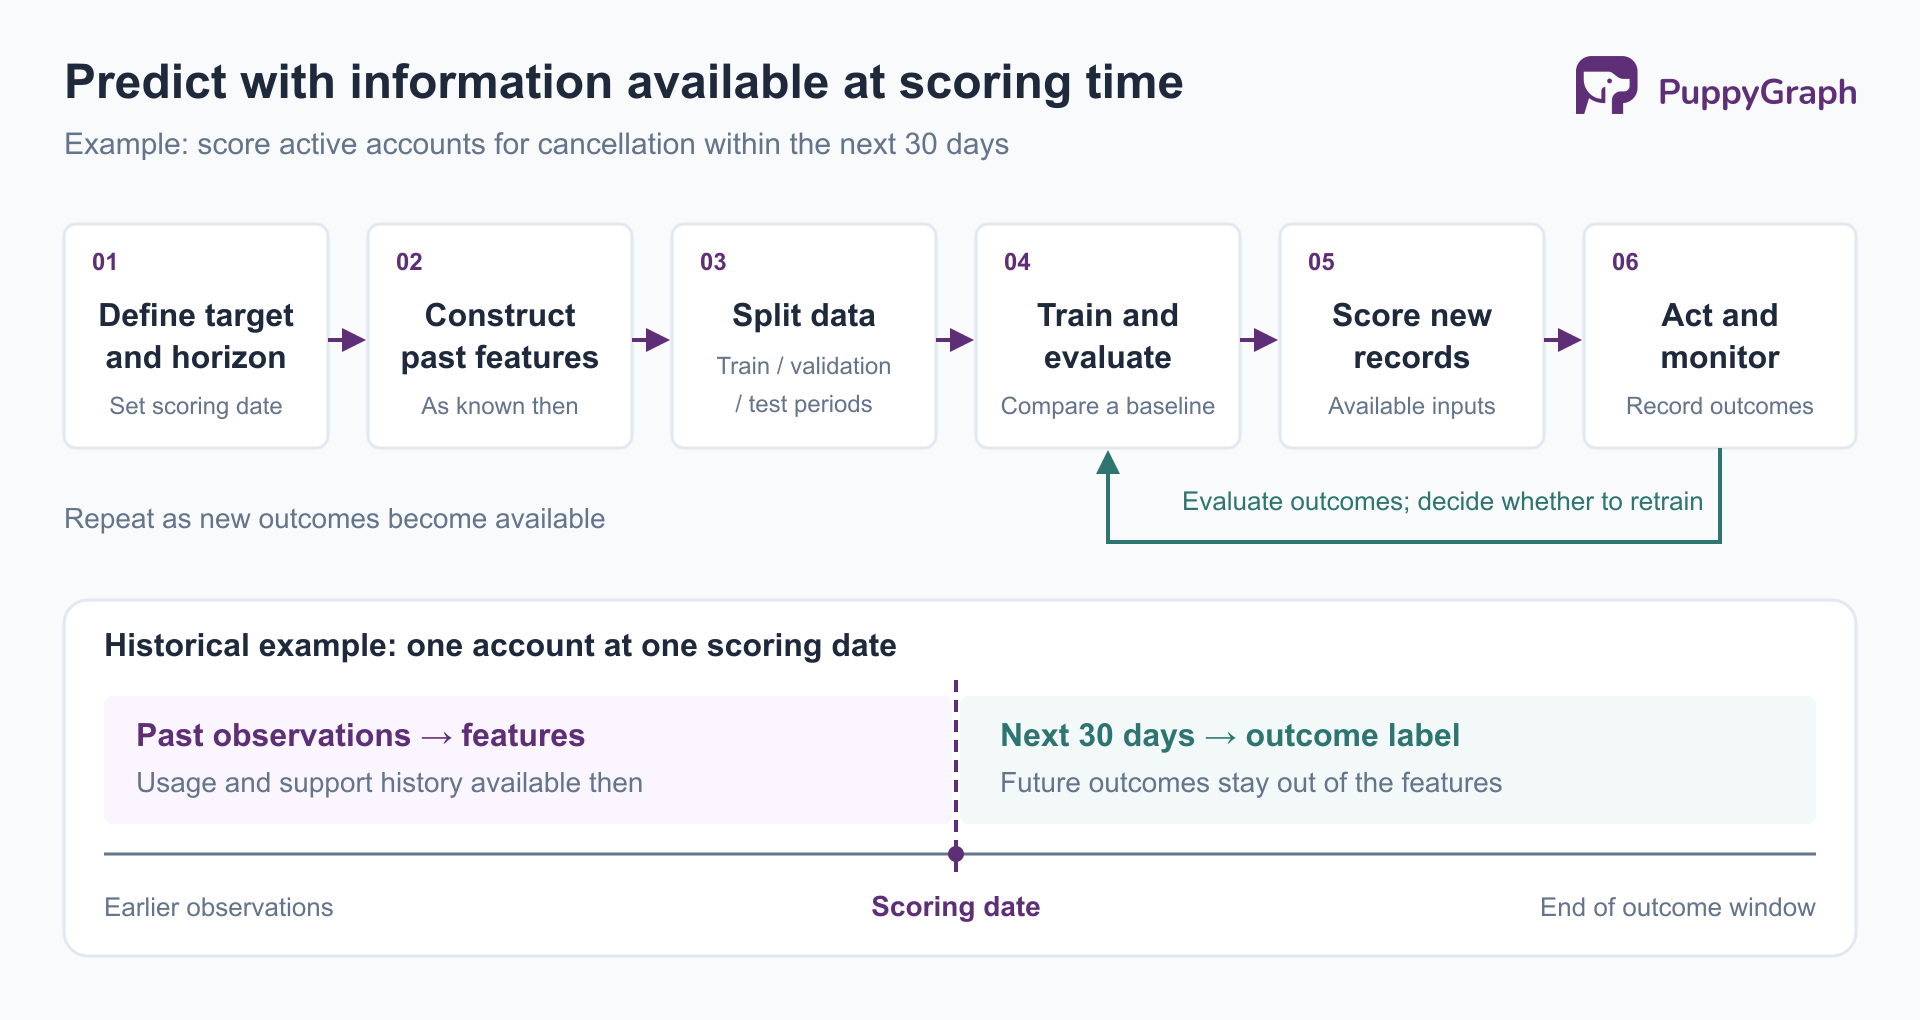
The central requirement is consistency between historical evaluation and actual use. A model tested with richer information, cleaner inputs, or a different prediction horizon than deployment will receive has not been tested for the job it must do.
What are the main types of predictive analytics models?
Model lists often mix tasks with algorithms. Regression, classification, and time-series forecasting describe what is being estimated. Decision trees, random forests, and neural networks describe ways to learn the mapping from inputs to outputs. One algorithm family can support several tasks.
Clustering and anomaly detection belong in the broader analytics toolkit, but their outputs need careful interpretation. A cluster is not an outcome label, and an anomaly score is not automatically a probability of fraud.
Regression models. Regression estimates numerical outcomes. Linear regression expresses a prediction as an intercept plus a weighted combination of features. Ridge regression adds a penalty on coefficient size, which can help when inputs are strongly correlated. These are useful candidates when a compact model is valuable, but nonlinear relationships may require transformed features or another model family. The scikit-learn linear model documentation describes both formulations.
Classification models. Classification estimates membership in categories, such as cancellation versus renewal. Despite its name, logistic regression is a classification method; in the binary case, it transforms a linear feature score into a probability between zero and one. That probability can feed a decision threshold, but its reliability still needs evaluation on held-out data. An illustrative application is ranking accounts for retention review based on usage and service history.
Decision trees and ensembles. A decision tree divides observations through successive feature-based conditions. Random forests combine randomized trees, while gradient boosting adds models sequentially to improve a chosen loss. Both families support regression and classification. They are candidates for tabular problems involving nonlinear relationships and feature interactions, such as delivery duration depending jointly on route, service level, and departure time. Combining many trees complicates explanation compared with inspecting a small individual tree. The scikit-learn ensemble guide explains their mechanisms and trade-offs.
Time-series forecasting models. Forecasting preserves the order and spacing of observations and specifies how far ahead predictions must extend. Common approaches include exponential smoothing and ARIMA, alongside regression and machine-learning methods built from lagged observations and other inputs. Trend and seasonal structure matter: a retailer planning weekly inventory needs to account for recurring demand patterns. Forecasting: Principles and Practice shows how decomposition separates seasonal structure from the remaining series for forecasting. Future inputs also need scrutiny: planned promotions may be known, while future realized sales are not.
Neural networks. Neural networks learn transformations through connected layers and can support both regression and classification. Their nonlinear representations can capture complex relationships, but training introduces choices about architecture, optimization, and regularization. The scikit-learn neural network guide documents these trade-offs for multilayer perceptrons, including sensitivity to feature scaling and hyperparameters. Include a neural network when the data representation and validation results justify its additional complexity.
Unsupervised methods provide a different kind of output.
Clustering and anomaly detection. Clustering groups observations by a chosen similarity criterion. For example, k-means assigns observations to clusters around learned centers. A subscription business might use the resulting segments to investigate different usage patterns or create candidate features for a supervised model. Anomaly detection instead identifies observations that depart from learned patterns. Unusual transaction behavior can motivate investigation, but confirming fraud requires evidence beyond unusualness.
The choice between these methods follows from the output you need and the evidence you have. If reliable fraud labels exist, supervised classification can learn from confirmed outcomes. Without them, anomaly detection may offer a starting point for review, with a different meaning and evaluation burden.
How to choose the right predictive analytics model
Start by writing down the prediction unit, target, horizon, and intended action. “Predict churn” is incomplete. “Score active accounts weekly for cancellation within 30 days so a support team can prioritize outreach” defines a workflow that can be tested.
Match the metric to the decision. For numerical predictions, mean absolute error expresses average error in the target's units, while root mean squared error penalizes larger errors more strongly. For classification, precision measures how many flagged cases are positive, and recall measures how many actual positives are found. The scikit-learn evaluation guide documents these metrics. Choose the threshold using validation data and the consequences of mistakes. If a team can review only a fixed queue, measure the quality of that queue.
Establish a baseline under realistic validation. Compare candidates with a simple reference: a historical average, logistic regression, or a seasonal forecast that repeats the corresponding prior season. For forecasting, use successive historical cutoffs and evaluate the horizon the business actually plans around. Time-series cross-validation formalizes this rolling evaluation. A model that improves one-step forecasts may not improve forecasts several periods ahead.
Check operational fit and failure modes. Evaluate scoring latency, feature availability, maintenance effort, and explanation requirements alongside predictive quality. Inspect errors across relevant account groups, locations, or demand conditions. Define a fallback for missing inputs or failed scoring. A small validation improvement may not justify a model whose inputs cannot arrive before the decision deadline.
Test whether relationship features add information. Some outcomes depend on connections among entities. For an illustrative transaction classifier, candidate features could include the number of accounts sharing a device or the number of counterparties reached within two transfers. Compare a model using ordinary account attributes with one that adds these features, using the same evaluation periods. Construct historical relationships and any known-risk labels using only information available at each scoring date.
PuppyGraph lets teams query those relationships over existing SQL databases, warehouses, and lakehouses without first loading the source data into a separate graph database. Its graph schema maps tables to entities and relationships, such as accounts, devices, and transfers. Teams can use openCypher and Gremlin queries to extract relationship features for a downstream predictive workflow. Model training, evaluation, and scoring remain steps in that workflow; querying a graph supplies inputs to test. Historical feature construction still requires source data that preserves what was known at the relevant time.
Benefits of predictive analytics models
Predictive analytics can improve planning and prioritization when predictions arrive early enough to change a decision. The relevant benefit is the resulting operational improvement, measured against the existing process.
More informed resource planning. Demand forecasts give inventory and staffing teams an explicit estimate to plan around. Evaluating uncertainty as well as point predictions helps teams decide how much flexibility to retain. The model's value should be assessed through outcomes such as stock availability, unused capacity, and service levels.
Focused review and outreach. Classification scores can rank work for teams with limited capacity. In transaction review, evaluate confirmed cases found within the available queue. In retention work, separately test whether outreach changes cancellation outcomes; finding high-risk accounts alone does not show that contacting them helps.
Earlier opportunities to respond. A prediction tied to a useful horizon can create time for intervention. An estimated late delivery may justify notifying a customer or reviewing routing before the promised arrival time. Measure whether the warning arrives early enough and is reliable enough to support that response.
A repeatable basis for learning. Recorded predictions, actions, and observed outcomes allow teams to compare model revisions with prior behavior. This requires consistent logging and a way to distinguish prediction quality from the effects of decisions taken because of the prediction.
These benefits are conditional on the complete workflow. Reliable inputs, realistic evaluation, and a clear response determine whether a score becomes useful operational evidence.
Conclusion
Predictive analytics models estimate outcomes that support concrete decisions. Choose the task first, compare suitable algorithms against a baseline, and evaluate with the information and time horizon deployment will actually allow. Treat clustering and anomaly detection according to what their outputs mean, and test whether additional features improve results before adding complexity.
Try the forever-free PuppyGraph Developer Edition and book a demo with the team to see how openCypher and Gremlin queries extract relationship features from warehouse and lakehouse tables, with no graph-specific ETL, for evaluation in your predictive models.

Hao Wu is a Software Engineer with a strong foundation in computer science and algorithms. He earned his Bachelor’s degree in Computer Science from Fudan University and a Master’s degree from George Washington University, where he focused on graph databases.


