

Supervised vs Unsupervised Learning: Key Differences
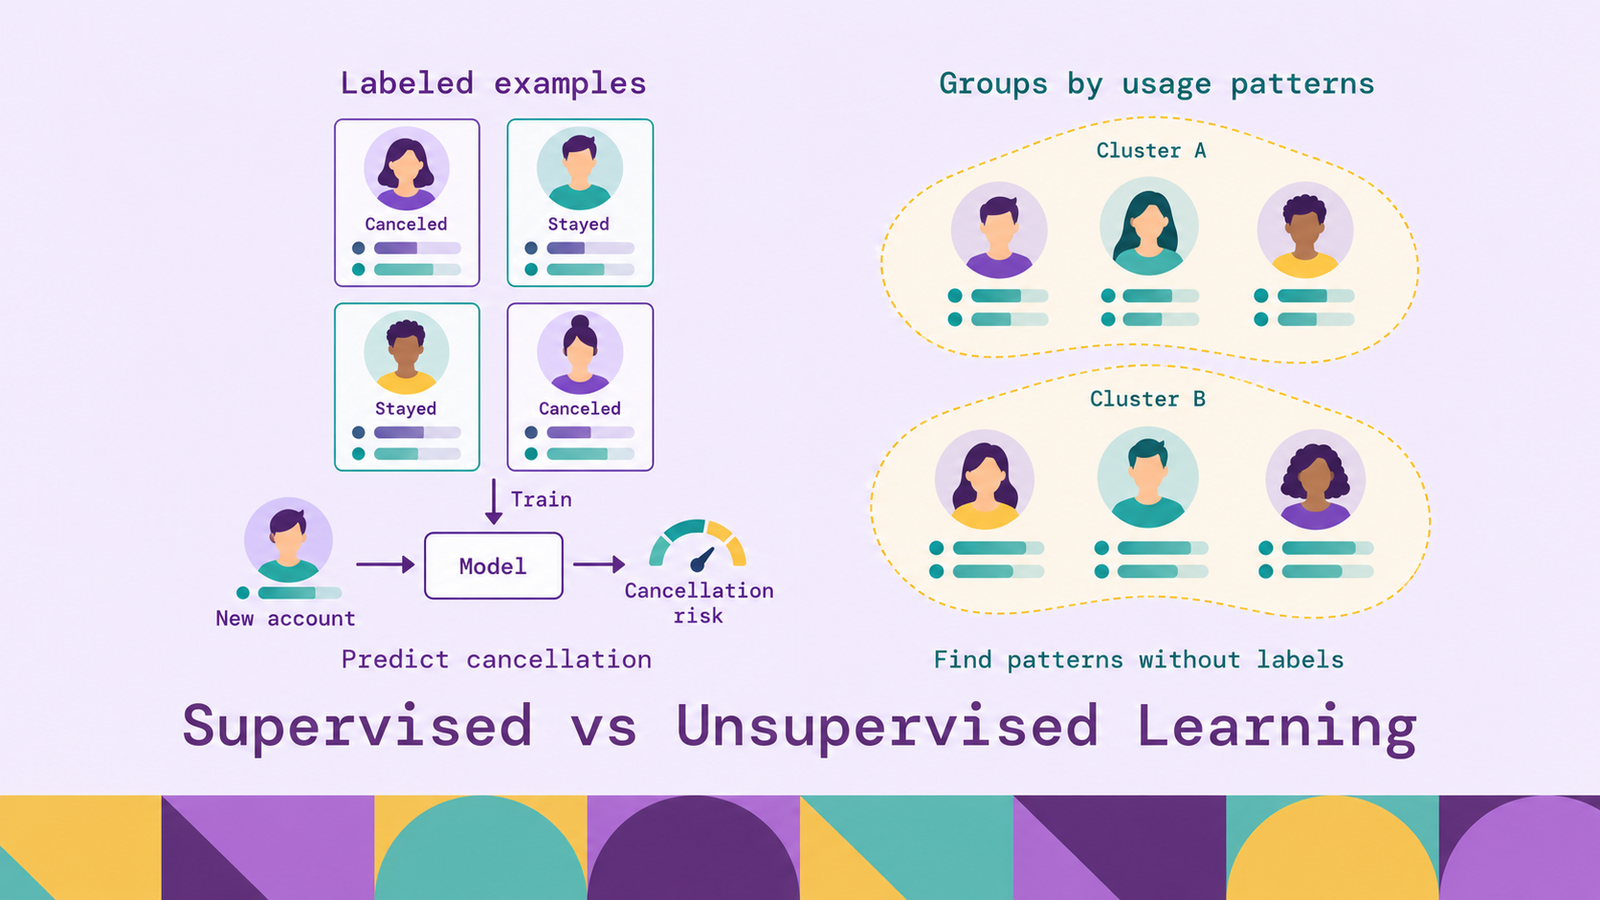
Choosing between supervised and unsupervised learning starts with the result you need. Predicting whether an account will cancel requires evidence about past cancellations. Grouping accounts by how they use a product requires a useful definition of similarity. Both tasks can use the same activity data, but they answer different questions and need different tests of success.
This guide explains how each approach works, compares their algorithms and trade-offs, and shows when to choose each. The central decision is whether you have a defined outcome to predict or a pattern to investigate.
What is supervised learning?
Supervised learning learns a relationship between input features and a known target from labeled examples. Features describe an observation; the target is the answer the model should learn to predict. In a subscription dataset, features might include account tenure and recent usage, while the target records whether the account canceled within the following month. Google's introduction to supervised learning describes this progression from labeled training examples to predictions on unseen inputs.
Training uses those input-target pairs to fit a model. Many supervised algorithms minimize a loss function that measures disagreement between predictions and targets. At inference time, the fitted model receives features for a new observation and estimates its unknown target. Labels guide training; they are not required as inputs when making a prediction.
Classification predicts a category, such as whether a support ticket concerns billing or account access. Depending on the model, the output may include class probabilities or scores that a decision rule converts into a category.
Regression predicts a numerical value, such as delivery duration or next month's account spending. A continuous target is still a label in supervised learning; labels do not have to be category names or manually written annotations.
Common supervised algorithm families include linear models, decision trees, ensembles, support vector machines, and neural networks. Linear regression models a numerical target as a weighted combination of features. Logistic regression, despite its name, is used for classification. Decision trees split observations using feature conditions; random forests combine multiple trees. Tree and neural network methods have both classification and regression variants.
The main benefit is a direct evaluation target: predictions can be compared with observed outcomes. The constraint is the evidence behind that target. Consider a ticket-routing model trained on historical team assignments. If staff routinely routed difficult tickets to the wrong queue, learning those assignments may reproduce the routing problem. A well-defined label is useful only when it represents the decision you actually want to improve.
What is unsupervised learning?
Unsupervised learning finds structure in input data without using supplied target labels to guide the fit. The data can be structured tables with meaningful column names. What is missing is an outcome attached to each training example, such as a verified customer segment or fraud verdict.
The practitioner still chooses the features, preprocessing, algorithm, and objective. Those choices determine which patterns the method can find. For an account-usage dataset, grouping by login frequency and grouping by the mix of features used may produce different, equally valid views of the customer base.
Clustering groups similar observations. K-means assigns observations to a chosen number of clusters and minimizes squared distances to their centers. It suits compact groups under that distance measure. DBSCAN instead identifies dense regions and can mark observations outside those regions as noise. Its results depend on density parameters and the distance representation.
Dimensionality reduction produces a smaller representation of the input. Principal component analysis (PCA) finds orthogonal directions of maximum variance and projects data onto selected components. It can summarize correlated measurements, but high variance does not necessarily mean high relevance to a later prediction task. Reducing dimensions can discard useful predictive information.
Anomaly detection identifies observations that depart from the patterns a method captures. Isolation Forest, for example, uses random partitions to isolate observations; unusual points tend to require shorter isolation paths. A flagged transaction merits investigation, but unusualness alone does not establish fraud. Anomaly detection can also use labeled training data in other settings, so the task itself is not exclusively unsupervised.
The benefit is the ability to explore data before reliable outcome labels exist. The limitation is interpretation: a cluster identifier has no business meaning until someone examines its members. An account group with infrequent logins could represent dissatisfied customers, seasonal users, or customers who use an API instead of the interface. The algorithm's output supplies a starting point for that investigation.
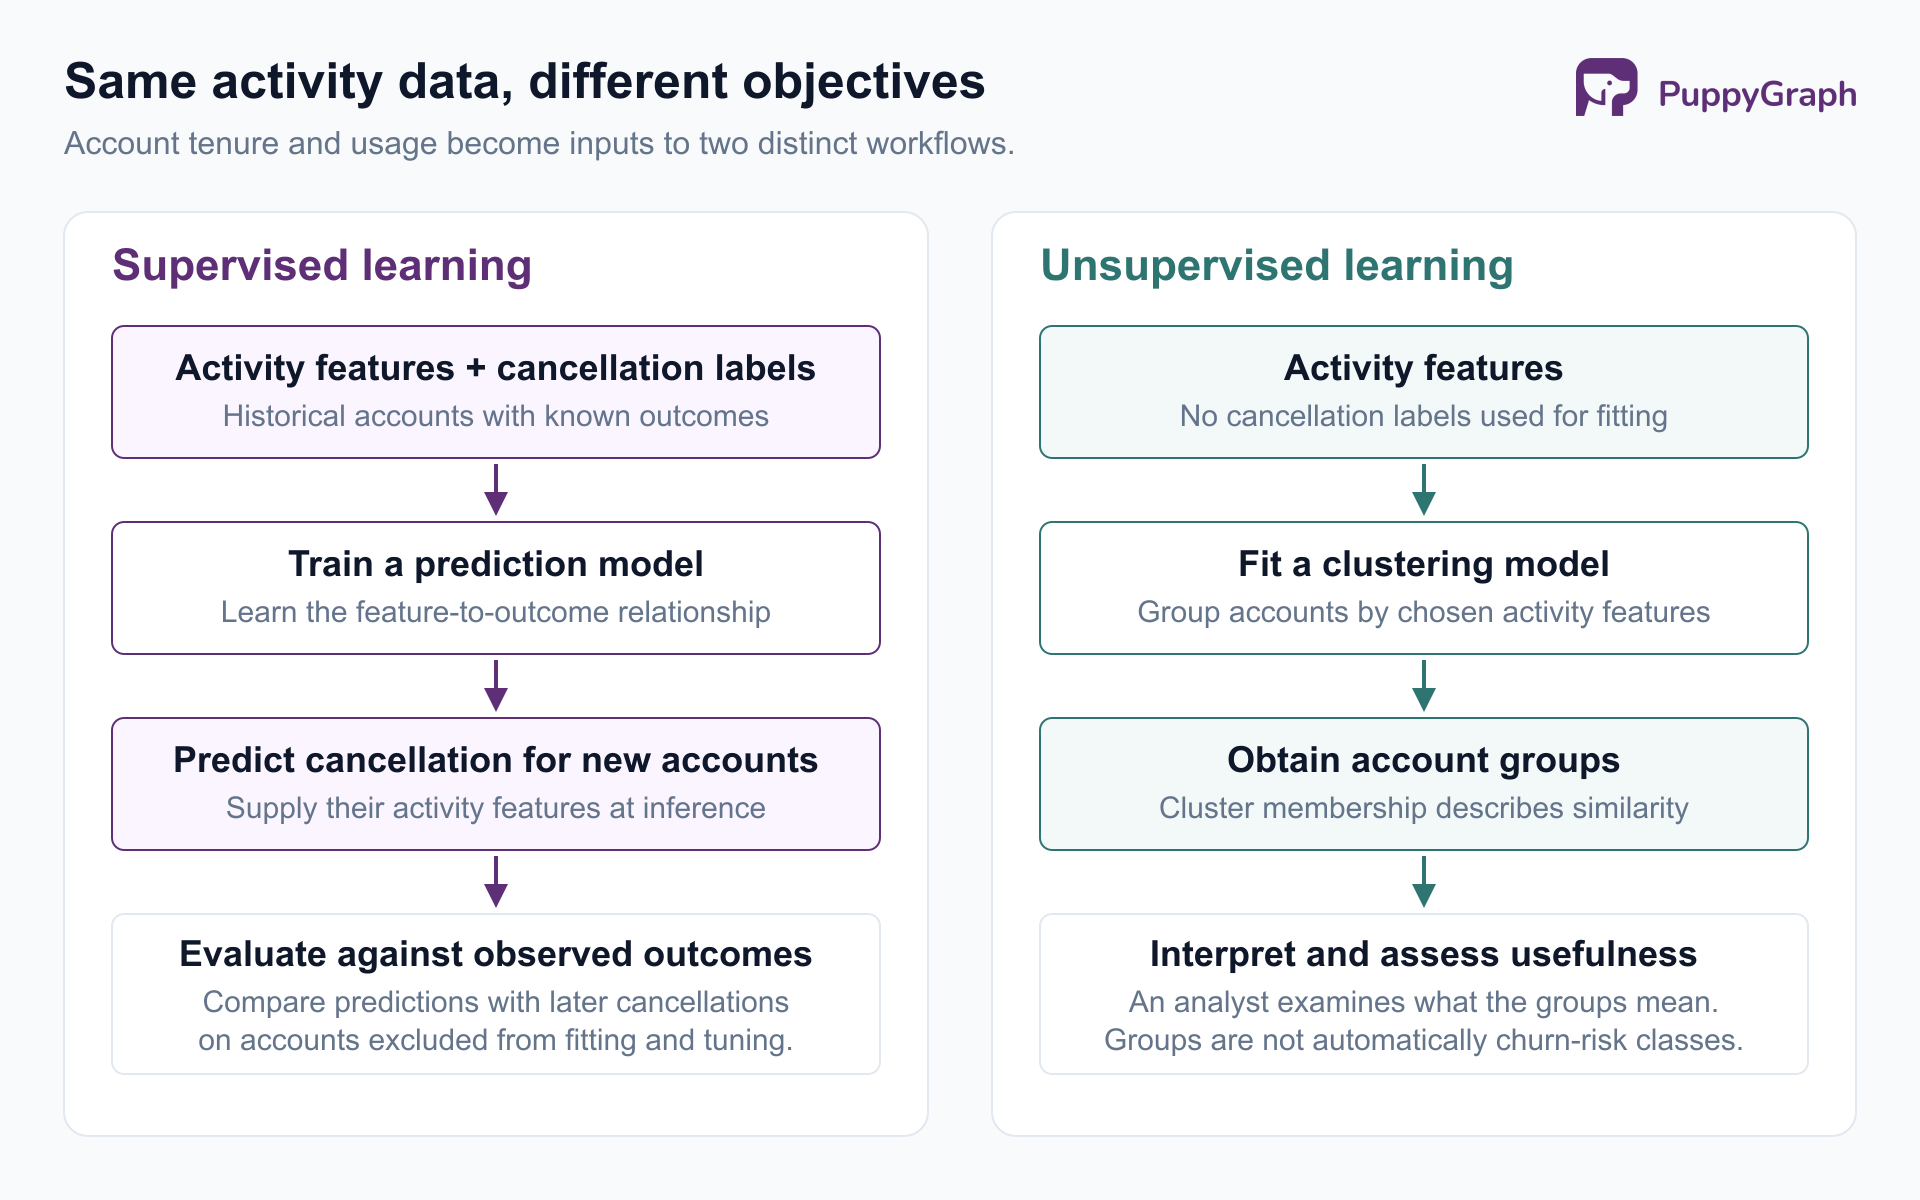
Supervised vs unsupervised learning: key differences
The distinction concerns the learning objective and the evidence used to fit the model. It does not by itself determine whether the input is tabular, textual, or image data, or whether the resulting system is simple or computationally expensive.
These outputs are not interchangeable. A customer cluster cannot establish cancellation probability merely because some members appear disengaged. Equally, a cancellation classifier does not explain every meaningful difference between customer groups. Choose the output that supports the next action, then evaluate whether it does so reliably.
When to choose supervised
Choose supervised learning when the target is clear, historical outcomes are available, and future predictions will support a defined decision. For a delivery estimate, specify whether the target is time to dispatch or time to arrival. For cancellation prediction, specify the prediction date and the future observation window. These definitions determine which examples belong in training and when a label is complete.
Use classification for repeatable category decisions. Ticket routing, document categorization, and classification of transactions using confirmed fraud outcomes are suitable examples. Check how labels were collected. If only previously flagged transactions received investigation, the resulting training set may leave ordinary-looking transactions poorly represented. For evaluation, precision measures the proportion of predicted positive cases that are actually positive. Recall measures the proportion of actual positive cases the model finds. Both are defined in scikit-learn's classification metrics guide.
Use regression for numerical estimates. Delivery duration, demand, and account spending are examples where observed values supply targets. Select a metric that reflects the consequence of an error. Mean absolute error expresses average absolute deviation in the target's units; squared-error measures place greater weight on large errors. These distinctions are covered in scikit-learn's model evaluation guide.
Validate against the intended deployment. Separate model fitting and tuning from final evaluation. For predictions about future events, evaluate on later observations. When the goal is generalization to unseen customers, keep customers separate across training and evaluation. Scikit-learn's cross-validation guide explains why time-dependent and grouped data require appropriate splitting strategies.
Prevent information leakage throughout the workflow. A cancellation model must not use a closure reason written after cancellation. Fit learned preprocessing, including scaling and dimensionality reduction, only on training data before applying it to held-out data. Otherwise, evaluation can benefit from information the deployed system would not have. The scikit-learn leakage guidance applies to preprocessing as well as the final estimator.
Supervised learning is a strong fit when you can state both the desired prediction and a credible test of it. If obtaining trustworthy labels is the main obstacle, address that obstacle explicitly. Clustering may help investigate the data, but it does not supply verified outcomes by itself.
When to choose unsupervised learning
Choose unsupervised learning when the immediate goal is exploration, representation, or identifying unusual observations, and labeled outcomes are unavailable or unnecessary for that goal. Define what someone will do with the result before selecting the algorithm.
Explore customer behavior. Cluster accounts by product usage to identify patterns worth interviewing customers about or testing in onboarding. Choose features that match the question. If you want to understand feature adoption, raw account spending may separate customers primarily by size and obscure the behavior of interest.
Prioritize unfamiliar activity for review. Anomaly detection can surface unusual transaction or system behavior without requiring a catalog of confirmed incidents. Plan for benign exceptions, such as a customer's first large purchase or a scheduled maintenance event. Review outcomes can help establish whether the alerts are useful and may later support a supervised task.
Simplify a feature representation. Dimensionality reduction can support exploration or become a preprocessing stage in a supervised pipeline. Evaluate the full pipeline against its final objective. A compact representation that explains substantial input variance can still remove the signal needed to predict a rare outcome.
Evaluation needs several forms of evidence. For clustering, the silhouette coefficient measures cohesion and separation under the chosen distance metric. It does not establish that groups represent useful market segments. Also inspect representative members, check sensitivity to reasonable feature choices, and test whether the groups help the intended workflow. For anomaly detection, review sampled alerts and track the burden they place on investigators.
Relationship data can help analysts interpret an anomaly. In an illustrative transaction workflow, accounts, devices, and payments form a graph. An analyst could inspect connections around an anomalous payment, including accounts that share a device, to understand its context. These connections provide evidence to investigate alongside the anomaly score.
PuppyGraph lets teams define a graph schema over existing tables and query those relationships using openCypher and Gremlin. Its direct-query architecture reads supported SQL databases, warehouses, and lakehouses without requiring a persistent duplicate graph dataset. In this workflow, graph queries supply the relationship context an analyst needs to investigate an alert; anomaly detection and evaluation remain steps in the ML pipeline.
Conclusion
Supervised learning fits a defined prediction task when trustworthy target labels are available. Unsupervised learning supports discovering groups, reducing dimensions, and investigating unusual observations without supplied outcome labels guiding training. Neither approach removes the need to define success: one requires credible evaluation against outcomes, and the other requires evidence that the discovered structure is useful.
A practical workflow can combine them. Explore patterns, investigate what they mean, collect reliable outcomes, and evaluate a predictor when the decision becomes clear. Relationship data can support both stages: connections around an anomalous payment provide investigation context, while counts of accounts sharing a device could become candidate supervised features. Test those features against the prediction task, using only connections known at the prediction time.
Try the forever-free PuppyGraph Developer Edition and book a demo with the team to see how openCypher and Gremlin queries explore relationships across warehouse and lakehouse tables, with no graph-specific ETL, to support feature preparation and investigation alongside your learning workflow.

Hao Wu is a Software Engineer with a strong foundation in computer science and algorithms. He earned his Bachelor’s degree in Computer Science from Fudan University and a Master’s degree from George Washington University, where he focused on graph databases.


