

What Is Data Observability? Benefits, Components
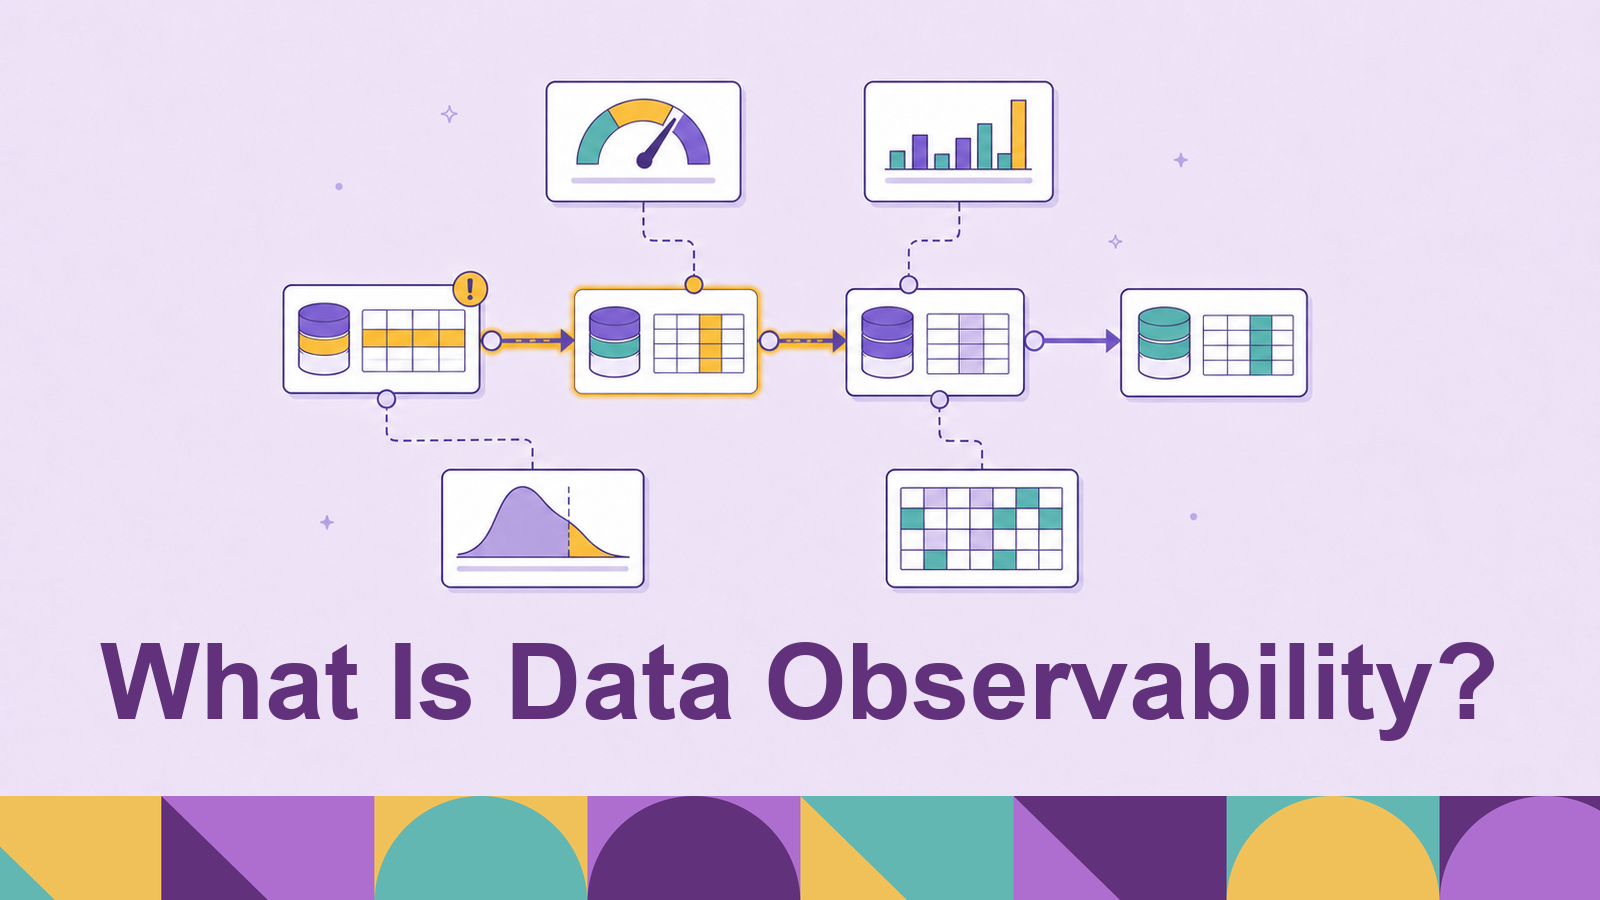
A broken data pipeline rarely announces itself. Jobs finish green, dashboards keep rendering, and the numbers on them drift away from reality until someone downstream, a customer, an executive, or a model trained on the data, notices first. Data observability is the discipline that closes this gap: instrumenting data systems so that teams learn about bad data from their monitoring rather than from the people who trusted it.
This post covers what data observability means and where the term comes from, why it has become a standard part of the data platform, how the tooling works, the five pillars the practice is organized around, the failure classes it catches, how it maps onto a modern pipeline, and the benefits teams see when they adopt it.
What is data observability?
Data observability is the ability to understand the health and state of the data in a system from the signals that system already emits: metadata, metrics, logs, query history, and lineage. The word comes from control theory, where a system is called observable if its internal state can be inferred from its external outputs. Software engineering borrowed it first: application observability, built on logs, metrics, and traces, lets an engineer ask new questions of a running system without shipping new instrumentation. Data observability applies the same idea to the data platform. Tables, pipelines, and the jobs that move data between them are treated as a production system whose health must be inferred continuously.
The practical difference from data testing is where the expectations come from. A test asserts something you already know to check: this column is never null, this value stays between 0 and 1, this table has exactly one row per order. Tests catch the failures someone predicted. An observability system instead learns the normal behavior of each asset from its history, its update cadence, typical volume, and value distributions, and flags deviations that no one wrote a rule for. The two are complements: tests encode the known failure modes, observability covers the ones that have not happened yet.
The problem the practice addresses has a name: data downtime, the periods when data is missing, erroneous, or otherwise untrustworthy. Monte Carlo co-founder Barr Moses coined the term to give data teams a parallel to application downtime: a measurable condition with a start, an end, a cost, and an owner, rather than a vague sense that the numbers might be off. Framing reliability as downtime is what makes it manageable; you can measure how often it happens, how long it lasts, and whether it is trending in the right direction.
Why data observability matters
Data fails differently than software. When an application breaks, the failure is loud: error rates spike, pages fire, users see a broken screen. When a pipeline breaks, the failure is usually quiet, because orchestrators measure execution, not correctness. A job that loaded zero rows, or loaded yesterday’s file twice, or picked up a column whose meaning changed upstream, exits with the same success code as a healthy run. The data is wrong, and every system that consumes it keeps operating as if it were right.
The scale of modern platforms turns that quiet failure mode into a structural risk. A typical stack now spans dozens of sources, hundreds or thousands of tables, layers of transformation models, and a growing set of consumers: dashboards, reverse ETL syncs, machine learning features, and AI applications. No one holds that dependency web in their head, and every hop in it is a place where data can silently degrade. The question is no longer whether bad data will enter the system but how long it will flow before someone notices, and how far it will have spread by then.
The cost of not noticing is well documented. In the customer survey behind Gartner’s 2020 Magic Quadrant for Data Quality Solutions, organizations estimated the average cost of poor data quality at $12.9 million a year, a figure Gartner still cites in its current data quality guidance. The unmeasured costs are often larger: engineering time burned on firefighting, and the slow erosion of trust that follows each incident. A stakeholder who has been burned by a dashboard once will quietly stop using it, and rebuilding that trust takes far longer than fixing the pipeline did.
AI raises the stakes further. A human analyst who sees revenue triple overnight gets suspicious; a model trained on that table does not, and an AI application answering questions from it will repeat the error fluently. As more data consumption happens without a skeptical human in the loop, the reliability of the data has to be established before consumption, which is exactly the job data observability does.
How data observability works
Data observability platforms follow a common operating loop, whatever their vendor. Each stage maps onto a practice that software teams already run for services, applied to tables and pipelines.
Metadata collection. The platform connects to the systems that already know what happened: warehouse and lakehouse query logs, information schemas, table statistics, and orchestrator run states. Most of the signal comes from this metadata rather than from scanning the data itself, which keeps overhead on the underlying systems low. Field-level metrics that metadata cannot provide, such as null rates or value distributions on critical columns, are collected with targeted queries against the assets that warrant them.
Baselining. From history, the system learns what normal looks like for each asset: when a table usually updates, how many rows a daily load usually carries, what fraction of a field is usually null, how values are usually distributed. Statistical and machine learning models absorb seasonality, so a small Sunday load on a weekday-driven table does not need a hand-tuned threshold to be recognized as normal.
Detection and alerting. Deviations from the baseline become alerts: a table that missed its expected update, a load half its usual size, a null-rate spike, a schema change on a column with downstream dependents. Alerts route to the owning team through the channels they already watch, typically Slack, PagerDuty, or the orchestrator itself.
Triage through lineage. An alert on one table is only the entry point. Lineage places the anomaly in context: which upstream changes are candidate root causes, which downstream tables, dashboards, and models are inside the blast radius, and which teams need to know before they ship a number. This stage is where an observability platform differs from a collection of independent monitors; the lineage graph is what turns an isolated anomaly into a scoped incident.
The loop should be familiar: it is incident management for data. Detect from telemetry, triage with a dependency map, resolve, and feed what was learned back into the baselines and tests.
The five pillars of data observability
The framework most of the industry organizes around comes from Monte Carlo, which introduced the five pillars of data observability in 2020. Each pillar is a family of questions about a data asset; together they cover the ways data goes wrong.
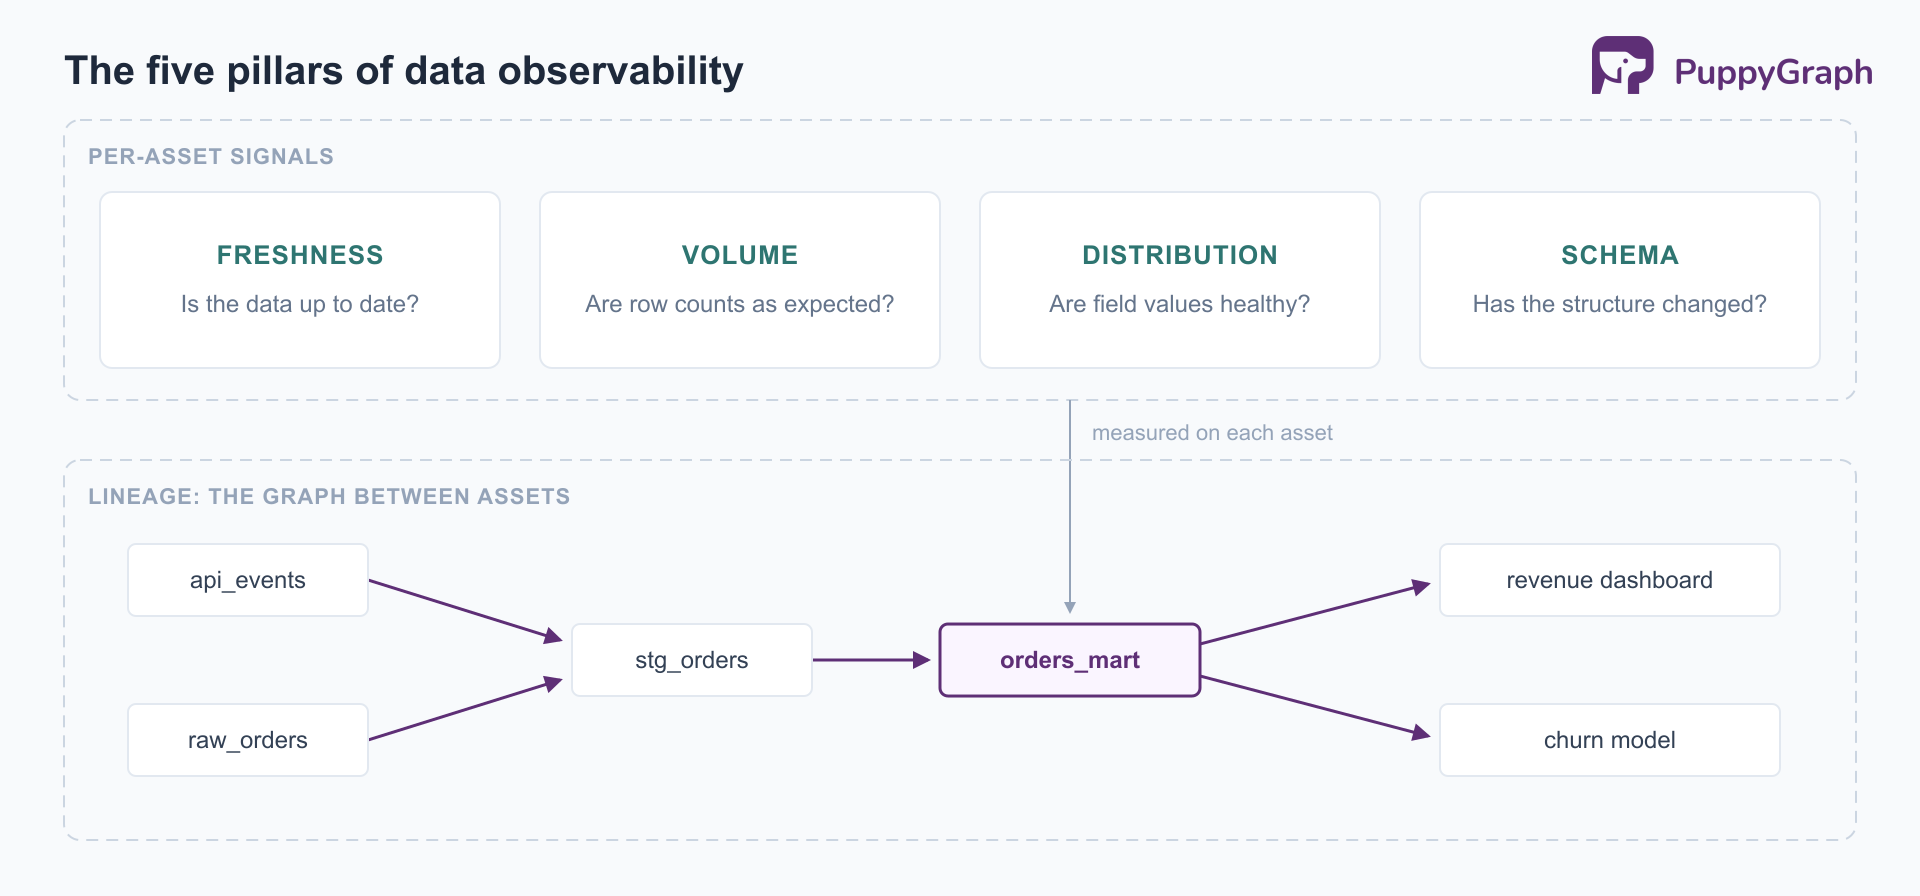
Freshness asks whether the data is up to date: when an asset was last updated, whether that matches its expected cadence, and whether there are gaps in its history. A revenue table that last loaded 26 hours ago on a daily schedule is a freshness incident, whatever its contents.
Volume asks whether the amount of data is right: row counts, file sizes, and load sizes measured against expectation. A daily load that usually carries two million rows and today carried eighty thousand signals an upstream problem long before anyone reads the numbers built from it.
Distribution asks whether the values themselves look healthy at the field level: null rates, uniqueness, value ranges, and statistical shape. A country field that is suddenly 40 percent null, or an order-value column whose mean jumped an order of magnitude, passes every structural check while carrying broken data.
Schema asks whether the structure has changed: columns added, dropped, renamed, or retyped, and by whom. Schema changes are routine upstream and breaking downstream; tracking them turns “the pipeline broke at 3 a.m.” into “the source team shipped a rename at 3 a.m.”
Lineage maps how assets connect: which upstream sources feed each table and which downstream tables, dashboards, and models consume it. Lineage is structurally different from the other four pillars. Freshness, volume, distribution, and schema are properties of individual assets; lineage is the graph between them, and it is what turns per-asset signals into system-level understanding.
In practice the pillars work jointly. An incident typically surfaces in one pillar and gets explained by another: a distribution anomaly in a mart traces back through lineage to a schema change in a source, which showed up first as a volume dip in the staging table. The pillars are less a checklist than the coordinate system in which incidents get located and explained.
Data quality issues data observability detects
The pillars describe what to watch; the value shows up in the concrete failures they catch. These are the issues that appear repeatedly in data incident postmortems.
The common property across every row: none of these failures throws an exception. Each one produces data that is structurally valid and processable, so every system in the pipeline handles it without complaint. The failures exist only relative to an expectation of what the data should look like, which is why they are invisible to execution-level monitoring and why detecting them requires a system that carries those expectations. Observability does not replace schema contracts or pipeline tests; it catches the class of failures that slip past both.
Data observability across modern data pipelines
A modern pipeline gives data many chances to go wrong between source and consumer, and observability has to cover the whole path, because an incident’s cause and its symptom are rarely at the same stage.
Ingestion brings data in from operational databases, SaaS APIs, and event streams. Typical failures here are silent connector outages, upstream API changes, and late change-data-capture, and they matter because everything downstream inherits them.
Storage, the warehouse or lakehouse, is where most observability signal is collected. Query logs, table metadata, and access history live here, which is why observability platforms lead with warehouse and lakehouse integrations.
Transformation layers, commonly dbt or SQL models, turn raw tables into marts. Logic bugs, broken incremental loads, and dependency changes concentrate here. Transformation tests help, but they cover the assertions someone thought to write.
Orchestration tools like Airflow and Dagster contribute run states: what executed, when, and in what order. Job-level success is necessary signal and insufficient on its own; observability correlates run states with the data states they produced.
Consumption is where errors become visible and expensive: BI dashboards, ML features, reverse ETL back into business tools, and AI applications. Usage signal from this stage also tells the platform team which assets actually matter, which is what makes alert prioritization possible.
The incidents that hurt are the ones that cross these stages: a connector hiccup at ingestion that surfaces as a distribution anomaly in a mart three transformation layers later, or a schema change that breaks a dashboard owned by a team that has never heard of the source system. Answering cross-stage questions means traversing the dependency graph that lineage builds, and observability platforms ship lineage views designed for exactly that kind of click-through inspection, one hop at a time.
Some of those questions outgrow a UI. Every dashboard reachable from a stale table across six transformation layers, every source feeding a regulated report, whether an incident’s blast radius includes anything an executive reads before market open: these are graph queries over metadata, and the metadata to answer them usually already sits in tables, in warehouse system tables, orchestrator databases, and catalog or observability exports. PuppyGraph presents those existing tables as a graph you can query directly with openCypher and Gremlin, with no ETL and no separate graph database to load. Because it is a query engine rather than a SQL translation layer, it compiles a traversal into a plan of node and edge operators that runs in its own distributed engine, so multi-hop blast-radius queries stay tractable as the pipeline graph grows. A blast-radius question becomes a few lines:
MATCH (t:Table {name: 'raw_orders'})-[:FEEDS*1..6]->(d:Dashboard)
RETURN DISTINCT d.name, d.owner
The query returns every dashboard within six hops downstream of a suspect table, with owners attached, which is the list an incident channel actually needs.
Benefits of data observability
Faster detection and resolution. The interval between a failure and its discovery shrinks from days, or a consumer’s complaint, to minutes, and lineage-guided triage shortens the hunt for root cause. Both halves of an incident’s duration get smaller.
Engineering time reclaimed. Locating a data quality problem typically costs more engineering time than fixing it once found, because the search crosses systems and owners while the fix is usually local. Observability moves that effort from manual investigation to reviewing scoped, contextualized alerts.
Durable trust in data. Trust in data is asymmetric: one wrong number on an executive dashboard undoes months of reliable ones. A visible record of monitored, measured reliability is what lets analysts, and increasingly AI systems, build on the data without re-verifying it first.
Lower cost of bad data. Decisions made on wrong numbers, models trained on corrupted features, and remediation projects all carry real cost; the Gartner figure cited earlier is an average, not a ceiling. Catching issues before they reach consumers converts those costs into routine fixes.
A reliable foundation for AI. Models and AI applications inherit the quality of the data beneath them, and they consume it without skepticism. Observability is the layer that establishes whether that data is current, complete, and shaped as expected before automated consumers act on it.
The benefits compound because they share infrastructure: the same lineage and baselines that shorten an incident also document the platform, prioritize the assets that matter, and provide the evidence trail that governance and AI initiatives end up needing anyway.
Conclusion
Data observability treats the data platform the way operations teams have long treated production services: as a system whose health is inferred continuously from telemetry, not assumed from exit codes. The five pillars give the practice its vocabulary, lineage ties per-asset signals into system-level understanding, and the payoff is measured in shorter incidents and durable trust. Teams adopting it do well to start where the cost of bad data is highest, the tables feeding executive dashboards, revenue reporting, and production models, and expand coverage from there rather than instrumenting everything at once.
Try the forever-free PuppyGraph Developer Edition and book a demo with the team to see how openCypher and Gremlin queries run over warehouse and lakehouse tables, with no graph-specific ETL, and how the cross-pipeline questions behind incident triage become multi-hop traversals over the metadata your stack already collects.

Sa Wang is a Software Engineer with exceptional mathematical ability and strong coding skills. He holds a Bachelor's degree in Computer Science and a Master's degree in Philosophy from Fudan University, where he specialized in Mathematical Logic.


