

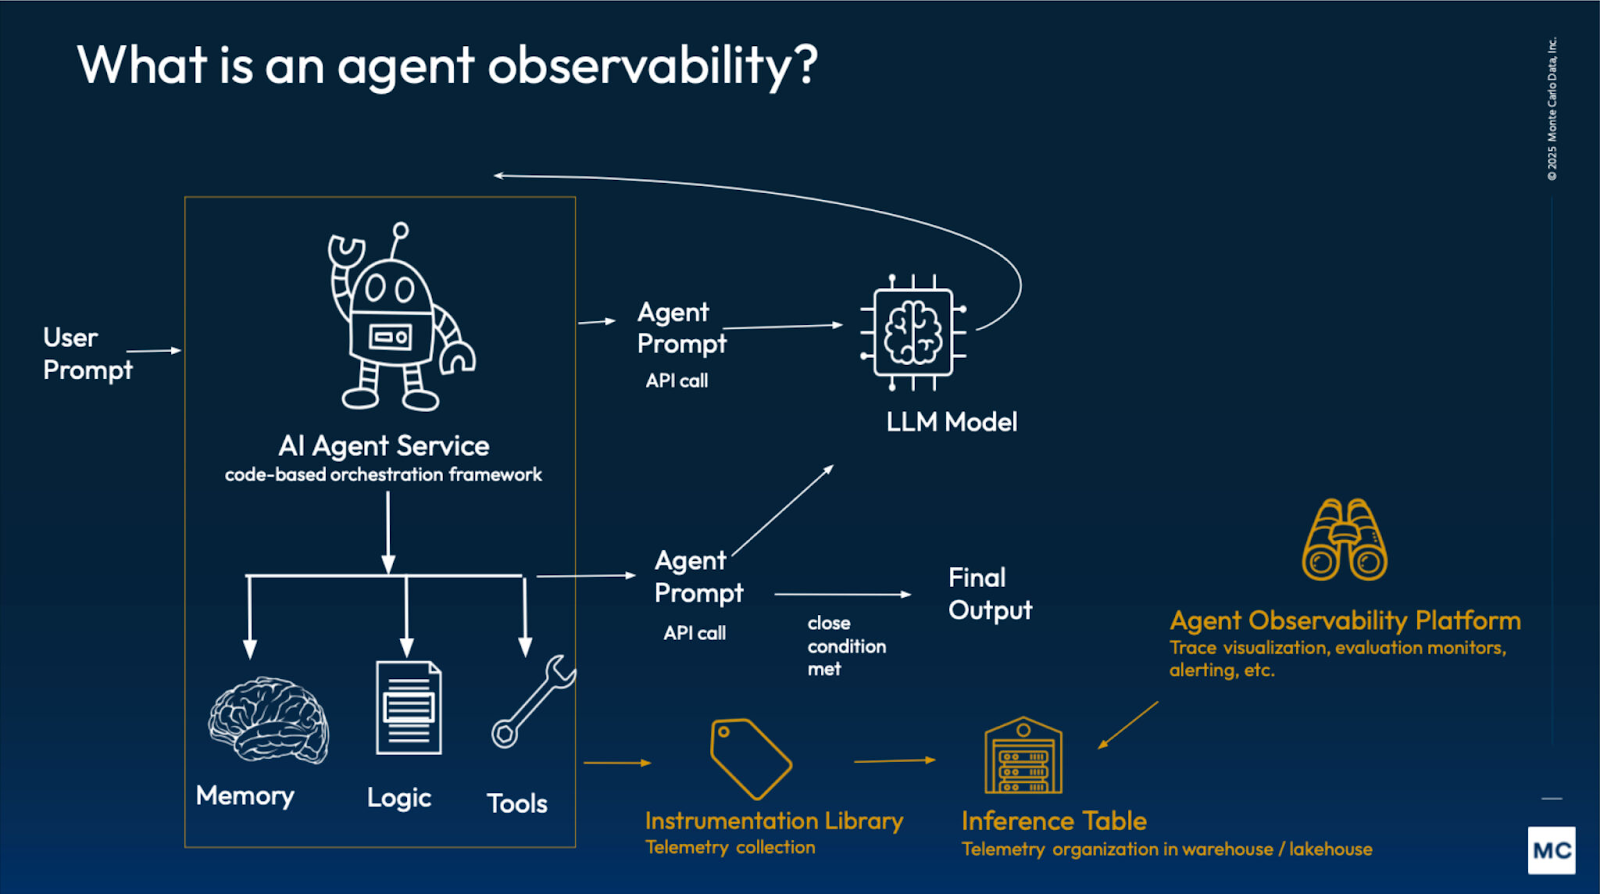
What Is Agent Observability? How Does It Work?
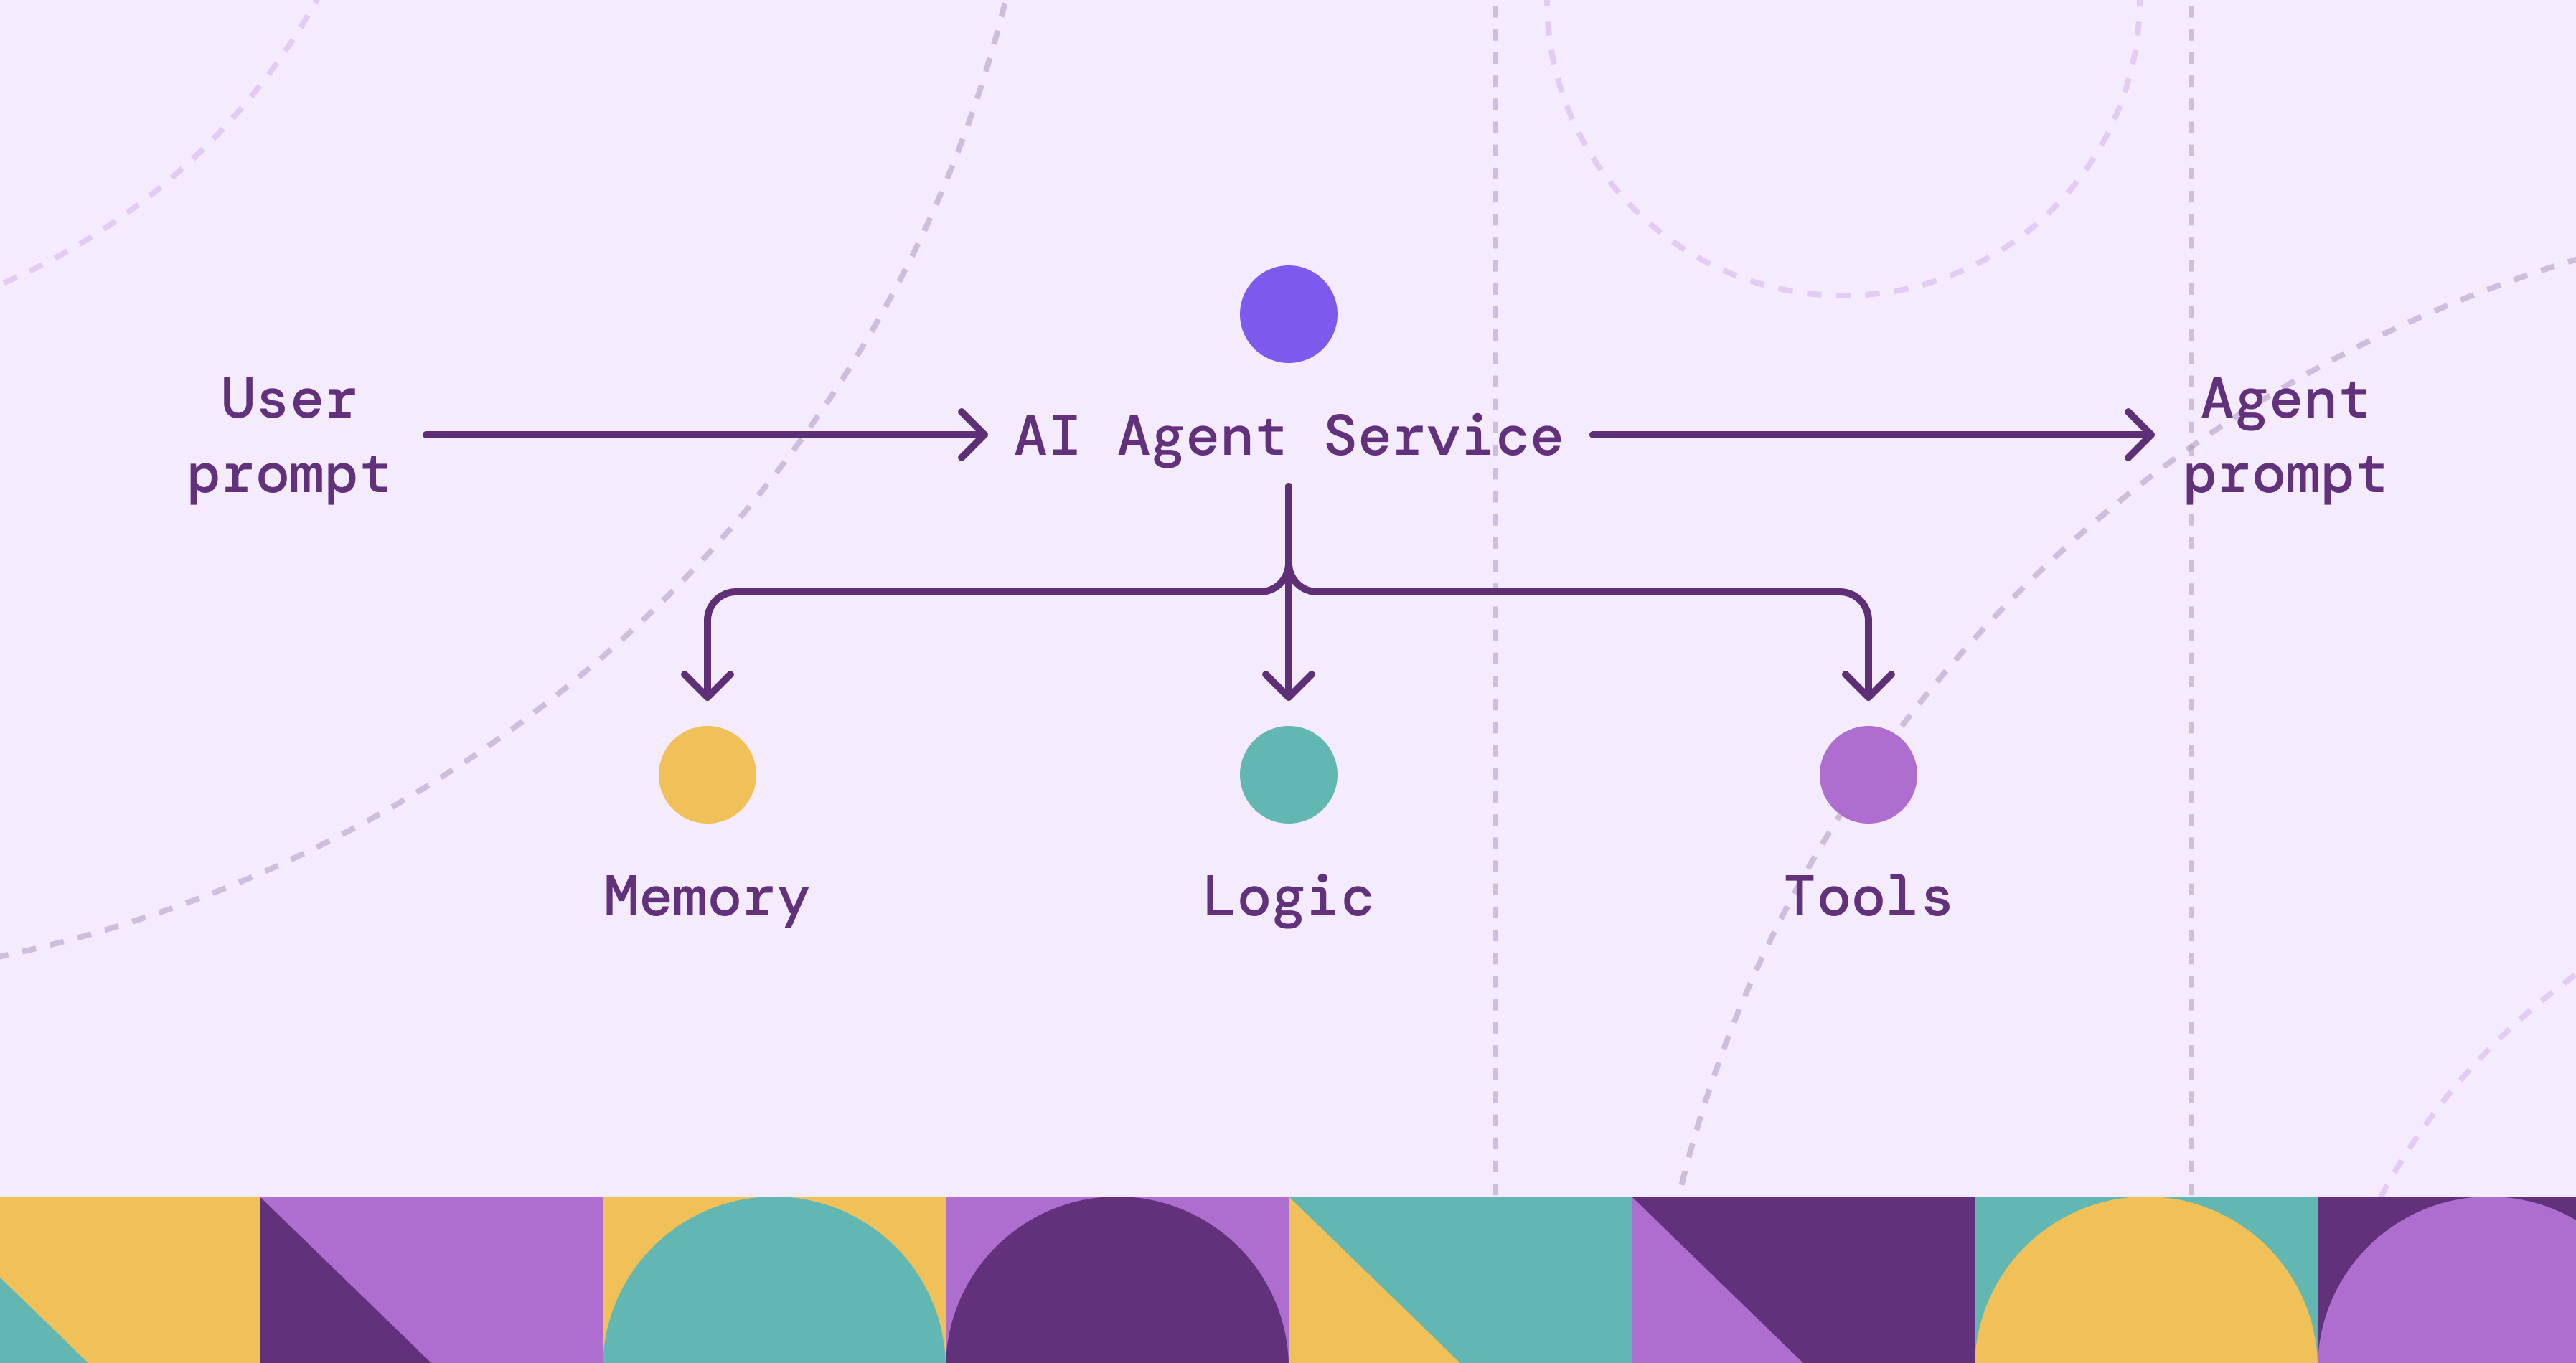
When most people mention agents today, they’re usually referring to LLM-based agents, not traditional rule-based systems. LLM agents are LLMs wrapped in a control loop that can plan, reason, and execute to complete a task. That autonomy is powerful, but it makes failures harder to diagnose. The issue might be the model, the prompt, retrieval, an external tool, or another agent in the workflow. Because runs are non-deterministic and can vary even with the same input, reproducing incidents is not always straightforward.
This is why agent observability matters. In a general sense, observability is the ability to understand a system’s internal state by analyzing its external outputs, such as metrics, logs, and traces. For agents, we go further by enriching those signals with run-level evidence that isn’t visible in the final response, including decision points, retrieved context, and tool results.
In a traditional system, you’re often asking: “Where did it fail, and why is it slow?” With agents, you need one more layer: “Why did it take that action?” For example, “Why did it close the ticket when the user asked to escalate it?”
In this blog, we break down what agent observability is and why it matters, what to measure in practice, common challenges, and best practices for implementation.
What Is Agent Observability for LLM-Based Agents
Agent observability extends traditional observability by capturing the agent-specific data needed to reconstruct a run. Beyond service health, it records what the agent saw and did across planning, retrieval, and tool calls.
The goal is to move from knowing a failure happened to understanding why the agent chose its path. This involves answering three key questions:
- Traceability: Which step introduced the behavior we’re trying to explain?
- Logic: Did the agent base its decision on the provided context, or did it introduce unsupported claims?
- Efficiency: Did the agent take a redundant or circular path to reach the result?
By tracking these elements, teams can see the causal link between a specific input and the agent's subsequent actions. This transparency is necessary for debugging non-deterministic systems where the same starting point can lead to different execution paths.
In practice, we track the standard execution trail across planning, retrieval, and tool calls. On top of that, we attach two agent-specific layers: evaluations to measure quality and governance to enforce permissions and record an audit trail.
This instrumentation makes agent behavior explainable and debuggable at runtime, especially as workflows become more tool-heavy and multi-step.
Why Agent Observability Matters
Agentic systems introduce more moving parts than traditional applications: model calls, retrieval layers, memory, tools, and sometimes multiple agents collaborating on the same goal. When these systems fail, the failure is rarely isolated to a single component. Agent observability matters because it provides the end-to-end traceability needed to operate and govern agents safely, reliably and efficiently in production.
Faster Root-Cause Analysis
When an agent produces an unexpected result, the final response rarely tells you what actually went wrong. Observability lets you reconstruct the run step by step so you can see what the agent saw, what it tried, and where things started to drift. An undesirable outcome might come down to something simple like a tool call timing out, retrieval pulling the wrong context, or a retry that made the agent continue with incomplete information. With that traceability, teams can fix the real issue instead of guessing where the problem lies.
Reliable Agent Behavior at Scale
Teams and users will only rely on agents if they behave consistently under real-world conditions. With agents, a reasonable-looking output is no longer a reliable proxy for success. A run can look fine while failing silently in retrieval, a tool call, or a skipped check. Observability makes reliability measurable through success rate, tool failure rate, retry frequency, and quality signals like groundedness and output validation. Instead of treating agent behavior as a black box, teams can track whether the agent is actually meeting the standards required for production use.
Auditability, Security, and Compliance
Agents often touch sensitive systems. Observability provides an audit trail of what data was accessed, which tools were used, and what actions were taken under which permissions. This supports incident response, policy enforcement, and compliance, and it helps surface risky patterns before they become incidents.
Cost Management
Agent runs can become expensive quickly, especially when they involve multiple steps and repeated tool usage. Observability helps control spend by tracking token usage, model routing, tool call volume, and cost per successful task. With that visibility, teams can set budgets, detect runaway sessions, and tune for efficiency without guessing.
Visibility Across Multi-Agent Workflows
In multi-agent systems, work and responsibility are distributed across agents, shared state, and external tools. Observability ties those interactions together so you can track handoffs, message flows, and where failures actually originate. Without it, even small incidents can turn into long investigations across logs and teams.
How Agent Observability Works
Agent observability is implemented the same way traditional observability is implemented: you instrument the application so it emits logs, metrics, and traces. The difference is what you attach to those signals so a team can reconstruct an agent run end to end across planning, retrieval, tools, and outcomes.
1) Define the Run
Start by deciding what counts as a single unit of work. For most teams, a run maps to one user request or one workflow execution. Each run should have:
- A stable run identifier (often aligned with a trace ID)
- A clear outcome (success, failure, partial)
- A stop reason (timeout, tool error, policy block, user cancel)
It also helps to standardize baseline fields like total latency and token usage so runs can be compared over time.
2) Instrument the Decision Surface
Agents fail in places that don’t show up in the final response. Instrument the points where behavior can change or branch, including:
- Planning and step execution
- Retrieval and memory activity
- Tool calls
- Model calls
The goal is to capture run-level evidence that explains why a run took the path it did, without relying on ad hoc logging during incidents.
3) Trace the Execution End-to-End
A trace gives you the full timeline of a run. Spans capture major phases like planning, retrieval, tool calls, and response generation, and they can nest when one step triggers multiple calls. You don’t need an elaborate span taxonomy. What matters is correlation: every log line, metric, evaluation score, or policy decision should tie back to the same run and the specific step that produced it.
4) Monitor and Alert
Once the agent emits consistent telemetry, you can build dashboards and alerts around the failure modes that matter in production. The same telemetry powers multiple views: reliability and efficiency for operations, quality for correctness, and governance for safety.
5) Improve Continuously
Use traces to debug incidents, then feed what you learn back into prompts, retrieval configuration, tool error handling, and guardrails. Evaluations help you catch regressions before they ship by turning “it feels worse” into measurable signals. Over time, this closes the loop from observing runs to improving reliability, quality, and cost.
Monitoring Agent Behavior and Decision-Making
Monitoring agent behavior starts with a simple idea: treat each run as a sequence of decisions, not just a final answer. Traditional monitoring tells you whether the system is up and how long requests take. With agents, you also want to know whether the agent is making sensible choices as it moves through its control loop.
Reconstructing Runs with Telemetry
Most agent decisions show up as observable events. The agent picks a next step, decides whether to retrieve context, chooses a tool, retries after a failure, or replans when new information arrives. These decision points determine whether a run stays on track.
A practical way to monitor this is to track a small set of run signals:
- Step progression: how many steps it took, and whether it followed a stable sequence or kept replanning
- Tool choice patterns: which tools it relied on, and whether it bounced between tools
- Retries and replans: how often it retried a call or threw away its plan
- Context usage: whether retrieval was used, what sources it pulled, and whether it proceeded without grounding
- Stop conditions: success, timeout, policy block, user cancel, partial completion
Over time, this becomes an early warning system for regressions. You’re not just watching uptime. You’re watching whether the agent’s decisions lead to reliable results.
Example: Failed Ticket Escalation
Imagine a support agent that’s supposed to escalate a ticket when a customer asks. The final reply might look fine, but the run tells a different story:
Without observability, you only see the final message and a frustrated user. With the right telemetry, you can pinpoint the actual failure mode: wrong context plus a tool timeout pushed the agent into a bad fallback path.
Tracing Agent Actions and Tool Usage
Tracing agent actions and tool usage is where agent observability becomes operational. It’s not enough to know that a run failed or got expensive. You want to understand how it happened so you can fix it: which tool calls happened, in what order, what they returned, and how the agent responded.
What Tool Traces Should Capture
Tool calls are where most agent workflows spend their time and budget, and where many failures surface. Good tool-level tracing makes each interaction inspectable by capturing the intent of the call, timing, outcomes, and how the agent reacted next.
Tool Failure vs Agent Failure
When something goes wrong, the point isn’t to blame the agent or the tool. It’s to separate dependency issues from agent behavior so you know what to fix. A timeout, rate limit, or 5xx often points to the tool or its environment. Wrong parameters, the wrong tool choice, or skipping a prerequisite step points to the workflow. In practice, both can be true, and tracing helps you see the chain of cause and effect.
Agent Follow-Up to Tool Response
The most important part of tool observability is what happens after the call returns. Did the agent validate the result before acting? Did it retry with backoff, replan, switch tools, escalate, or proceed with partial data? These follow-up decisions often determine whether a transient tool issue becomes a small hiccup or a user-facing incident.
Cost and Efficiency Signals
Tool usage is one of the biggest drivers of both latency and spend in agent workflows. Traces make cost patterns obvious, like fan-out tool calls, repeated identical requests, retries that never converge, and over-fetching large payloads that the agent doesn’t need. Once those patterns are visible, you can cap retries, add caching, tighten retrieval, and push cheap checks earlier in the run.
Example: Same Outcome, Different Root Cause
Tool-level tracing helps you distinguish a dependency incident from an agent/workflow issue, even when both show up as “failed runs” in the UI.
Over time, this kind of tracing gives you two practical wins: clearer ownership during incidents and a straightforward way to cut cost by removing redundant calls, tuning retries, and fixing expensive execution paths.
Agent Performance and Outcome Evaluation
Tracing tells you what happened during a run. Performance and outcome evaluation tells you whether the run met your expectations. This matters because an agent can “complete” a workflow while still failing the user goal, producing ungrounded output, or violating formatting and policy requirements.
What Evaluations Measure
Evaluations turn “was this good?” into measurable signals. Most teams score task success, correctness and groundedness, and adherence to instructions, format, and safety rules, using a mix of automated checks, LLM-as-judges, and user feedback:
- Outcome: did the action actually happen?
- Alignment: did it follow the user’s intent and constraints?
- Groundedness: do claims match retrieved context and tool results?
- Compliance: did it follow format and policy rules?
Some evaluations run online at runtime to catch obvious issues early, like missing required fields, ungrounded claims, or contradictions with tool output. Others run offline in CI or scheduled suites to detect regressions after changes to prompts, models, retrieval, or tools.
Evaluations are most useful when they’re linked to a run. When a score drops, traces help you pinpoint whether the issue came from retrieval, a tool failure, or how the agent handled the tool response, so you can fix the right layer.
Example: Task Failed Successfully
Imagine a travel agent that’s supposed to book a hotel in London. The run completes without errors, but the agent books a flight to Paris instead. From an operational view, everything looks healthy. From a user view, it’s a failure.
This is where evaluations matter. They give you a way to measure whether the agent actually satisfied the request, not just whether the workflow ran to completion.
Observability for Multi-Agent Systems
Multi-agent systems introduce a different observability problem because the “agent” is no longer a single loop. Work is distributed across multiple agents, shared memory, and external tools, and many failures come from coordination rather than one isolated step.
Observability makes this visible by tracing who decided what, under which context and policies, and how the system resolved it. In practice, multi-agent observability focuses on correlation signals such as:
- Handoffs: which agent delegated to which, and why
- Message flow: what each agent sent or received, and when
- Task lineage: parent tasks, child tasks, and completion criteria
- Shared state access: memory reads and writes, conflicts, and overwrites
- Attribution: where a failure originated, and which decision chain most influenced the outcome
Without these correlations, a single incident turns into a log hunt across agents and tools with no clear root cause.
Challenges in Implementing Agent Observability
Agent observability sounds straightforward until you run agents in production. Here are the practical challenges that make it difficult at scale.
Incomplete and Inconsistent Traces
Agents change fast and instrumentation lags. Missing spans, inconsistent naming, or unlogged intermediate steps can make traces misleading. Teams need stable schemas and versioning, plus guardrails when critical telemetry is missing.
Distinguishing Agent Failures from External Factors
Many “agent failures” are really tool timeouts, rate limits, stale retrieval, API changes, or permission errors. Observability has to distinguish decision quality from execution reliability so teams fix the right layer.
Non-Determinism and Reproducibility
The same input can produce different paths due to model variance, retrieval drift, tool timing, or memory. You need enough run context to explain variance, not just record outputs.
Capturing Context Safely
The most useful signals are also sensitive: prompts, user inputs, retrieved documents, and tool outputs. Logging must be production-safe with redaction, access control, and retention policies.
Multi-Agent Attribution and Accountability
Failures can originate in one agent and surface in another through handoffs or shared memory. Without correlation across agents and shared state, incidents are hard to assign and prevent.
Telemetry Cost and High Cardinality
Prompts, tool arguments, retrieved chunks, and step artifacts create lots of unique data. Without sampling, summarization, and tiered storage, telemetry costs can grow quickly.
Best Practices for Agent Observability
These practices map directly to the challenges above and are meant to keep observability usable as agents, tools, and workflows evolve.
Standardize Tracing Before Scaling
Keep telemetry consistent even if runs aren’t. Use a stable run model with run IDs and step IDs, instrument the common choke points (LLM, retrieval, tools, memory/state, guardrails), and keep span names and core fields versioned and comparable.
Separate Decisions from Dependencies
Log tool failures as first-class events with clear error types and the step that triggered them. This makes it obvious whether you’re dealing with a behavior issue (bad choice) or an execution issue (timeout, rate limit, permissions, upstream change).
Build Privacy and Governance from Day One
Treat prompts, retrieved context, and tool outputs as sensitive. Redact early, restrict access, and set retention and sampling policies. Keep lightweight metadata in traces and store heavy artifacts in controlled storage.
Track the Handoffs
For multi-agent workflows, record who delegated to whom, why, what context was shared, and the expected completion criteria. Include shared-state reads/writes so you can spot loops, conflicts, and state contention without stitching logs manually.
Deeper Observability Insights with Graphs
Most agent observability stacks can capture telemetry. The harder part is answering the harder questions: what led to an outcome, what else is connected to it, and which patterns repeat across runs. Table-first analytics can handle aggregates and simple correlations, but these questions often require multi-hop reasoning across runs, steps, tools, retrieval, and outcomes.
Observability telemetry already lends itself to a graph structure. A run contains steps. Steps trigger tool calls and retrieval. Those steps touch systems, datasets, and documents, and produce outcomes like user actions, incidents, and remediation. Once you’re tracing influence, finding repeated patterns, or measuring blast radius, you’re traversing a graph whether you call it that or not.
Agents make this more important because execution isn’t a fixed call graph. Runs branch, retry, and hand off work based on intermediate results. The analysis becomes path-based: root-cause chains, loop detection, and which step sequences correlate with failures or high cost.
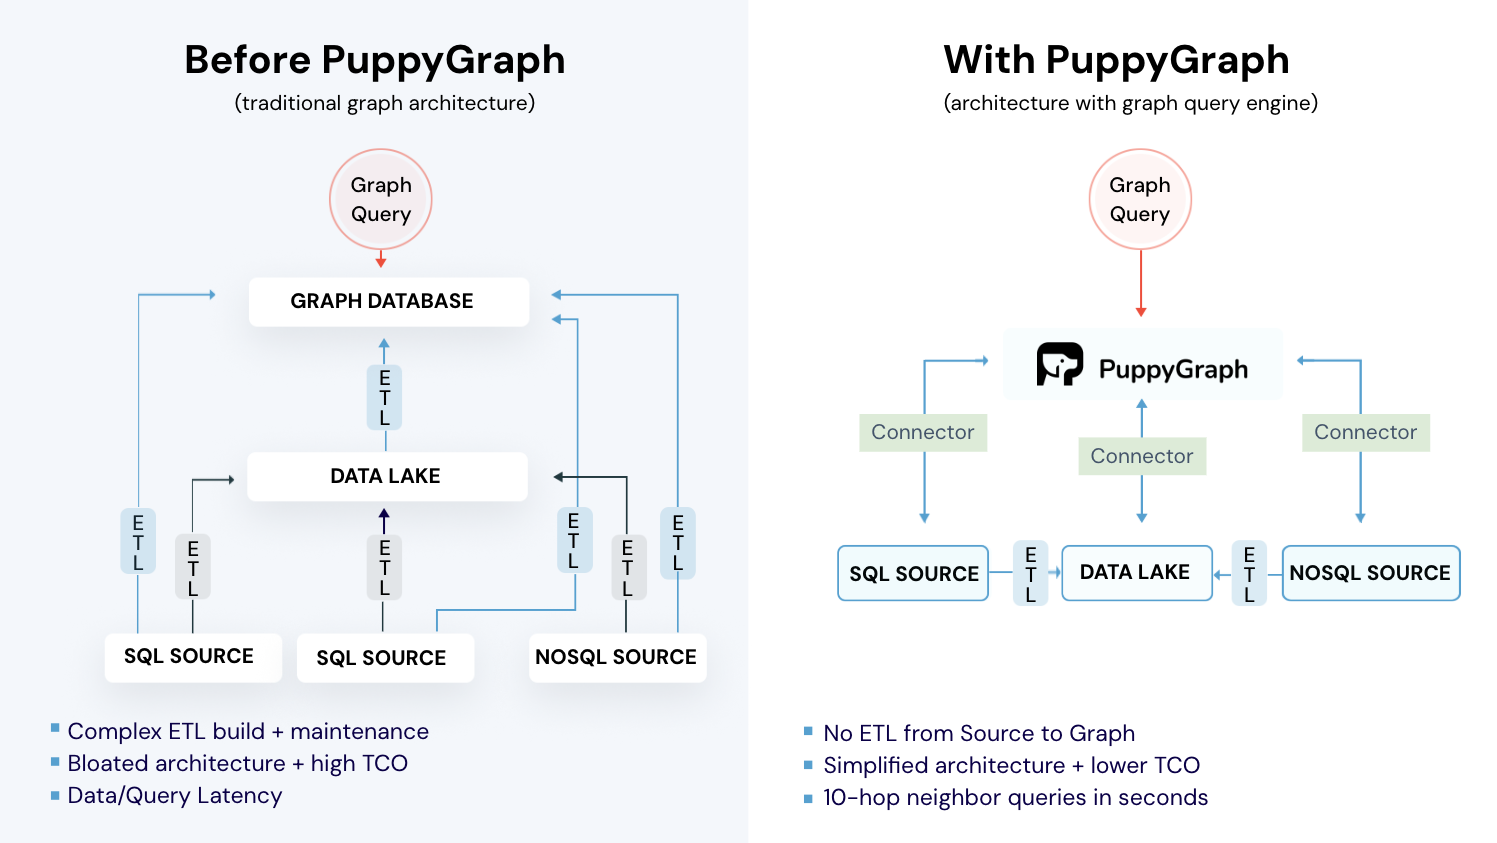
So it’s natural to reach for graph analytics. The challenge is doing it without taking on the usual graph database trade-offs: moving and duplicating data, building ETL pipelines to keep it in sync, and adding operational overhead. That’s where PuppyGraph comes in.
How PuppyGraph Helps

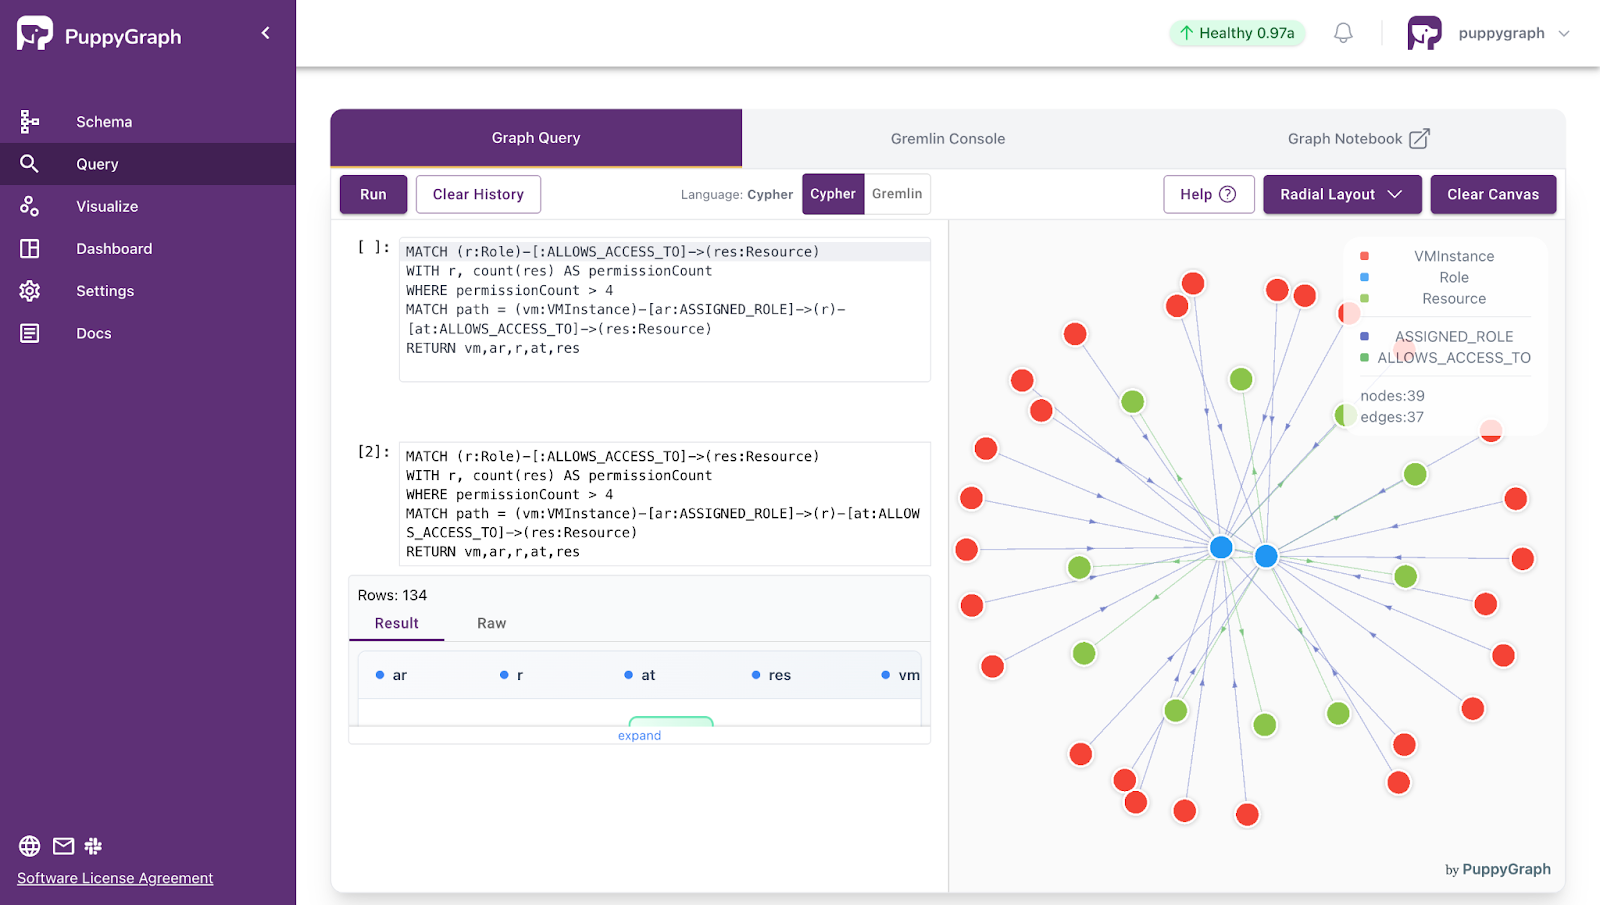
PuppyGraph is the first and only real time, zero-ETL graph query engine in the market, empowering data teams to query existing relational data stores as a unified graph model that can be deployed in under 10 minutes, bypassing traditional graph databases' cost, latency, and maintenance hurdles.
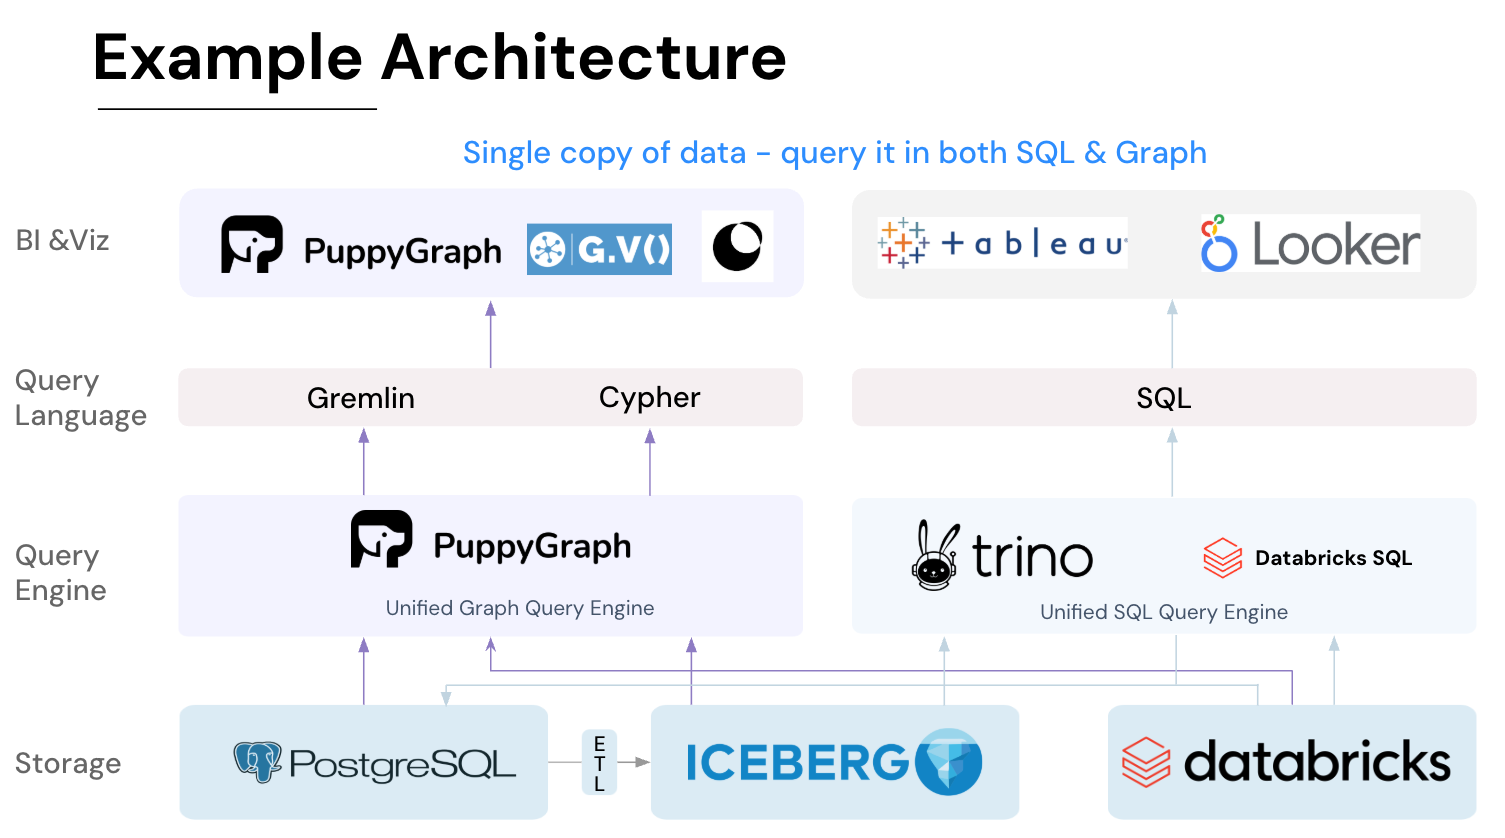
It seamlessly integrates with data lakes like Apache Iceberg, Apache Hudi, and Delta Lake, as well as databases including MySQL, PostgreSQL, and DuckDB, so you can query across multiple sources simultaneously.

Key PuppyGraph capabilities include:
- Zero ETL: PuppyGraph runs as a query engine on your existing relational databases and lakes. Skip pipeline builds, reduce fragility, and start querying as a graph in minutes.
- No Data Duplication: Query your data in place, eliminating the need to copy large datasets into a separate graph database. This ensures data consistency and leverages existing data access controls.
- Real Time Analysis: By querying live source data, analyses reflect the current state of the environment, mitigating the problem of relying on static, potentially outdated graph snapshots. PuppyGraph users report 6-hop queries across billions of edges in less than 3 seconds.
- Scalable Performance: PuppyGraph’s distributed compute engine scales with your cluster size. Run petabyte-scale workloads and deep traversals like 10-hop neighbors, and get answers back in seconds. This exceptional query performance is achieved through the use of parallel processing and vectorized evaluation technology.
- Best of SQL and Graph: Because PuppyGraph queries your data in place, teams can use their existing SQL engines for tabular workloads and PuppyGraph for relationship-heavy analysis, all on the same source tables. No need to force every use case through a graph database or retrain teams on a new query language.
- Lower Total Cost of Ownership: Graph databases make you pay twice — once for pipelines, duplicated storage, and parallel governance, and again for the high-memory hardware needed to make them fast. PuppyGraph removes both costs by querying your lake directly with zero ETL and no second system to maintain. No massive RAM bills, no duplicated ACLs, and no extra infrastructure to secure.
- Flexible and Iterative Modeling: Using metadata driven schemas allows creating multiple graph views from the same underlying data. Models can be iterated upon quickly without rebuilding data pipelines, supporting agile analysis workflows.
- Standard Querying and Visualization: Support for standard graph query languages (openCypher, Gremlin) and integrated visualization tools helps analysts explore relationships intuitively and effectively.
- Proven at Enterprise Scale: PuppyGraph is already used by half of the top 20 cybersecurity companies, as well as engineering-driven enterprises like AMD and Coinbase. Whether it’s multi-hop security reasoning, asset intelligence, or deep relationship queries across massive datasets, these teams trust PuppyGraph to replace slow ETL pipelines and complex graph stacks with a simpler, faster architecture.


As data grows more complex, the most valuable insights often lie in how entities relate. PuppyGraph brings those insights to the surface, whether you’re modeling organizational networks, social introductions, fraud and cybersecurity graphs, or GraphRAG pipelines that trace knowledge provenance.
Deployment is simple: download the free Docker image, connect PuppyGraph to your existing data stores, define graph schemas, and start querying. PuppyGraph can be deployed via Docker, AWS AMI, GCP Marketplace, or within a VPC or data center for full data control.
Conclusion
Agent observability is quickly becoming a requirement for running LLM agents in production, because agent failures rarely live in just one place. Prompts, retrieval, tools, memory, guardrails, and multi-agent handoffs all shape outcomes, and a reasonable-looking response is no longer a reliable proxy for success. By instrumenting the full execution path with traces, events, metrics, and decision context, teams can reconstruct what happened, pinpoint where things went wrong, and improve reliability, safety, and cost without guessing.
As agent telemetry grows, the next challenge is analysis: connecting signals across runs to answer the harder questions about cause, impact, and recurring patterns. That’s where graph analytics becomes especially useful, because agent telemetry is inherently relational and execution paths are dynamic.
Want to query your existing telemetry as a graph without the operational overhead? Try PuppyGraph’s forever-free Developer Edition, or book a demo with the team.

Jaz Ku is a Solution Architect with a background in Computer Science and an interest in technical writing. She earned her Bachelor's degree from the University of San Francisco, where she did research involving Rust’s compiler infrastructure. Jaz enjoys the challenge of explaining complex ideas in a clear and straightforward way.

Get started with PuppyGraph!


Developer Edition
- Forever free
- Single noded
- Designed for proving your ideas
- Available via Docker install
Enterprise Edition
- 30-day free trial with full features
- Everything in developer edition & enterprise features
- Designed for production
- Available via AWS AMI & Docker install