

What Is AI Observability?
Artificial Intelligence (AI) has become deeply embedded in products and services across industries, from personalized recommendations on streaming platforms to fraud detection in fintech. As organizations increasingly rely on AI models to make business‑critical decisions, ensuring these models behave reliably in production is no longer optional. Traditional software observability practices focus on infrastructure and application performance. But AI systems have unique characteristics: they consume real‑world data, learn patterns, and evolve when exposed to changing environments. These traits introduce new types of risks, such as model drift, bias, and opaque failure modes that aren’t visible through classic application monitoring.
This is where AI observability enters the picture. AI observability is the discipline of continuously tracking, analyzing, and interpreting the behavior of AI models throughout their lifecycle in production. It goes beyond monitoring metrics and logs to provide visibility into model decisions, input data quality, latent biases, system reliability, and their real‑world performance. With a growing emphasis on ethical AI and regulatory compliance, organizations must embrace AI observability to maintain trust, reduce operational risk, and ensure value delivery from AI investments. This article explores what AI observability is, why it matters, its core components, and practical guidance for implementation.
What Is AI Observability
AI observability refers to the set of practices, tools, and processes used to gain visibility into the internal behavior and external performance of AI systems once they are deployed in real‑world environments. Unlike traditional software systems, AI models produce outputs that are derived from complex learned patterns rather than explicit programming logic. As a result, AI observability must capture not only system performance metrics, such as latency and error rates, but also the health of the data inputs, predictions, and model reasoning.
At its core, AI observability enables teams to understand why a model is performing a certain way, when it begins to degrade, and how external factors like data drift or shifting user behavior impact its effectiveness. By instrumenting AI pipelines with observability signals, engineers and data scientists can detect issues earlier, speed up root cause analysis, and implement automated alerts when predefined thresholds are crossed. This comprehensive visibility into AI behavior is crucial in high‑stakes domains such as healthcare, finance, autonomous vehicles, and customer service, where model failures can lead to significant harm or financial loss.
Why AI Observability Matters
There are four key reasons AI observability matters:
- Dynamic nature of production data: Real-world inputs constantly change due to seasonal trends, market shifts, user preferences, and unforeseen events. These changes can gradually alter the statistical distribution of incoming data. Without observability, data drift remains hidden until model performance degrades, potentially causing significant business impact.
- Continuous insight into model health: Observability provides real-time monitoring of model behavior, allowing teams to quickly detect anomalies, performance degradation, or unintended model decisions. This reduces reliance on periodic manual checks or ad hoc validations.
- Regulatory and ethical compliance: Regulations like the EU AI Act require transparency, accountability, and fairness in AI systems. Observability enables organizations to track and document model decisions, assess potential biases, and demonstrate governance during audits, maintaining trust with stakeholders.
- Accelerated feedback and continuous improvement: By embedding observability into workflows, organizations shorten the loop between development and operations. This proactive approach allows teams to improve model behavior safely and efficiently, supporting the scalable deployment of AI initiatives across the enterprise.
Key Components of AI Observability
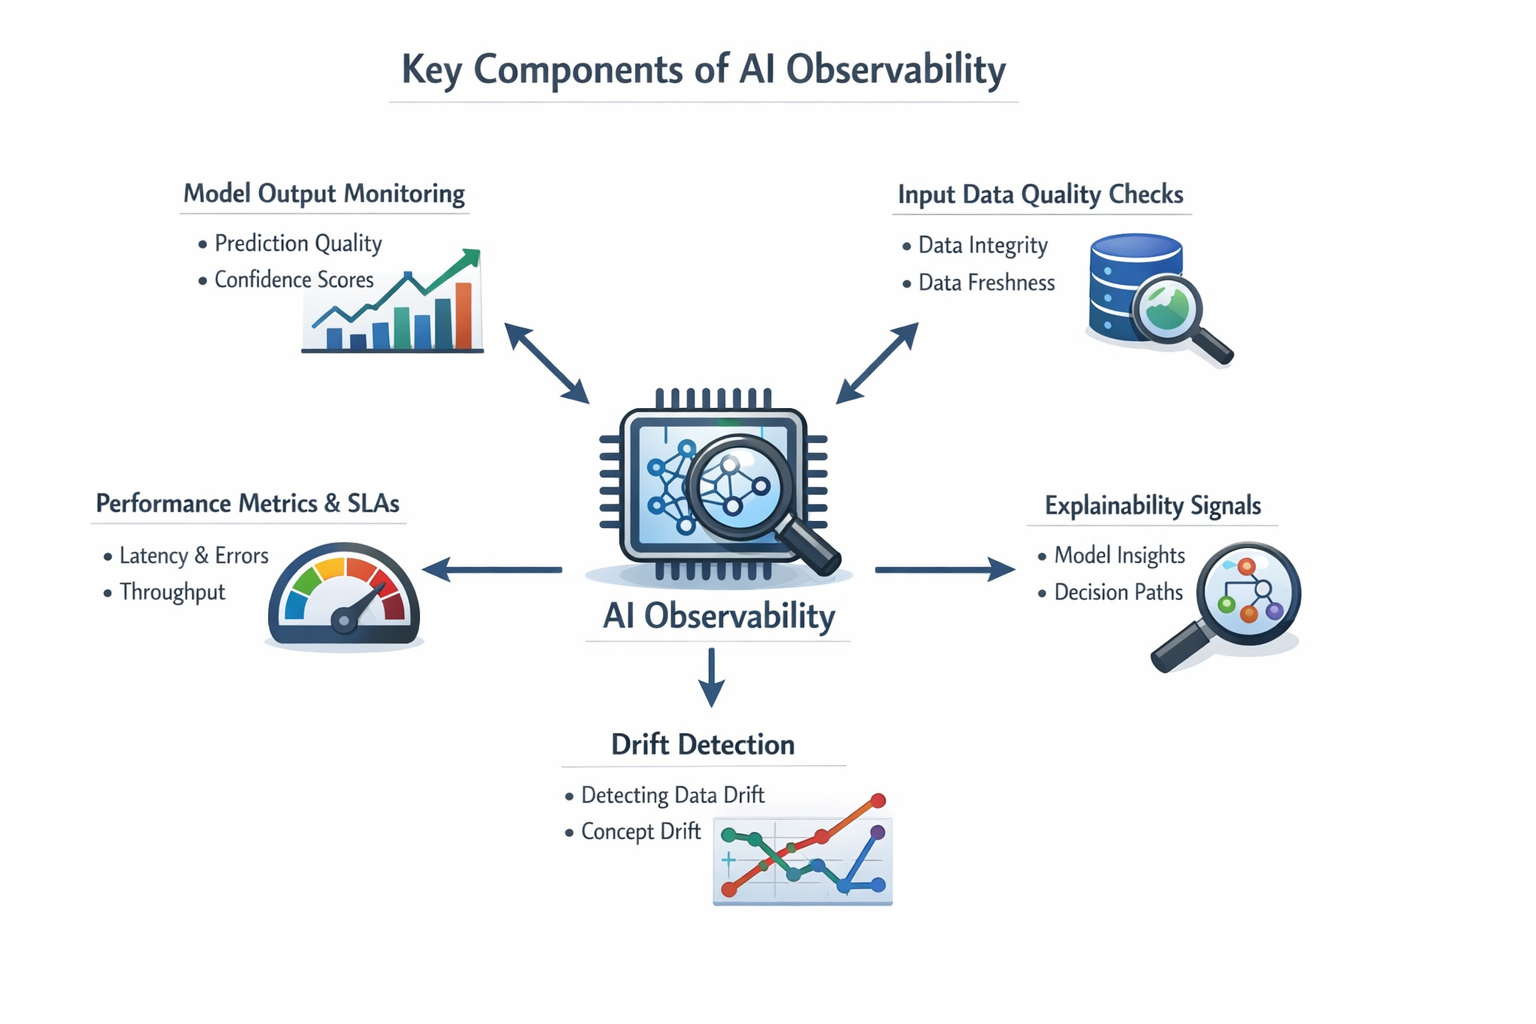
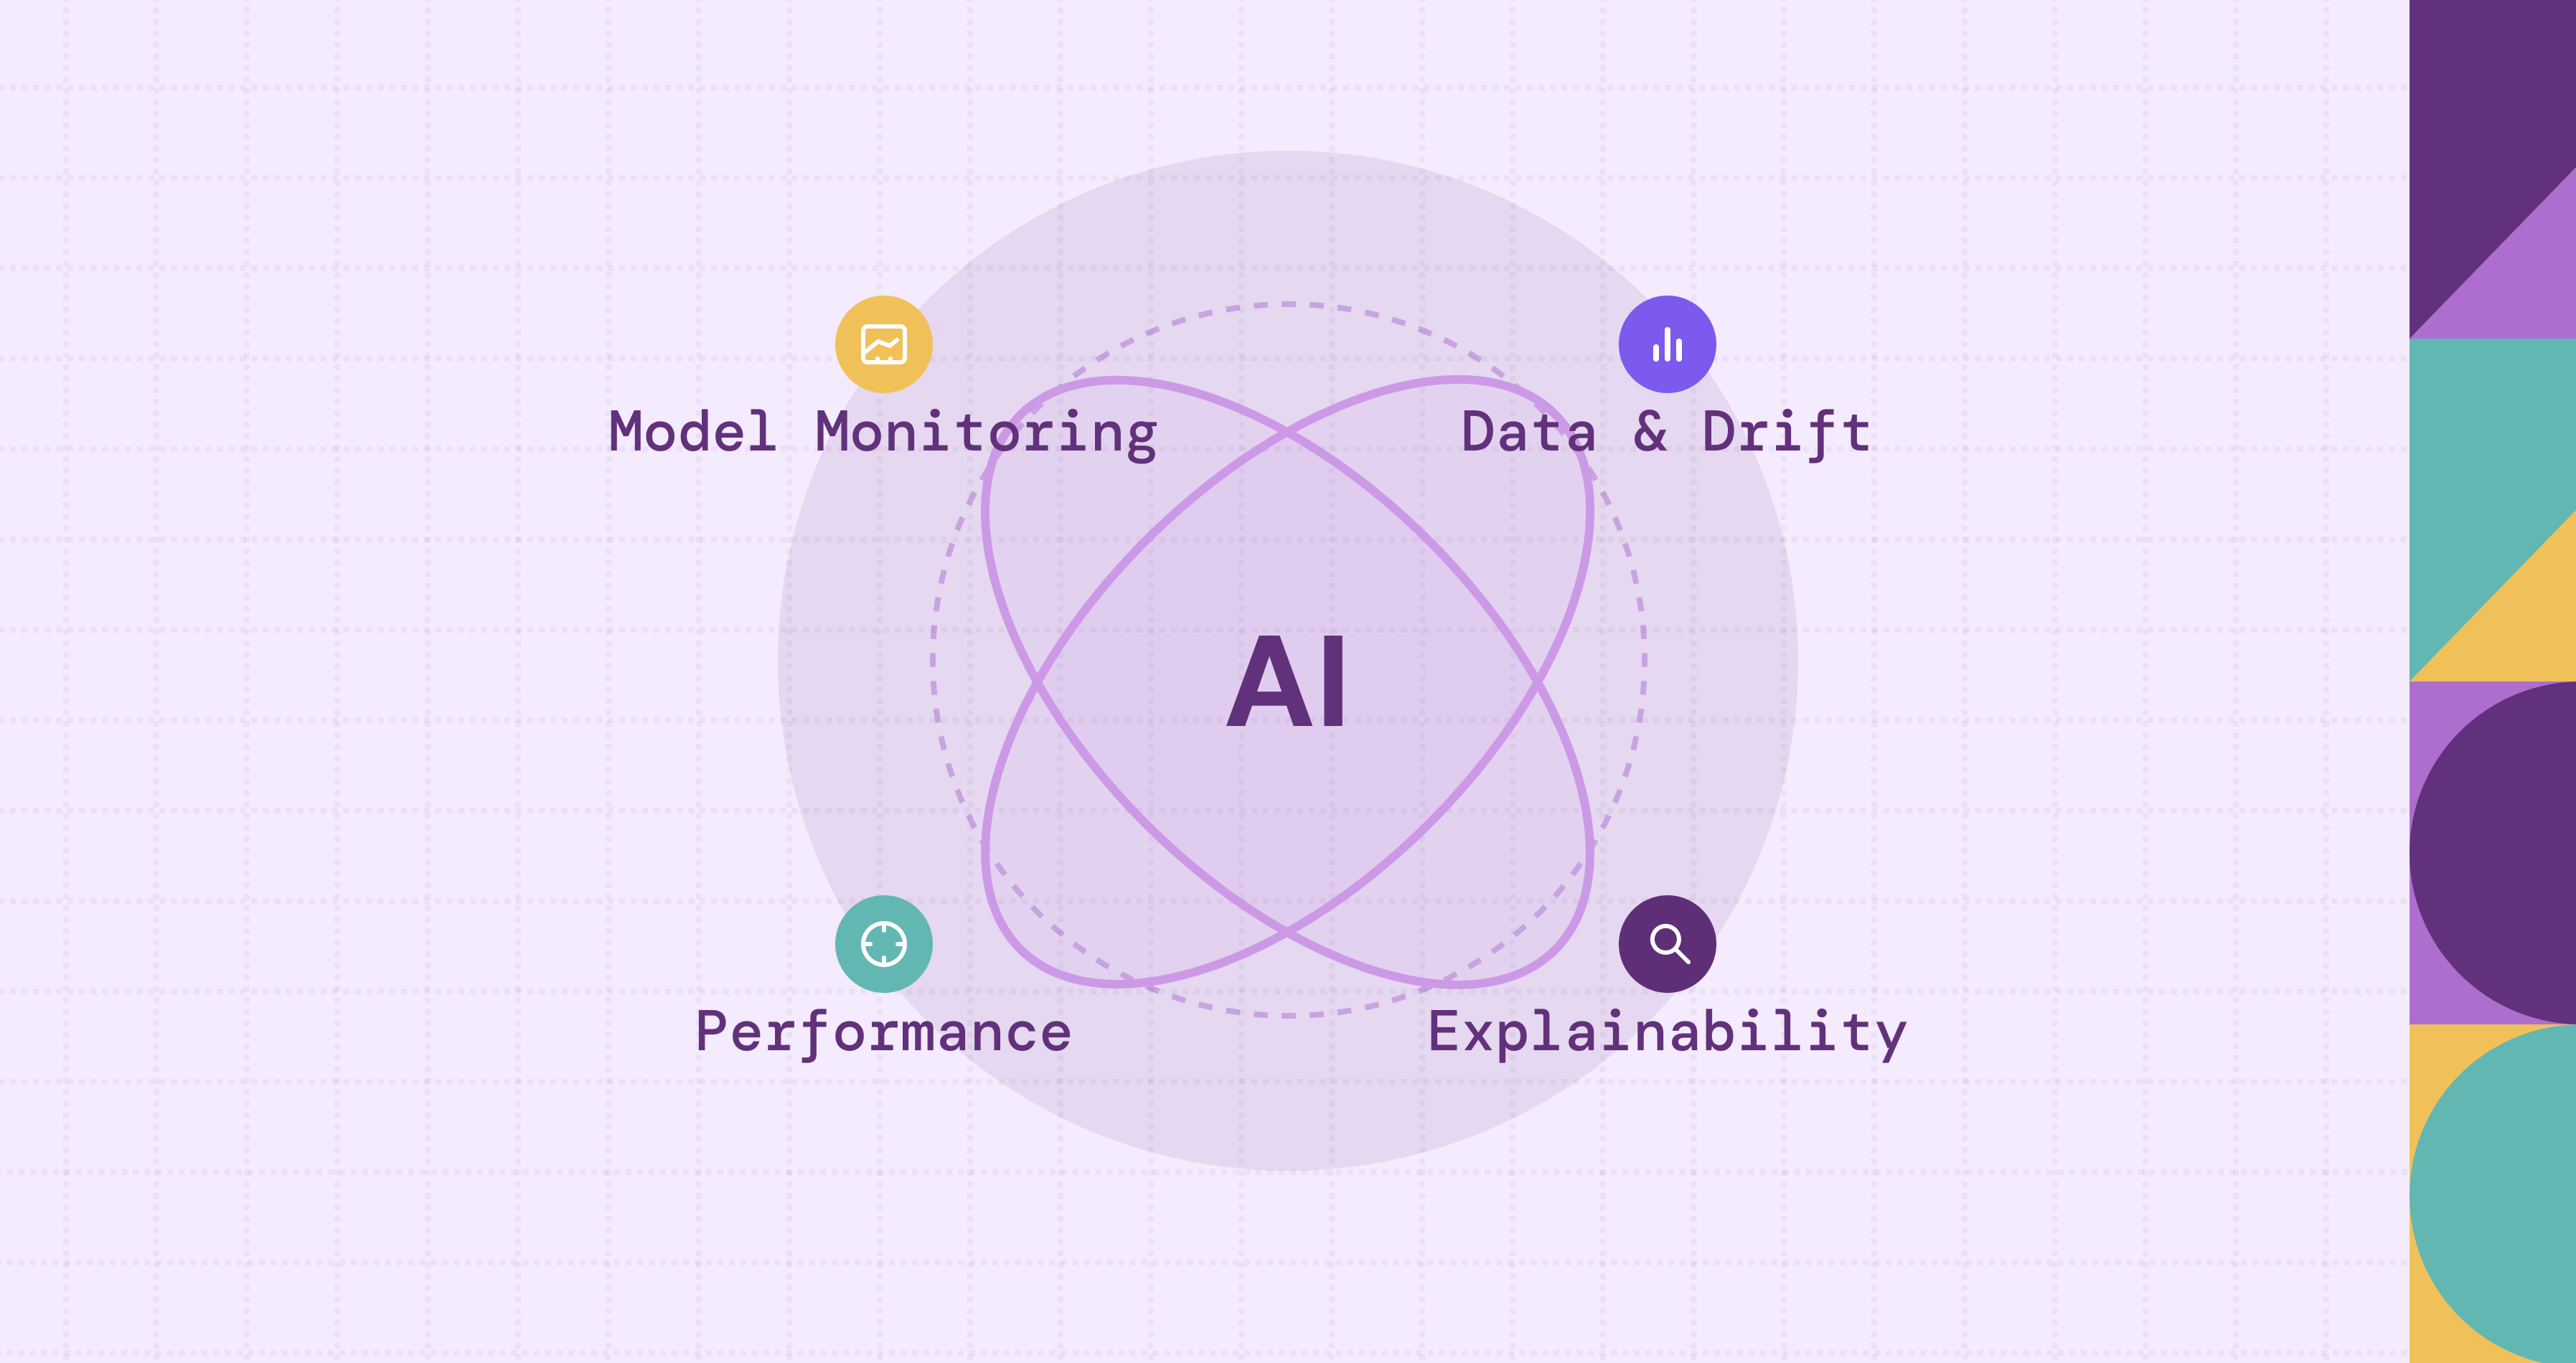
AI observability is built on a set of core components that together provide comprehensive visibility into the health and behavior of AI systems. These components include:
- Model Output Monitoring: Tracking prediction quality, confidence scores, and distribution changes in predictions over time. For example, an e-commerce recommendation system may log recommendation scores and click-through rates for displayed items. Visualizing these trends over time helps teams understand how the model behaves in production and spot gradual changes in output patterns.
- Input Data Quality Checks: Monitoring the integrity, distribution, and freshness of data that feeds into AI models. For instance, a fraud detection model might check for missing or malformed transaction fields. If too many inputs are invalid, alerts can trigger a data pipeline review.
- Performance Metrics and SLAs: Measuring model latency, throughput, and error rates against service-level expectations ensures the system meets business performance requirements. For example, a chatbot API might track response times per request. Breaches in latency thresholds could automatically scale the serving infrastructure.
- Drift Detection: Actively identifying when input or output distributions diverge from baseline expectations to trigger remediation workflows. For example, a credit scoring model may apply drift tests to compare recent applicant or score distributions against training data. Significant deviations can trigger alerts, investigations, or retraining before performance degradation impacts the business.
- Explainability Signals: Capturing interpretable information about how models arrive at decisions, particularly helpful for debugging and compliance reporting. For instance, a loan approval model might highlight which features influenced each decision. Compliance teams can then validate that the model is not biased against protected groups.
Together, these components enable AI observability to not just flag when something is wrong, but help teams understand why and how to fix it. AI observability extends traditional monitoring with richer context around data, decisions, and model internals.
Model Monitoring and Performance Tracking
Effective AI observability must closely intertwine with model monitoring, the continuous inspection of model quality and performance after deployment. Traditional monitoring tools focus on infrastructure metrics like CPU utilization, memory consumption, and latency. However, AI model monitoring includes domain‑specific metrics such as prediction accuracy, precision, recall, F1 score, and calibration metrics.
Consider a credit scoring model: system monitoring might show the API is responsive with low error codes, but without model monitoring, a sharp drop in approval accuracy might go unnoticed until users complain or business metrics decline. AI observability frameworks integrate with model monitoring to track key quality indicators and alert teams when these indicators drift outside acceptable thresholds.
Performance tracking also includes service‑level objectives (SLOs) for AI endpoints, which ensure models meet performance and reliability standards. By aligning model performance with business objectives, teams can quantify the health of AI systems in business terms, such as revenue impact, customer retention, or risk exposure.
Importantly, observability tools help visualize trends, correlate between signals, and drill down into time ranges where degradation started. This contextual awareness is essential for effective triage and rapid recovery.
Data Drift, Concept Drift, and Anomaly Detection
One of the biggest challenges in operational AI is the ever‑changing world of production data. AI observability must address two core phenomena: data drift and concept drift.
Data drift occurs when the statistical properties of input data change over time compared with the data used to train the model. For example, a model trained on historical sales data may see degraded performance when consumer behavior shifts due to cultural or economic changes.
Concept drift, on the other hand, refers to changes in the relationship between input features and the target labels. Concept drift is often more subtle and harder to detect because the input data distribution may remain similar while the underlying label associations evolve. For instance, changing user preferences may alter how certain attributes predict future behavior.
AI observability frameworks implement anomaly detection algorithms that continuously assess whether incoming data matches historical baselines. When significant deviations occur, alerts trigger investigations or automated mitigation steps such as retraining or model recalibration.
Visualization tools help stakeholders see drift over time and gauge the severity of distribution changes. Statistical tests, such as population stability index (PSI) or Kolmogorov–Smirnov (KS) statistics, are commonly used within observability pipelines to quantify drift and guide operational decisions.
Without drift detection, models can silently degrade, producing lower accuracy and biased decisions. With observability in place, teams can proactively respond to changes in data or concept behavior and maintain model performance.
Observability for LLMs and Generative AI
Large language models (LLMs) and generative AI systems introduce fresh complexities for observability. Because these models generate free‑form text, images, or other media, traditional numerical performance metrics are often insufficient to capture quality or risk. Observability for LLMs involves tracking semantic and contextual signals that indicate model health.
For example, tracking hallucination rates, where models generate plausible but incorrect information, is crucial for many applications. Observability systems may benchmark LLM outputs against ground truth when available or assess consistency across multiple queries to detect abnormal behavior.
Additionally, bias and toxicity monitoring becomes essential for generative AI. Observability tools can analyze the sentiment, fairness, or harmful content in model outputs over time to detect spikes that might indicate problematic behavior. For instance, a surge in certain toxic language might signal upstream prompt issues, data drift, or manipulated inputs.
Input context is also essential. With LLMs, the prior conversation or prompt design heavily influences outcomes. Observability frameworks for generative AI may capture context patterns to aid debugging and traceability, offering insights into why certain outputs occur and how to mitigate undesirable behavior.
Collectively, observability for LLMs provides teams with the tools to ensure reliability, safety, and alignment with ethical guidelines while balancing creativity and utility.
Tools and Platforms for AI Observability
The growing demand for AI observability has led to an ecosystem of specialized tools and platforms. These solutions range from open‑source libraries to enterprise‑grade observability suites that integrate with data pipelines, model servers, and cloud infrastructure.
Open-Source Tools
Popular open-source tools provide foundational monitoring, drift detection, and logging capabilities. They allow teams to hook into model inputs, outputs, and logs, generating dashboards and alerts without significant licensing cost. Examples include:
- Evidently AI: Focuses on data and model drift detection, model performance monitoring, and generating simple dashboards for model insights.
- WhyLabs: Offers observability for ML pipelines, including data quality, model drift, and anomaly detection.
- Prometheus + Grafana: Although originally designed for general system metrics, these tools are widely used to monitor ML models’ operational metrics and expose dashboards.
- MLflow: Primarily a model lifecycle management tool, MLflow also provides logging of metrics and artifacts that can feed into observability workflows.
Open-source solutions offer flexibility and cost advantages but may require more engineering effort to scale across complex, multi-service AI architectures.
Commercial Platforms
Commercial platforms provide end-to-end AI observability with integrated dashboards, alerting, and explainability features. They often support common ML frameworks and deployment patterns such as REST APIs, Kubernetes-based microservices, and serverless functions. Examples include:
- Weights & Biases (W&B): Offers experiment tracking, model monitoring, drift detection, and visual dashboards tailored for ML teams.
- Fiddler AI: Provides explainability, fairness metrics, and continuous monitoring for model performance and drift.
- Arize AI: Focuses on real-time monitoring, model performance analytics, and root-cause analysis for production ML models.
- Datadog APM with ML Observability: Extends traditional application monitoring to track model endpoints, latency, error rates, and prediction distribution.
Integration and Best Practices
Regardless of tool choice, successful AI observability adoption requires integration with CI/CD workflows and data governance systems. Well-instrumented models emit logs, traces, and metrics that observability systems can ingest and index for query, correlation, and forensic analysis. Teams should aim to:
- Capture model inputs and outputs at each deployment stage.
- Monitor data quality and distribution drift continuously.
- Integrate observability into CI/CD pipelines to detect issues before models reach production.
- Correlate model metrics with business KPIs to identify the real-world impact of model performance changes.
By combining these tools and best practices, organizations can ensure AI systems remain reliable, transparent, and accountable over time.
Best Practices for Implementing AI Observability
Implementing AI observability effectively involves cultural, technical, and operational shifts. Here are strategic best practices that help organizations get the most value out of their observability efforts:
- Start With Clear Objectives: Before instrumenting observability, define what success looks like. Are you optimizing model accuracy, reducing false positives, or improving fairness? Clear objectives guide which signals to track.
- Instrument Early and Often: Embed observability into your model pipelines from development through deployment. Don’t wait for models to break to add monitoring.
- Correlate Signals: Bring together data, prediction, infrastructure, and business metrics to understand performance holistically. Correlation speeds root‑cause analysis.
- Automate Alerts Meaningfully: Configure alerts that trigger on actionable thresholds rather than noise. Too many alerts cause fatigue and blind spots.
- Review Regularly: Observability is not a set‑and‑forget solution. Review dashboards, thresholds, and signal quality periodically, especially after model updates or data source changes.
By following these principles, teams can build observability systems that not only detect problems but drive continuous model improvement.
Challenges in AI Observability
Implementing AI observability presents several challenges that can complicate adoption:
- Complexity of AI Systems: AI models depend on multiple moving parts, data pipelines, feature transformations, model artifacts, and deployment infrastructure, which makes instrumentation nontrivial.
- Data Privacy and Security: Observability often requires capturing inputs and outputs. Privacy regulations like GDPR constrain how data can be logged and stored, making observability design sensitive.
- Alert Fatigue: Inadequate threshold tuning can generate frequent false alarms, leading teams to ignore alerts. Designing precise alerting logic requires thoughtful baseline definitions.
- Resource Constraints: Continuous monitoring and logging incur storage and compute costs. Balancing observability fidelity with cost efficiency requires careful planning.
- Interpretability Gap: Not all models provide interpretable signals. For opaque deep learning architectures, extracting meaningful observability signals demands advanced tooling or surrogate models.
Despite these challenges, thoughtful design and a phased implementation strategy can help organizations overcome obstacles and build robust observability practices that scale with their AI ambitions.
From AI Observability Challenges to Graph-Powered Insight
While the principles and best practices of AI observability are becoming clearer, many organizations still struggle with how to implement them effectively at scale. The core challenge is not the lack of metrics or dashboards, but the difficulty of connecting signals across complex, highly relational systems, a challenge that is significantly amplified with the rise of AI agents.
Modern AI systems operate across multiple layers: raw data sources, feature pipelines, model versions, prediction outputs, downstream decisions, and real-world outcomes. Increasingly, they also include AI agents whose runtime behavior is not governed by a fixed service topology, but by dynamic execution flows. A single request may trigger a variable sequence of model invocations, tool calls, and even recursive agent interactions, determined at runtime by context and intermediate results. As a result, execution traces no longer follow stable, predefined paths, but form dynamic, data-dependent execution graphs that differ from request to request.
AI observability data naturally forms a graph. Each entity in the system, such as datasets, features, models, agents, users, incidents, and remediation actions, can be represented as a node. The interactions and dependencies between them form the edges. The combination of massive data scale and continuously evolving graph structure makes it increasingly difficult to reason about system behavior using traditional observability stacks.
However, most observability platforms still store this data in siloed tables or time-series systems, optimized for static schemas and linear traces. This makes multi-hop reasoning across agents, models, data, and outcomes slow, brittle, and operationally expensive. As AI deployments grow, answering fundamental observability questions becomes increasingly difficult:
- Which upstream data or tool interactions are correlated with a specific model degradation?
- How are biased or erroneous agent decisions propagating through downstream systems?
- Which users, features, agents, or tools are repeatedly involved in anomalous behavior?
- How do agent executions, model versions, experiments, and production incidents relate over time?
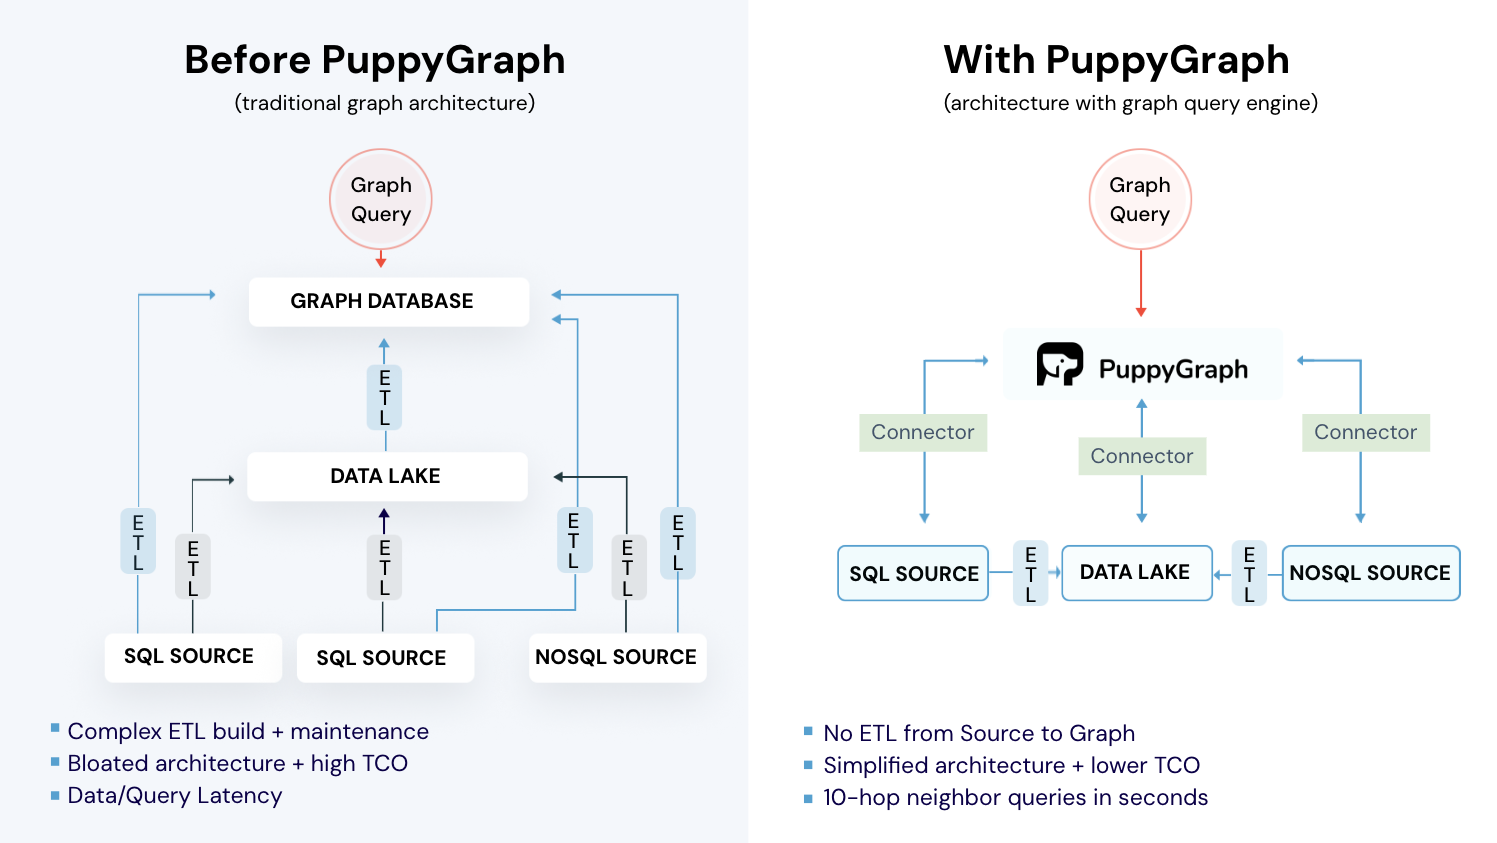
These questions are not well suited to flat tables, predefined schemas, or batch-oriented pipelines. They require real-time traversal of relationships across massive datasets, often spanning multiple storage layers, while accommodating execution graphs that cannot be fully modeled in advance. Traditional graph databases promise to address this, but introduce new trade-offs: heavy ETL pipelines, duplicated data, operational overhead, and high infrastructure costs.
This is where a graph-native approach, without the traditional graph database trade-offs, becomes critical for AI and AI agent observability at scale.
PuppyGraph addresses these challenges by enabling teams to query the rich data captured by their observability systems, including logs, metrics, traces, events, model inputs and outputs, and agent execution data, as a unified graph without moving or duplicating it. By operating as a real-time, zero-ETL graph query engine on top of relational databases and data lakes, PuppyGraph makes it practical to explore the complex, dynamic, and evolving relationships inherent in modern AI and agent-driven systems directly, interactively, and at production scale.
What is PuppyGraph

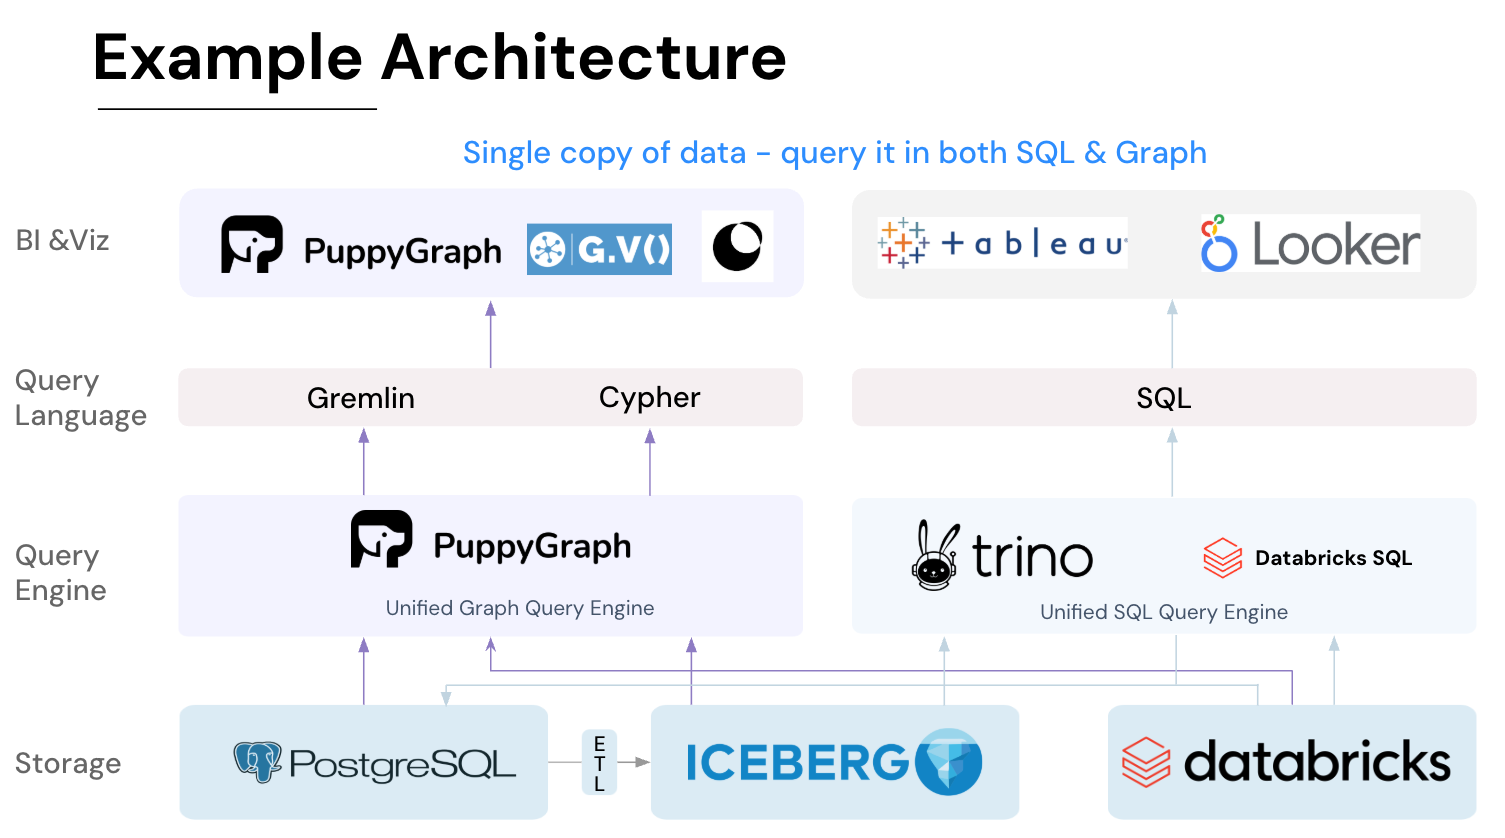
PuppyGraph is the first and only real time, zero-ETL graph query engine in the market, empowering data teams to query existing relational data stores as a unified graph model that can be deployed in under 10 minutes, bypassing traditional graph databases' cost, latency, and maintenance hurdles.
It seamlessly integrates with data lakes like Apache Iceberg, Apache Hudi, and Delta Lake, as well as databases including MySQL, PostgreSQL, and DuckDB, so you can query across multiple sources simultaneously.

Key PuppyGraph capabilities include:
- Zero ETL: PuppyGraph runs as a query engine on your existing relational databases and lakes. Skip pipeline builds, reduce fragility, and start querying as a graph in minutes.
- No Data Duplication: Query your data in place, eliminating the need to copy large datasets into a separate graph database. This ensures data consistency and leverages existing data access controls.
- Real Time Analysis: By querying live source data, analyses reflect the current state of the environment, mitigating the problem of relying on static, potentially outdated graph snapshots. PuppyGraph users report 6-hop queries across billions of edges in less than 3 seconds.
- Scalable Performance: PuppyGraph’s distributed compute engine scales with your cluster size. Run petabyte-scale workloads and deep traversals like 10-hop neighbors, and get answers back in seconds. This exceptional query performance is achieved through the use of parallel processing and vectorized evaluation technology.
- Best of SQL and Graph: Because PuppyGraph queries your data in place, teams can use their existing SQL engines for tabular workloads and PuppyGraph for relationship-heavy analysis, all on the same source tables. No need to force every use case through a graph database or retrain teams on a new query language.
- Lower Total Cost of Ownership: Graph databases make you pay twice — once for pipelines, duplicated storage, and parallel governance, and again for the high-memory hardware needed to make them fast. PuppyGraph removes both costs by querying your lake directly with zero ETL and no second system to maintain. No massive RAM bills, no duplicated ACLs, and no extra infrastructure to secure.
- Flexible and Iterative Modeling: Using metadata driven schemas allows creating multiple graph views from the same underlying data. Models can be iterated upon quickly without rebuilding data pipelines, supporting agile analysis workflows.
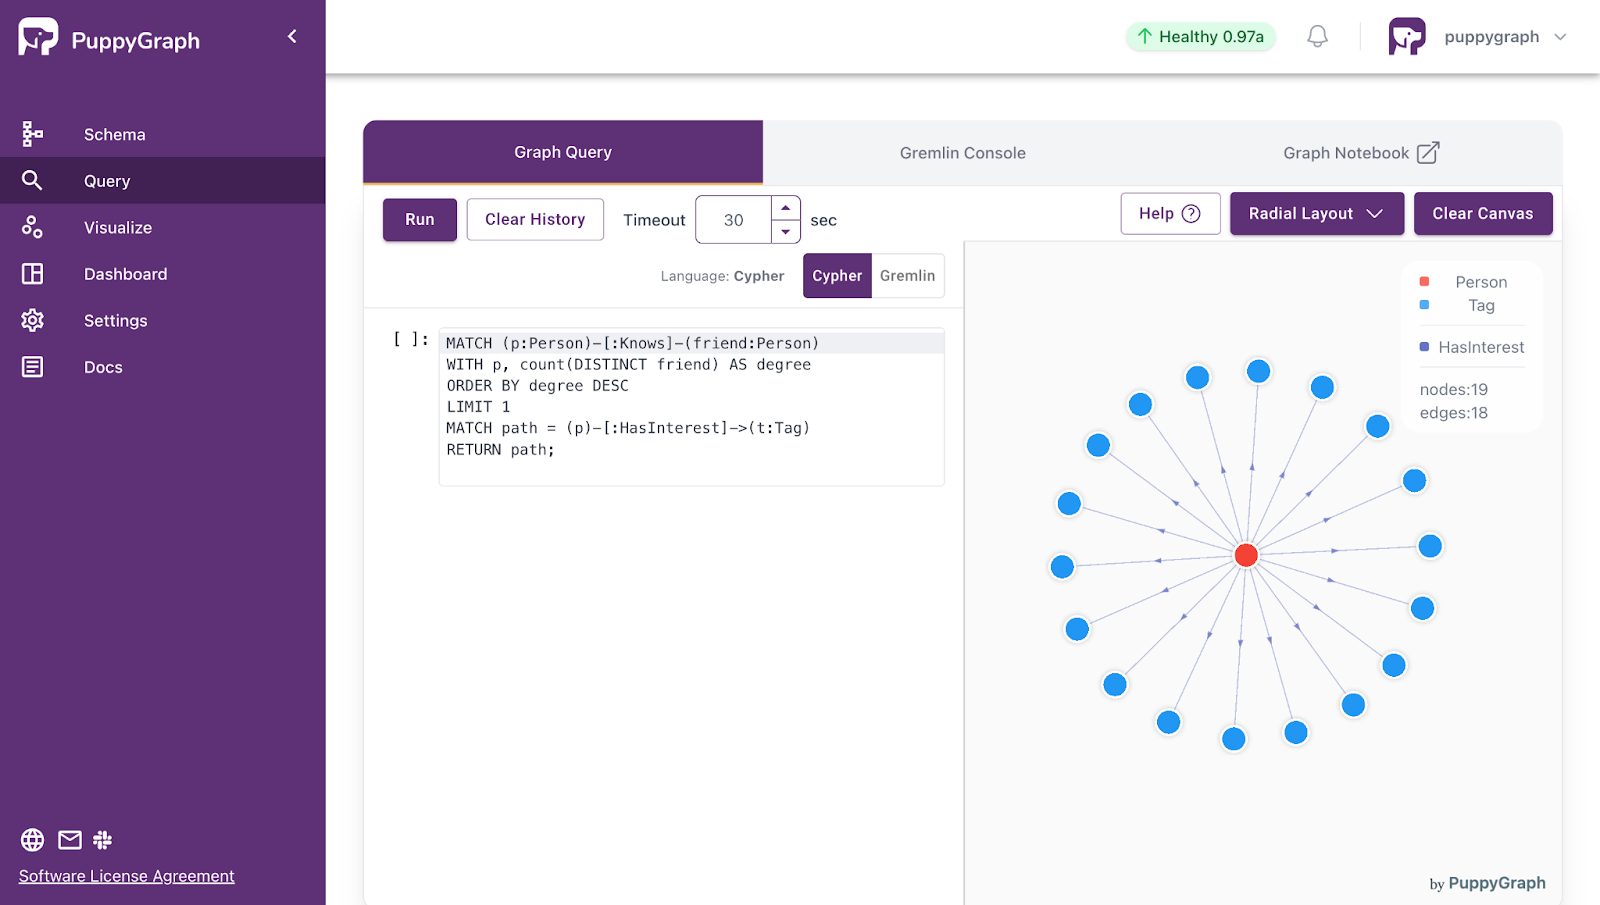
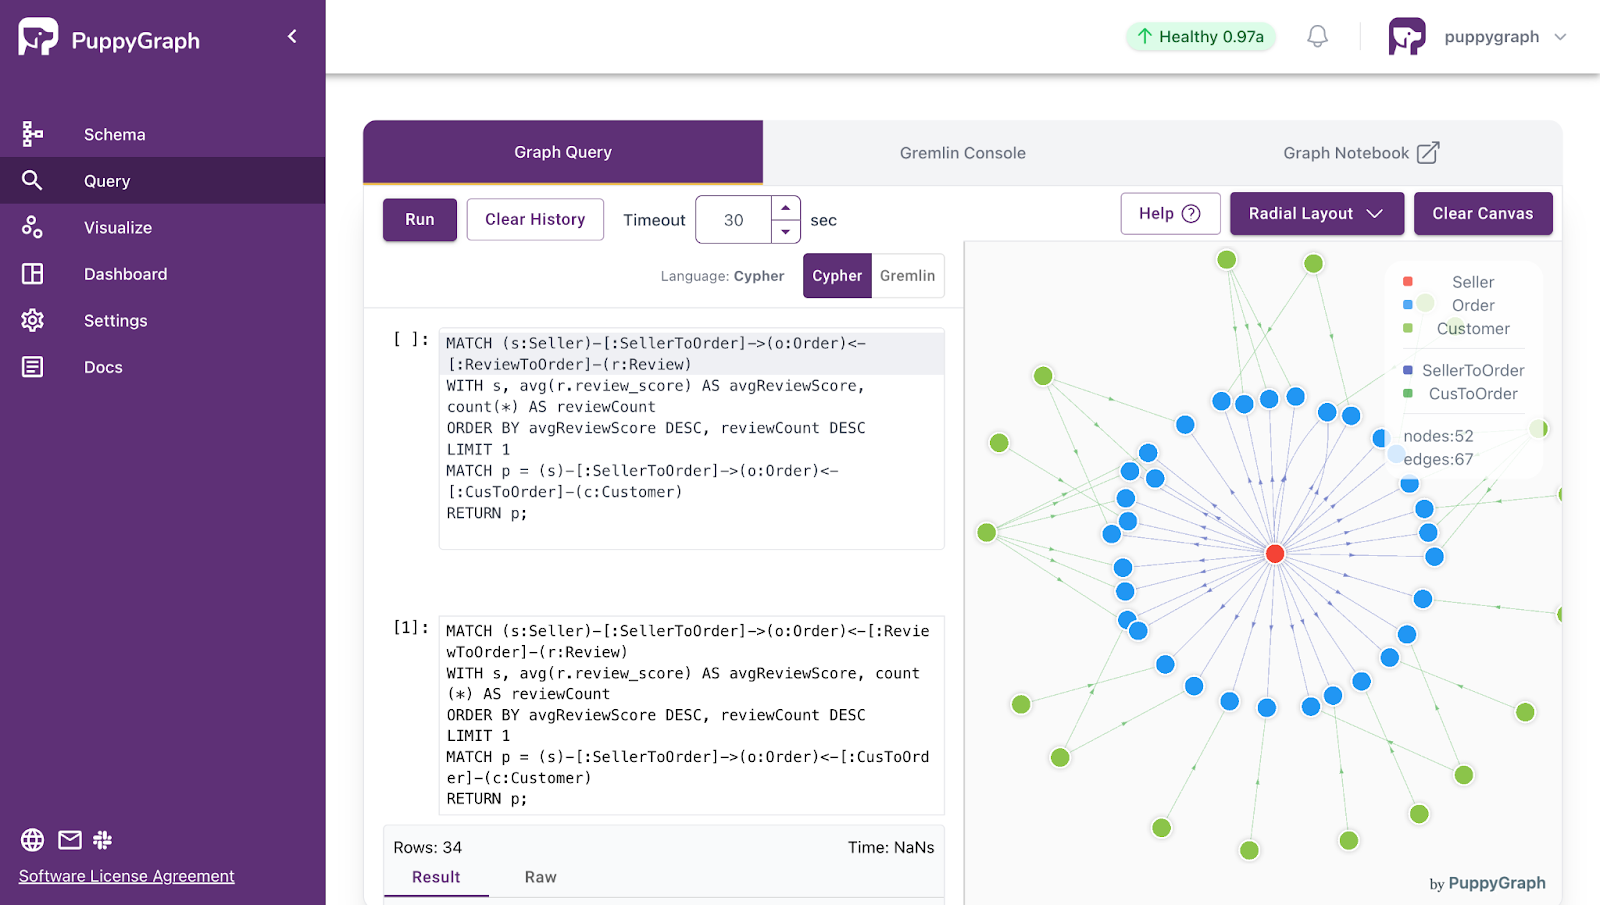
- Standard Querying and Visualization: Support for standard graph query languages (openCypher, Gremlin) and integrated visualization tools helps analysts explore relationships intuitively and effectively.
- Proven at Enterprise Scale: PuppyGraph is already used by half of the top 20 cybersecurity companies, as well as engineering-driven enterprises like AMD and Coinbase. Whether it’s multi-hop security reasoning, asset intelligence, or deep relationship queries across massive datasets, these teams trust PuppyGraph to replace slow ETL pipelines and complex graph stacks with a simpler, faster architecture.


As data grows more complex, the most valuable insights often lie in how entities relate. PuppyGraph brings those insights to the surface, whether you’re modeling organizational networks, social introductions, fraud and cybersecurity graphs, or GraphRAG pipelines that trace knowledge provenance.
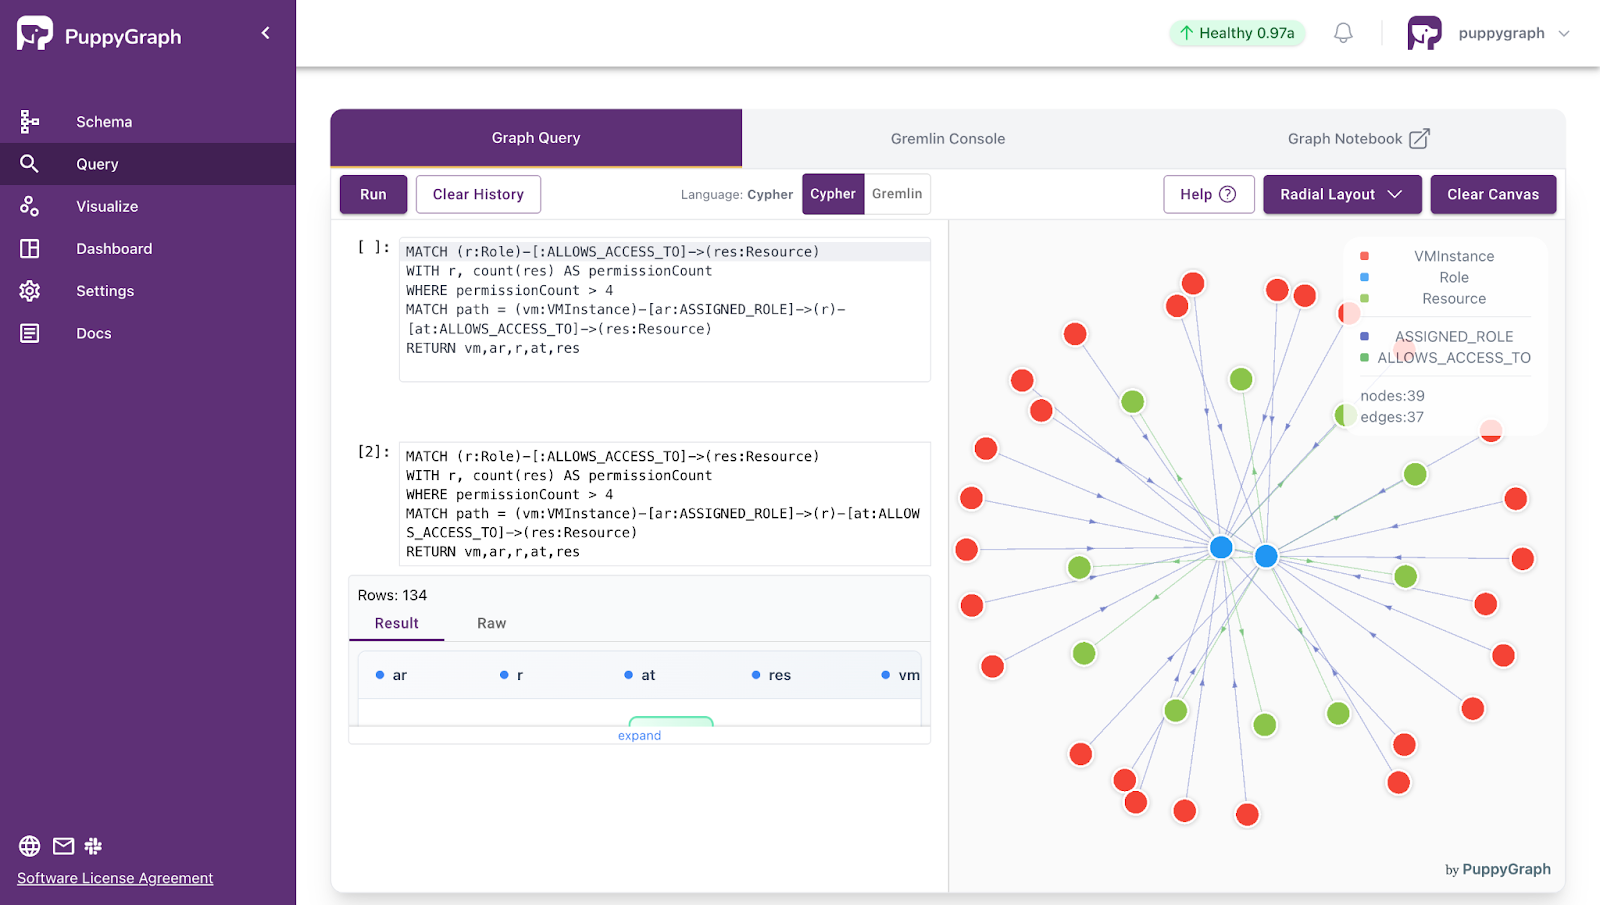
Deployment is simple: download the free Docker image, connect PuppyGraph to your existing data stores, define graph schemas, and start querying. PuppyGraph can be deployed via Docker, AWS AMI, GCP Marketplace, or within a VPC or data center for full data control.
Conclusion
AI observability is essential for ensuring that AI systems remain reliable, transparent, and aligned with business and ethical objectives. By continuously monitoring model outputs, input data quality, drift, performance metrics, and explainability signals, organizations can detect issues early, understand root causes, and maintain trust in AI-driven decisions. Effective observability bridges the gap between traditional software monitoring and the unique challenges posed by dynamic, data-driven AI models, particularly in high-stakes domains.
As AI systems become more complex and agent-driven, traditional monitoring approaches struggle to capture multi-layered dependencies and evolving execution paths. PuppyGraph offers a scalable, real-time way to traverse these relationships without heavy ETL or data duplication. By representing AI observability data as a connected graph, teams gain actionable insights into model behavior, data interactions, and operational risks, enabling proactive management and continuous improvement of AI systems at production scale.
Explore the forever-free PuppyGraph Developer Edition, or book a demo to see it in action.

Hao Wu is a Software Engineer with a strong foundation in computer science and algorithms. He earned his Bachelor’s degree in Computer Science from Fudan University and a Master’s degree from George Washington University, where he focused on graph databases.

Get started with PuppyGraph!


Developer Edition
- Forever free
- Single noded
- Designed for proving your ideas
- Available via Docker install
Enterprise Edition
- 30-day free trial with full features
- Everything in developer edition & enterprise features
- Designed for production
- Available via AWS AMI & Docker install