

What is AI Telemetry? How Does It Work?
Artificial intelligence systems are becoming deeply embedded in modern digital infrastructure, powering recommendation engines, autonomous agents, fraud detection platforms, and large language models. As these systems grow in complexity and autonomy, understanding how they behave in real-world environments becomes increasingly difficult. Traditional monitoring approaches, designed for deterministic software, often fail to capture the dynamic, probabilistic, and data-driven nature of AI systems. This gap has led to the emergence of AI telemetry as a foundational capability for managing AI in production.
AI telemetry refers to the continuous collection, processing, and analysis of signals generated by AI systems, including metrics, logs, traces, and model-specific data. These signals provide visibility into model performance, data quality, system behavior, and user interactions. By transforming raw signals into actionable insights, AI telemetry enables teams to detect anomalies, optimize performance, and ensure reliability, safety, and compliance. As organizations scale AI deployments, AI telemetry is evolving from a technical enhancement into a strategic necessity for operating intelligent systems responsibly and efficiently.
What is AI Telemetry
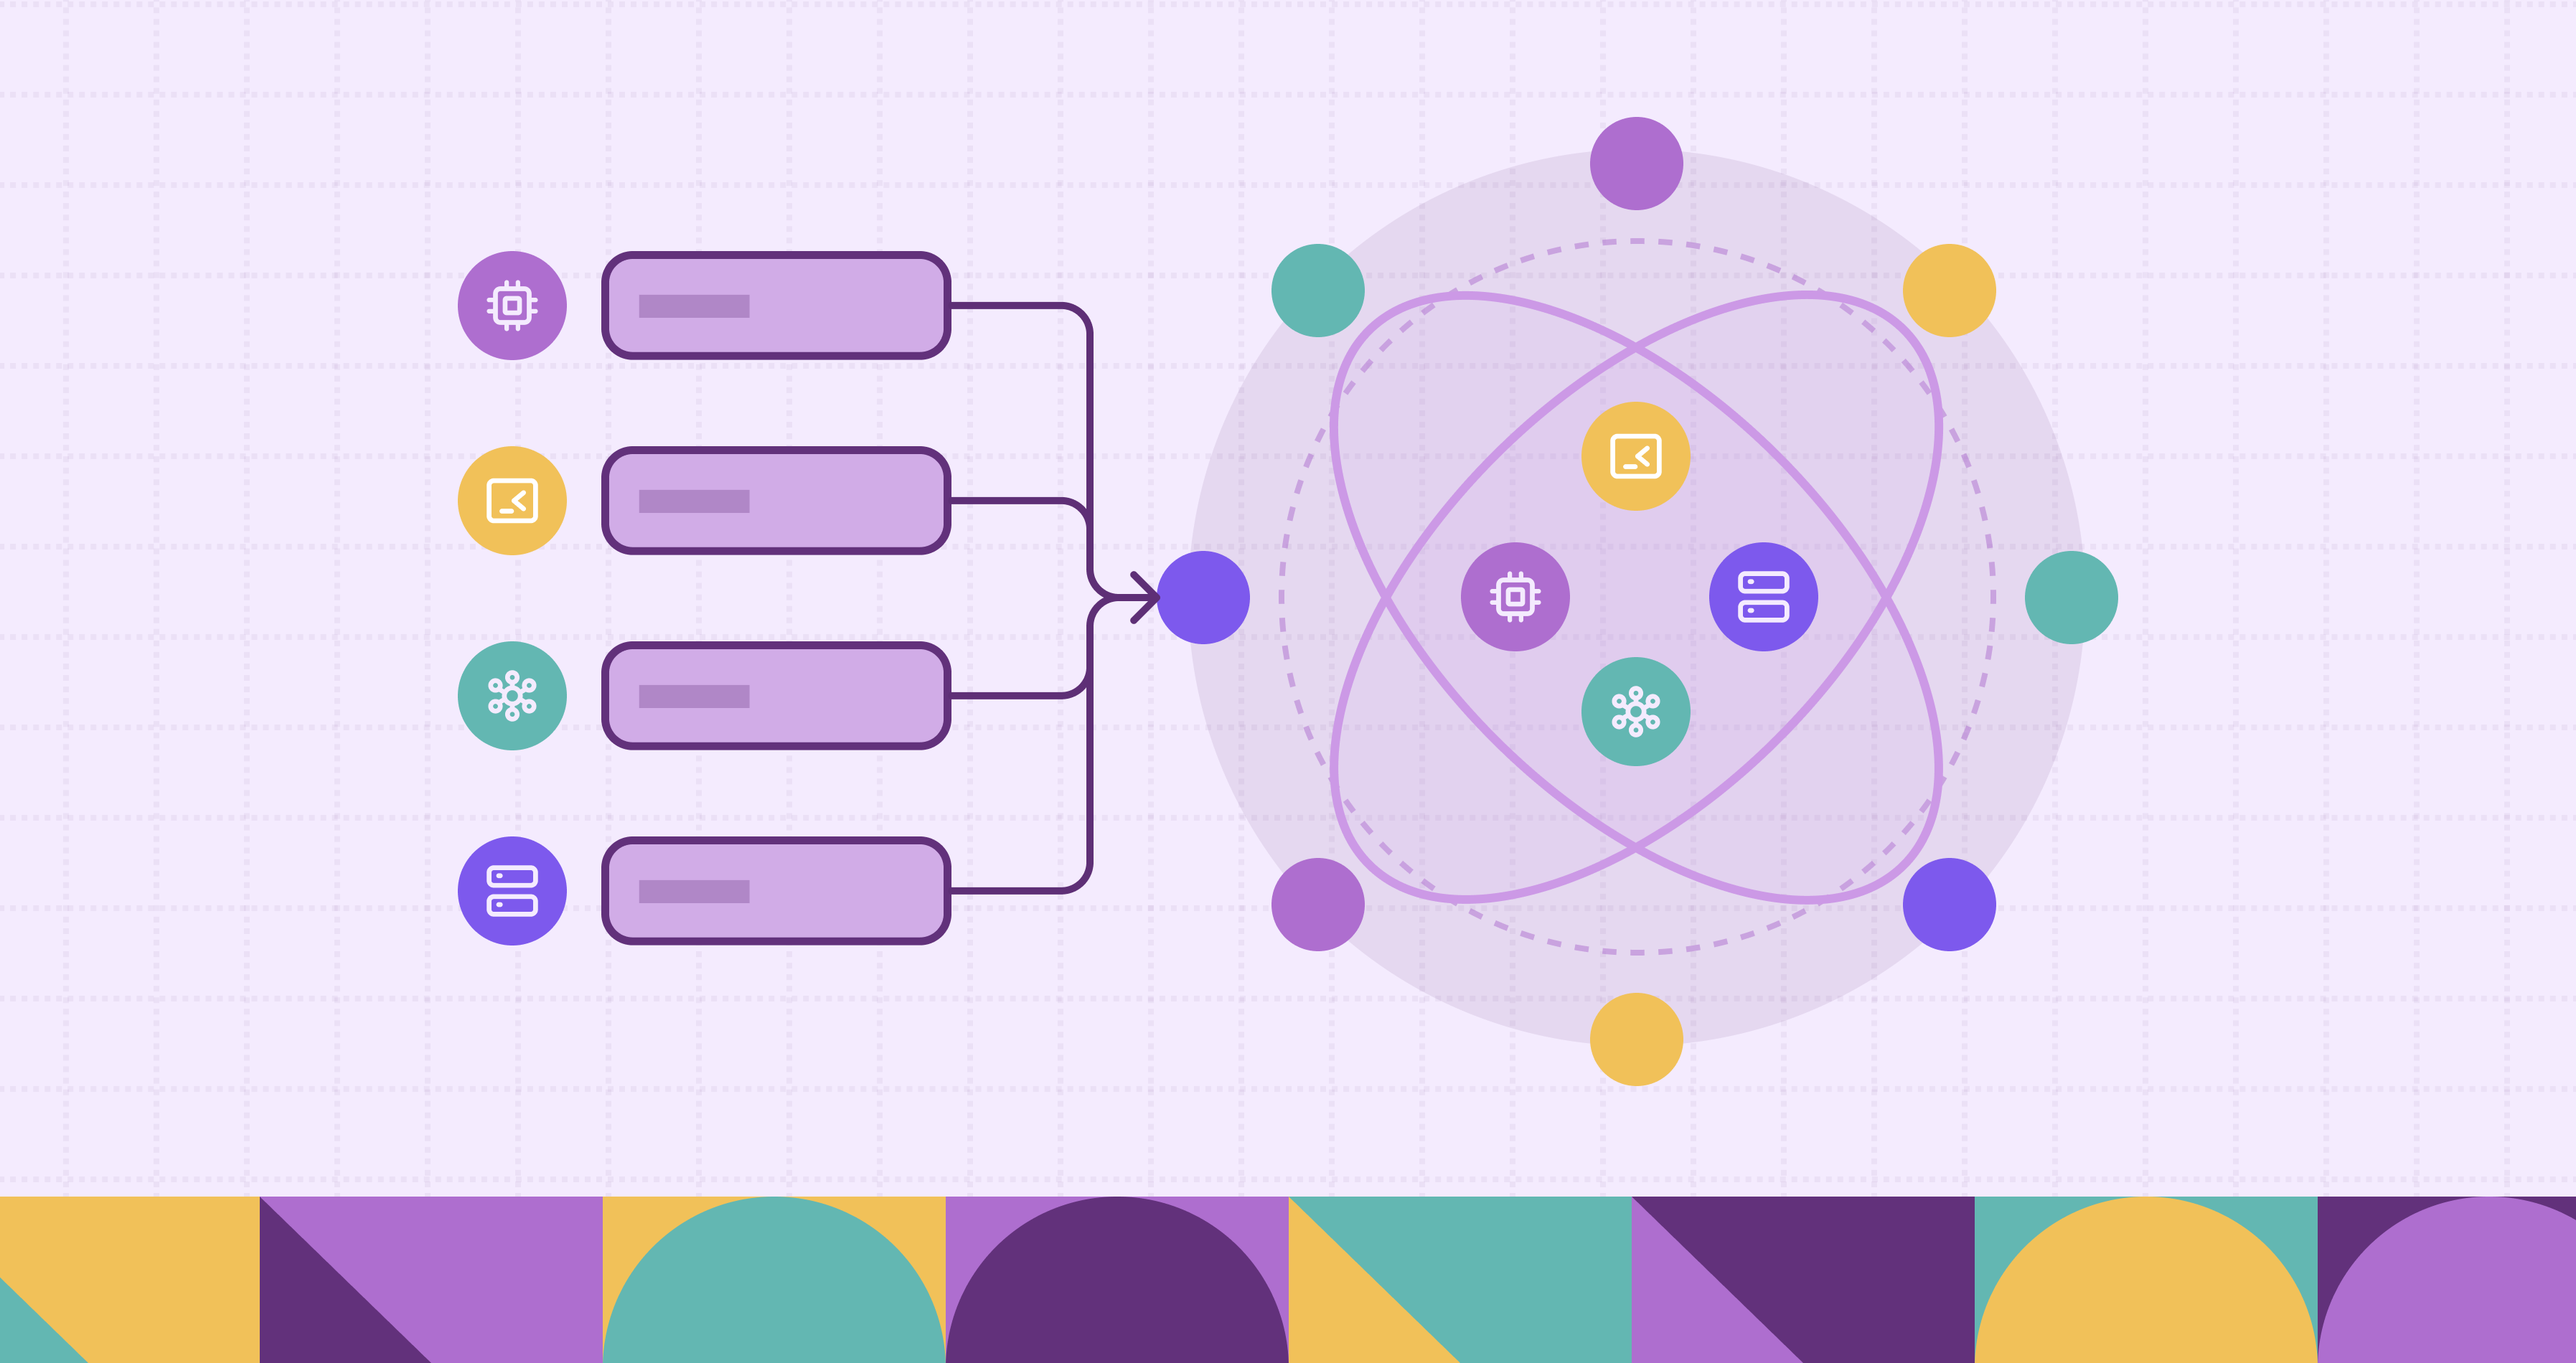
AI telemetry is the systematic instrumentation and observation of AI systems through the collection of operational and model-level signals. Unlike traditional telemetry, which focuses on infrastructure and application behavior, AI telemetry captures both computational and cognitive aspects of intelligent systems. It bridges the gap between software observability and model interpretability by exposing how models process data, make decisions, and interact with their environment.
At its core, AI telemetry transforms AI systems from opaque black boxes into measurable, observable entities. It enables engineers and data scientists to quantify model behavior, track system evolution, and correlate technical metrics with business outcomes. This is particularly important in modern AI pipelines, where models are retrained frequently, deployed across distributed environments, and integrated into complex workflows. AI telemetry thus becomes the backbone of continuous learning, operational stability, and governance in AI-driven organizations.
From a conceptual perspective, AI telemetry can be understood as a layered signal framework. At the infrastructure layer, it monitors compute resources and system performance. At the model layer, it captures predictions, confidence scores, and error distributions. At the data layer, it tracks input distributions, drift, and anomalies. Together, these layers provide a holistic view of how AI systems behave over time and under varying conditions.
Types of AI Telemetry Data
AI telemetry encompasses multiple categories of data, each representing a different dimension of system behavior. These categories reflect the hybrid nature of AI systems, which combine software engineering, data science, and machine learning. Understanding these telemetry types is essential for designing observability pipelines that capture meaningful signals rather than overwhelming teams with noise.
- Model-specific telemetry captures signals intrinsic to machine learning and generative models. These signals include embedding distributions, attention patterns, gradient statistics, loss curves, and uncertainty estimates, which reveal how models learn, represent information, and evolve over time. Model telemetry provides direct insight into model behavior and quality, enabling the detection of issues such as concept drift, bias, and performance degradation. Unlike system-level monitoring, it focuses on the internal mechanisms and dynamics of models rather than external execution characteristics.
- Agent-aware telemetry focuses on the behavioral dynamics of agentic AI systems. In such systems, execution paths are constructed dynamically through sequences of model invocations, tool calls, and inter-agent interactions. Agent telemetry captures decision flows, planning steps, branching strategies, and coordination patterns, offering visibility into how agents reason and act in complex environments. This category of telemetry is essential for understanding emergent behaviors and diagnosing failures that arise from autonomous decision-making rather than model errors or infrastructure limitations.
- System-level telemetry describes the operational performance of AI systems as distributed software services. It includes metrics such as latency, throughput, resource utilization, and error rates, as well as logs and traces that capture request lifecycles and component interactions. System telemetry provides a holistic view of system health, scalability, and reliability, supporting monitoring, debugging, and performance optimization. Beyond the internal signals of models and agents, it focuses on infrastructure and execution efficiency rather than learning dynamics or reasoning processes.
How AI Telemetry Works
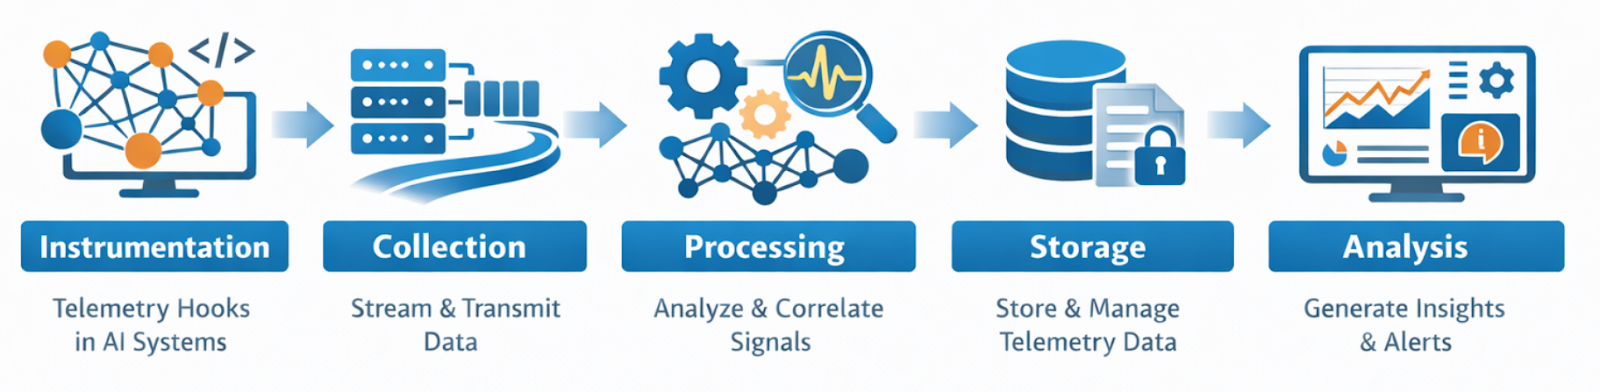
AI telemetry operates through a multi-stage pipeline that spans instrumentation, collection, processing, storage, and analysis. Each stage is designed to capture, transform, and interpret signals generated by AI systems in real time or near real time. The architecture of AI telemetry pipelines reflects the distributed and heterogeneous nature of modern AI infrastructure.
- At the instrumentation stage, AI components are augmented with telemetry hooks that emit signals during execution. These hooks may be embedded in model inference code, data pipelines, orchestration frameworks, or agent runtimes. Instrumentation must be carefully designed to balance observability with performance and privacy. Excessive instrumentation can degrade system efficiency, while insufficient instrumentation can obscure critical insights.
- At the collection stage, telemetry signals are transmitted from distributed components to centralized or federated observability platforms. This often involves message queues, streaming systems, or telemetry protocols such as OpenTelemetry. In AI systems, collection mechanisms must handle high-dimensional data, variable payload sizes, and dynamic schemas, which pose challenges beyond traditional telemetry systems.
- At the processing stage, raw telemetry signals are enriched, aggregated, and correlated. This may involve feature extraction, dimensionality reduction, anomaly detection, and semantic parsing of logs. Advanced AI telemetry platforms increasingly leverage machine learning to interpret telemetry data itself, creating a feedback loop in which AI systems help observe other AI systems.
- At the storage stage, telemetry data is persisted in specialized databases optimized for time-series data, logs, traces, and embeddings. The choice of storage architecture influences query performance, retention policies, and compliance capabilities. Because AI telemetry data can be sensitive and voluminous, organizations must design storage strategies that balance accessibility, cost, and governance.
- At the analysis stage, telemetry data is transformed into insights through dashboards, alerts, root-cause analysis tools, and automated decision systems. This stage connects technical observability with business and operational outcomes. For example, a drop in model accuracy may be correlated with revenue loss or customer churn, enabling proactive intervention.
AI Telemetry vs Traditional Application Telemetry
Traditional application telemetry emerged from the need to monitor software systems characterized by deterministic logic and predictable execution paths. It focuses on infrastructure metrics, application logs, and request traces. While these signals remain relevant for AI systems, they are insufficient for capturing the stochastic and adaptive nature of machine learning models and generative AI.
- One fundamental difference lies in the nature of system behavior. Traditional software executes predefined rules, making its behavior relatively stable across time. AI systems, by contrast, learn from data, adapt to changing environments, and exhibit probabilistic outputs. This means that telemetry must capture not only system performance but also model behavior, data dynamics, and uncertainty.
- Another key difference is the role of data. In traditional applications, data is often treated as an input that triggers deterministic logic. In AI systems, data is both an input and a driver of system evolution. Changes in data distributions can fundamentally alter model behavior, making data telemetry as important as infrastructure monitoring.
- The interpretability challenge further distinguishes AI telemetry from traditional telemetry. In software systems, errors can often be traced directly to code defects or configuration issues. In AI systems, failures may result from complex interactions between data, model architecture, and training processes. AI telemetry must therefore provide richer contextual information to support diagnosis and explanation.
- Finally, the ethical and regulatory dimensions of AI systems introduce new requirements for telemetry. Organizations must monitor fairness, bias, explainability, and compliance with data protection regulations. Traditional telemetry frameworks were not designed to address these concerns, necessitating new approaches and tools specifically tailored to AI observability.
AI Telemetry for LLMs and Generative AI
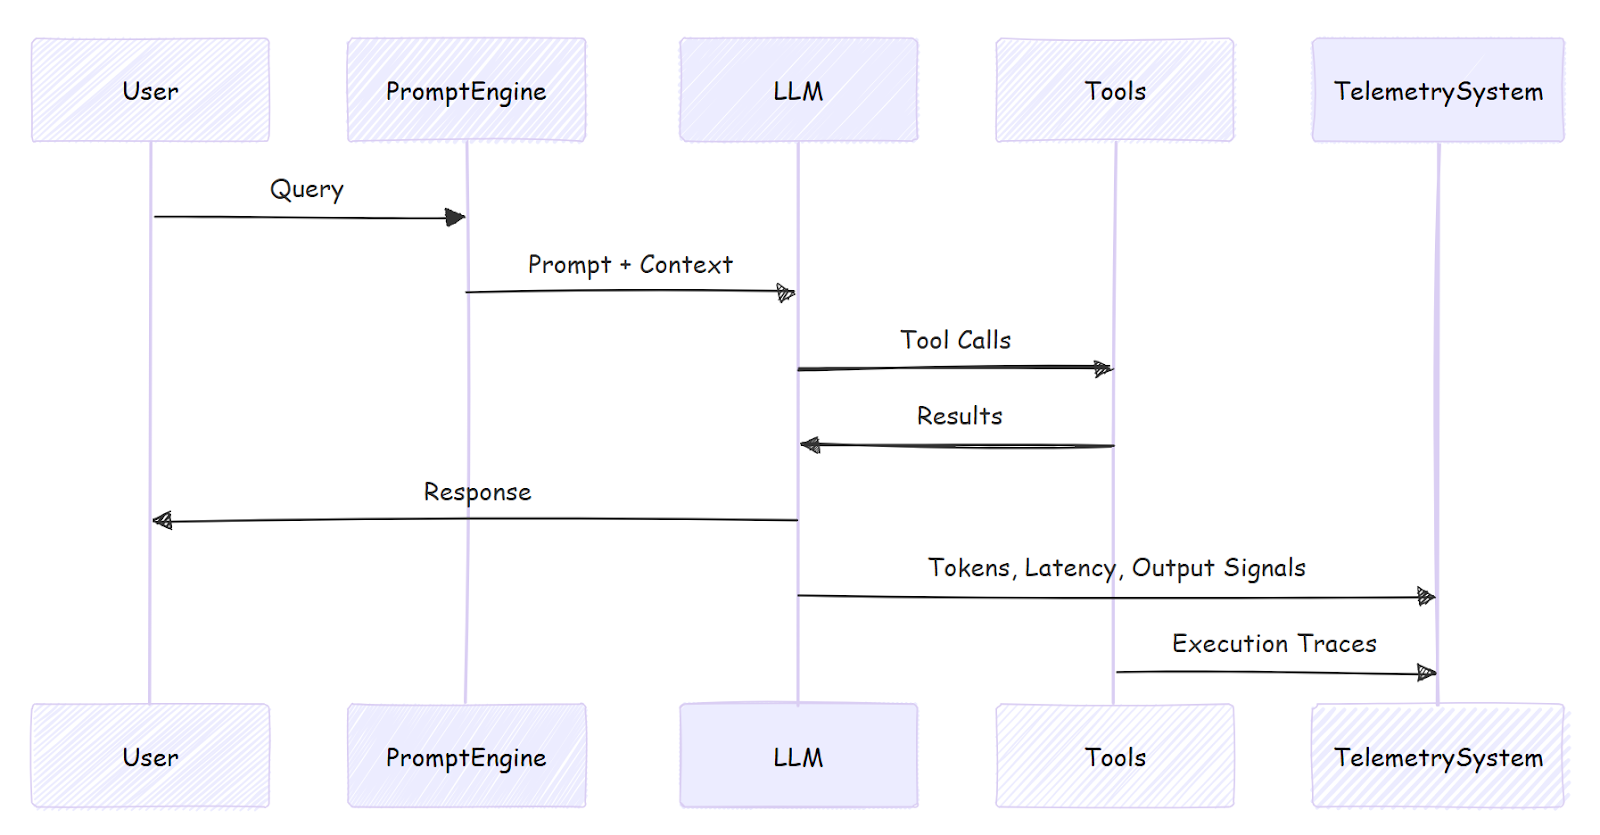
Large language models (LLMs) introduce new dimensions of complexity that fundamentally reshape telemetry requirements. Unlike traditional machine learning models, LLMs operate on natural language, generate high-dimensional outputs, and interact with users in real time. Their behavior is influenced by prompts, context windows, and orchestration logic, making observability particularly challenging.
In LLM-centric systems, telemetry must capture prompt structures, token-level outputs, latency distributions, and resource consumption. These signals help teams understand how models respond to different inputs and how performance varies across workloads. Token usage metrics, for example, are critical for cost management and capacity planning in large-scale deployments.
Another distinctive aspect of LLM telemetry is semantic evaluation. Unlike numeric predictions, LLM outputs must often be interpreted qualitatively. Telemetry pipelines therefore increasingly incorporate natural language analysis techniques to classify responses, detect hallucinations, measure toxicity, and assess alignment with policies. This introduces a new layer of AI-driven telemetry, where models are used to observe and evaluate other models.
Generative AI extends beyond LLMs to include multimodal models such as image, audio, and video generators. However, in practice, LLMs remain the dominant architectural core of most generative AI systems. For this reason, LLM telemetry represents the primary foundation of observability in modern generative AI platforms, while multimodal telemetry can be viewed as an extension of the same principles.
AI Telemetry for Agents and Multi-Agent Systems
As AI systems evolve from single-model inference toward autonomous agents, telemetry requirements become significantly more complex. Agentic systems are not only driven by model outputs but also by goals, memory, environment interactions, and long-running decision processes. Compared with LLM-based applications, agents introduce additional layers of behavioral, temporal, and organizational complexity.
In single-agent systems, telemetry focuses on decision-making processes, action sequences, and feedback loops. Agents often operate in partially observable environments, making their behavior dependent on internal states and memory. Telemetry must therefore track state transitions, reward signals, and policy updates over time.
In multi-agent systems, telemetry expands from individual behavior to collective dynamics. Agents may collaborate, compete, or negotiate to achieve shared or conflicting objectives. Telemetry must capture communication patterns, coordination mechanisms, and system-level performance metrics. These signals are essential for understanding emergent behavior that cannot be inferred from isolated agents.
A further challenge in agent telemetry is temporal complexity. Agent interactions often unfold over extended time horizons, with delayed rewards and cascading effects. Traditional telemetry systems, optimized for short-lived requests, struggle to represent such long-term dependencies. Specialized tracing, correlation, and causal analysis techniques are therefore required.
Beyond technical observability, telemetry plays a critical governance role in agentic systems. Autonomous agents can produce unintended actions with significant consequences. Telemetry provides audit trails that enable organizations to reconstruct decision processes and assign accountability. This capability is essential for deploying agents in safety-critical domains such as finance, healthcare, and autonomous systems.
Challenges in Implementing AI Telemetry
Despite its importance, implementing AI telemetry presents significant technical, organizational, and ethical challenges. These challenges arise from the inherent complexity of AI systems and the scale at which they operate.
- One major challenge is data volume. AI systems generate high-dimensional telemetry data at scale, including embeddings, logs, traces, and metrics. Storing and processing this data can be costly and technically demanding. Organizations must design efficient sampling, aggregation, and compression strategies to make telemetry sustainable.
- Another challenge is signal relevance. Not all telemetry data is equally valuable, and excessive instrumentation can overwhelm teams with noise. Determining which signals to capture requires a deep understanding of system behavior and business objectives. This often involves iterative refinement of telemetry schemas and observability practices.
- Privacy and security concerns also complicate AI telemetry. Telemetry data may contain sensitive information, including personal data, proprietary models, and confidential prompts. Organizations must implement robust anonymization, access control, and compliance mechanisms to mitigate risks. Balancing observability with privacy is a persistent tension in AI telemetry design.
- Interoperability is another challenge. AI systems often integrate diverse frameworks, platforms, and tools, each with its own telemetry formats and protocols. Achieving unified observability requires standardization and integration across heterogeneous ecosystems. Emerging standards such as OpenTelemetry offer promising foundations but require adaptation to AI-specific use cases.
From AI Telemetry to Graph-Centric Intelligence
As AI systems become increasingly interconnected, the signals captured by AI telemetry no longer represent isolated events. Instead, they reflect complex relationships among data pipelines, models, users, agents, and infrastructure components. Metrics, logs, traces, and model signals form evolving dependency networks rather than independent records. Understanding these relationships is essential for diagnosing failures, explaining model behavior, and optimizing system performance in modern AI environments.
In this context, graph-based approaches emerge as a natural and powerful abstraction. By representing telemetry entities as nodes and their interactions as relationships, graphs provide a unified model for capturing multi-hop dependencies, causal chains, and dynamic interactions across distributed AI systems. Engineers can use graph representations to explore questions such as how model outputs depend on upstream data sources, how agent decisions propagate through tool chains, and how anomalies arise from interactions among multiple components. In this way, graphs transform fragmented telemetry signals into coherent system intelligence.
However, traditional observability tools are fundamentally designed for linear or tabular data models. They excel at aggregating metrics, indexing logs, and visualizing traces, but they struggle to represent relational structures and cross-component dependencies. As AI pipelines grow more complex, this limitation becomes increasingly evident. Teams can collect massive volumes of telemetry data, yet lack an effective way to model, query, and reason about the underlying relationships embedded within that data. This creates a critical gap between data collection and system understanding.
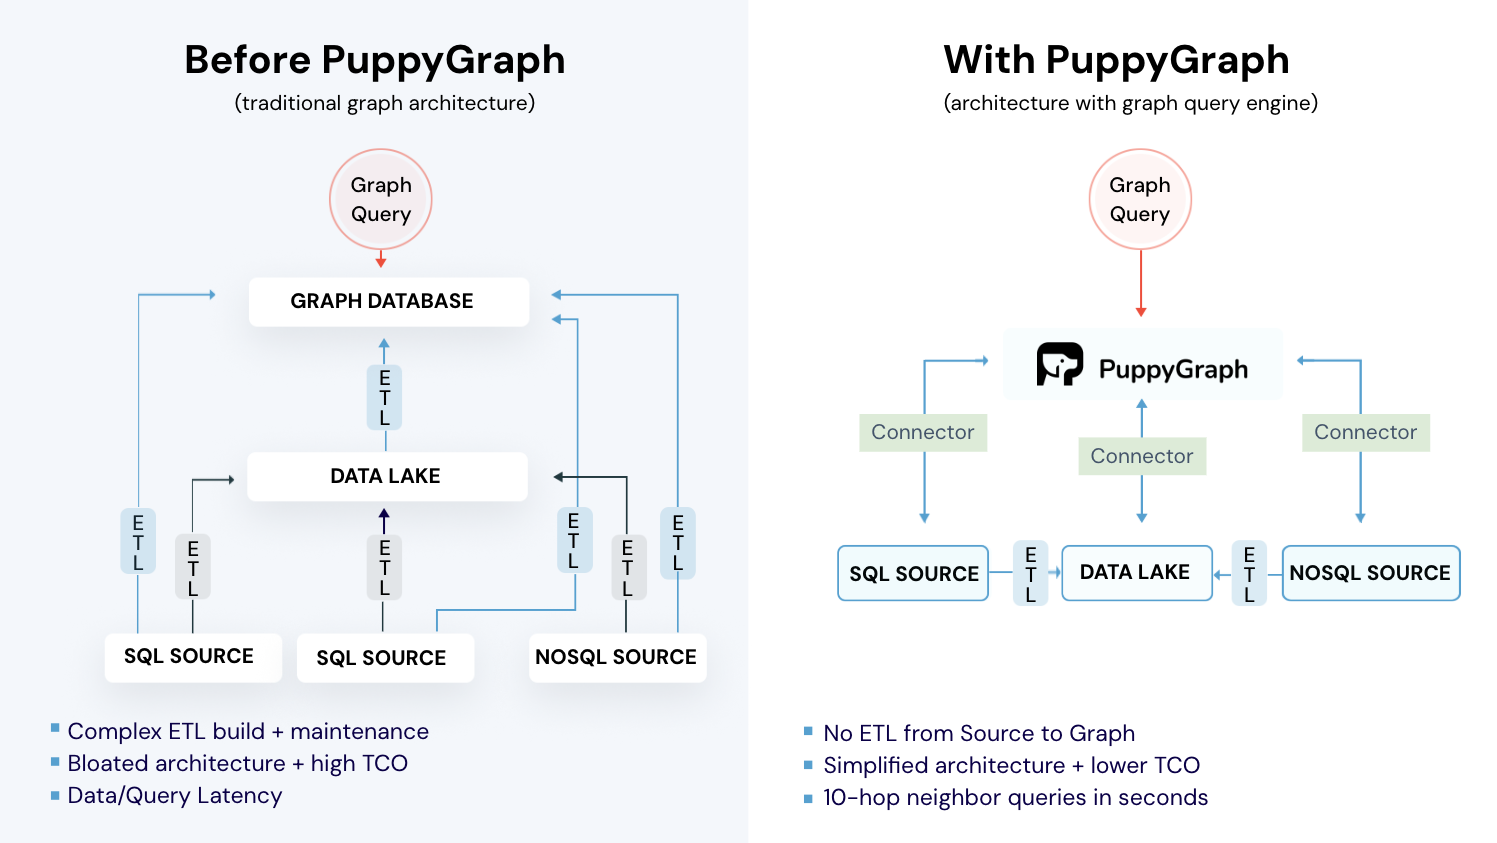
At the same time, integrating graph analytics into AI observability workflows has historically been expensive and operationally complex. Conventional approaches often require heavy ETL pipelines, data duplication, and specialized graph databases, making real-time graph reasoning difficult to achieve at scale. To fully unlock the potential of AI telemetry, organizations need a graph engine that can operate directly on existing data infrastructure, deliver low-latency insights, and scale with modern AI workloads.
This is precisely the role that PuppyGraph is designed to play.

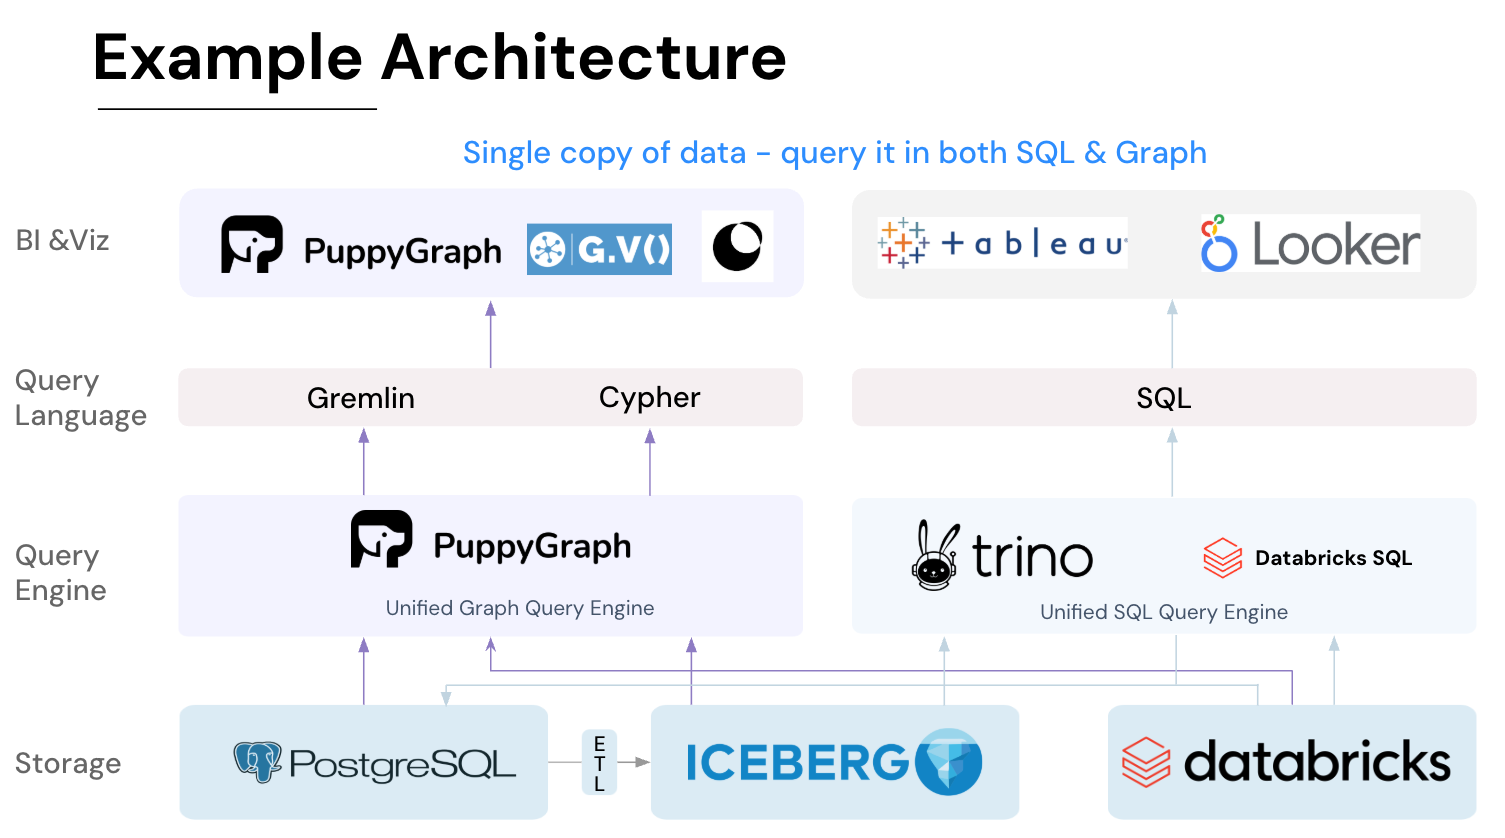
PuppyGraph is the first and only real time, zero-ETL graph query engine in the market, empowering data teams to query existing relational data stores as a unified graph model that can be deployed in under 10 minutes, bypassing traditional graph databases' cost, latency, and maintenance hurdles.
It seamlessly integrates with data lakes like Apache Iceberg, Apache Hudi, and Delta Lake, as well as databases including MySQL, PostgreSQL, and DuckDB, so you can query across multiple sources simultaneously.

Key PuppyGraph capabilities include:
- Zero ETL: PuppyGraph runs as a query engine on your existing relational databases and lakes. Skip pipeline builds, reduce fragility, and start querying as a graph in minutes.
- No Data Duplication: Query your data in place, eliminating the need to copy large datasets into a separate graph database. This ensures data consistency and leverages existing data access controls.
- Real Time Analysis: By querying live source data, analyses reflect the current state of the environment, mitigating the problem of relying on static, potentially outdated graph snapshots. PuppyGraph users report 6-hop queries across billions of edges in less than 3 seconds.
- Scalable Performance: PuppyGraph’s distributed compute engine scales with your cluster size. Run petabyte-scale workloads and deep traversals like 10-hop neighbors, and get answers back in seconds. This exceptional query performance is achieved through the use of parallel processing and vectorized evaluation technology.
- Best of SQL and Graph: Because PuppyGraph queries your data in place, teams can use their existing SQL engines for tabular workloads and PuppyGraph for relationship-heavy analysis, all on the same source tables. No need to force every use case through a graph database or retrain teams on a new query language.
- Lower Total Cost of Ownership: Graph databases make you pay twice — once for pipelines, duplicated storage, and parallel governance, and again for the high-memory hardware needed to make them fast. PuppyGraph removes both costs by querying your lake directly with zero ETL and no second system to maintain. No massive RAM bills, no duplicated ACLs, and no extra infrastructure to secure.
- Flexible and Iterative Modeling: Using metadata driven schemas allows creating multiple graph views from the same underlying data. Models can be iterated upon quickly without rebuilding data pipelines, supporting agile analysis workflows.
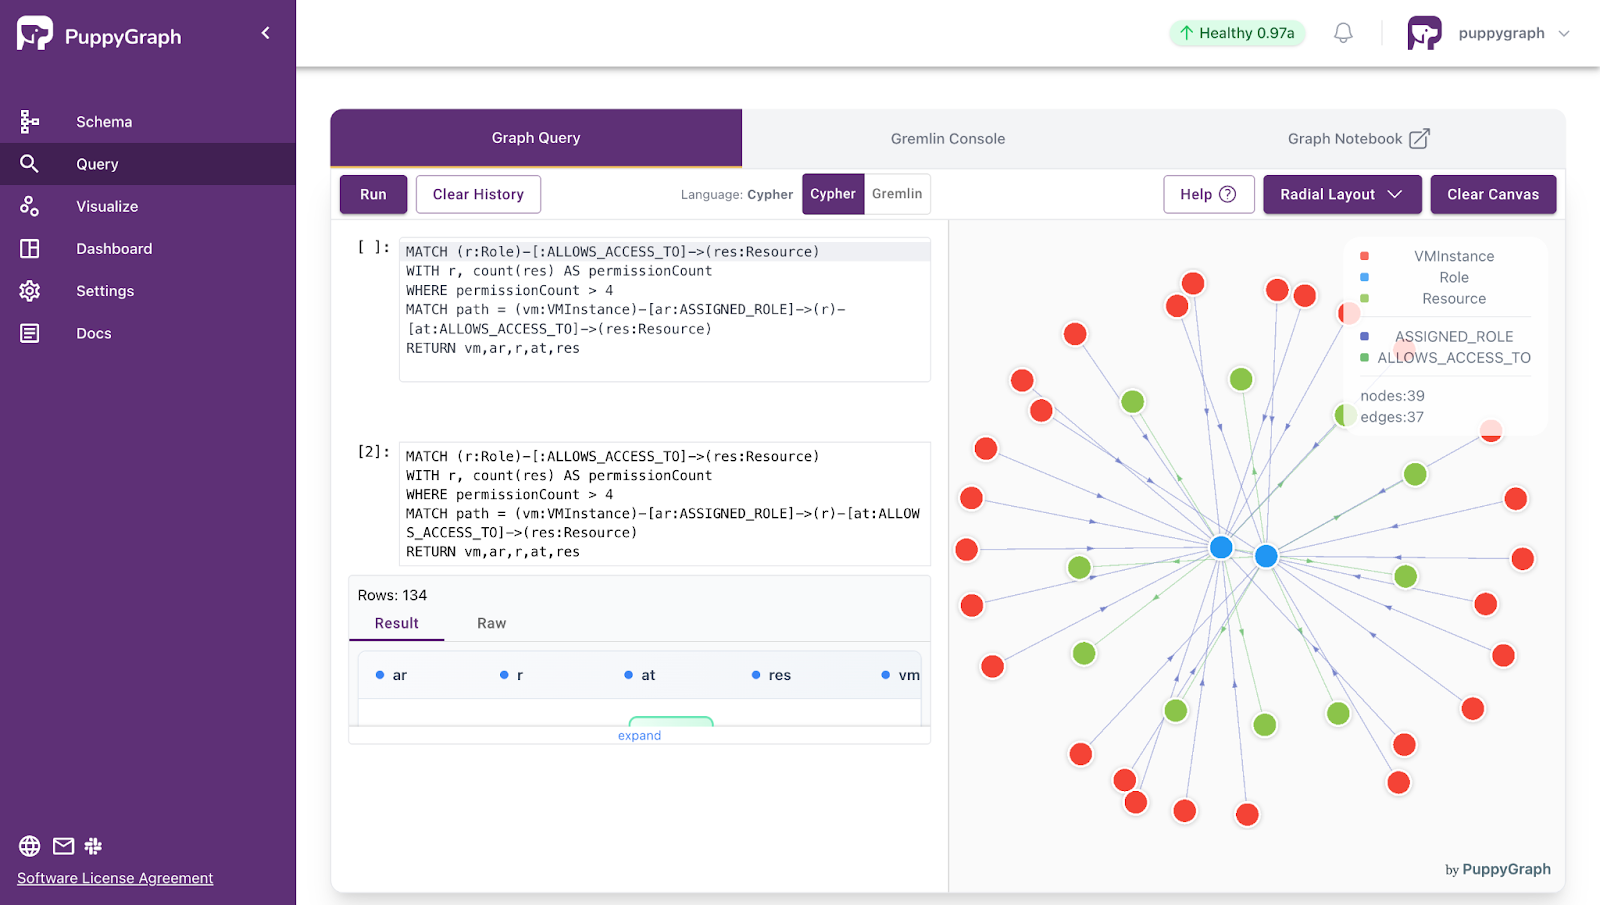
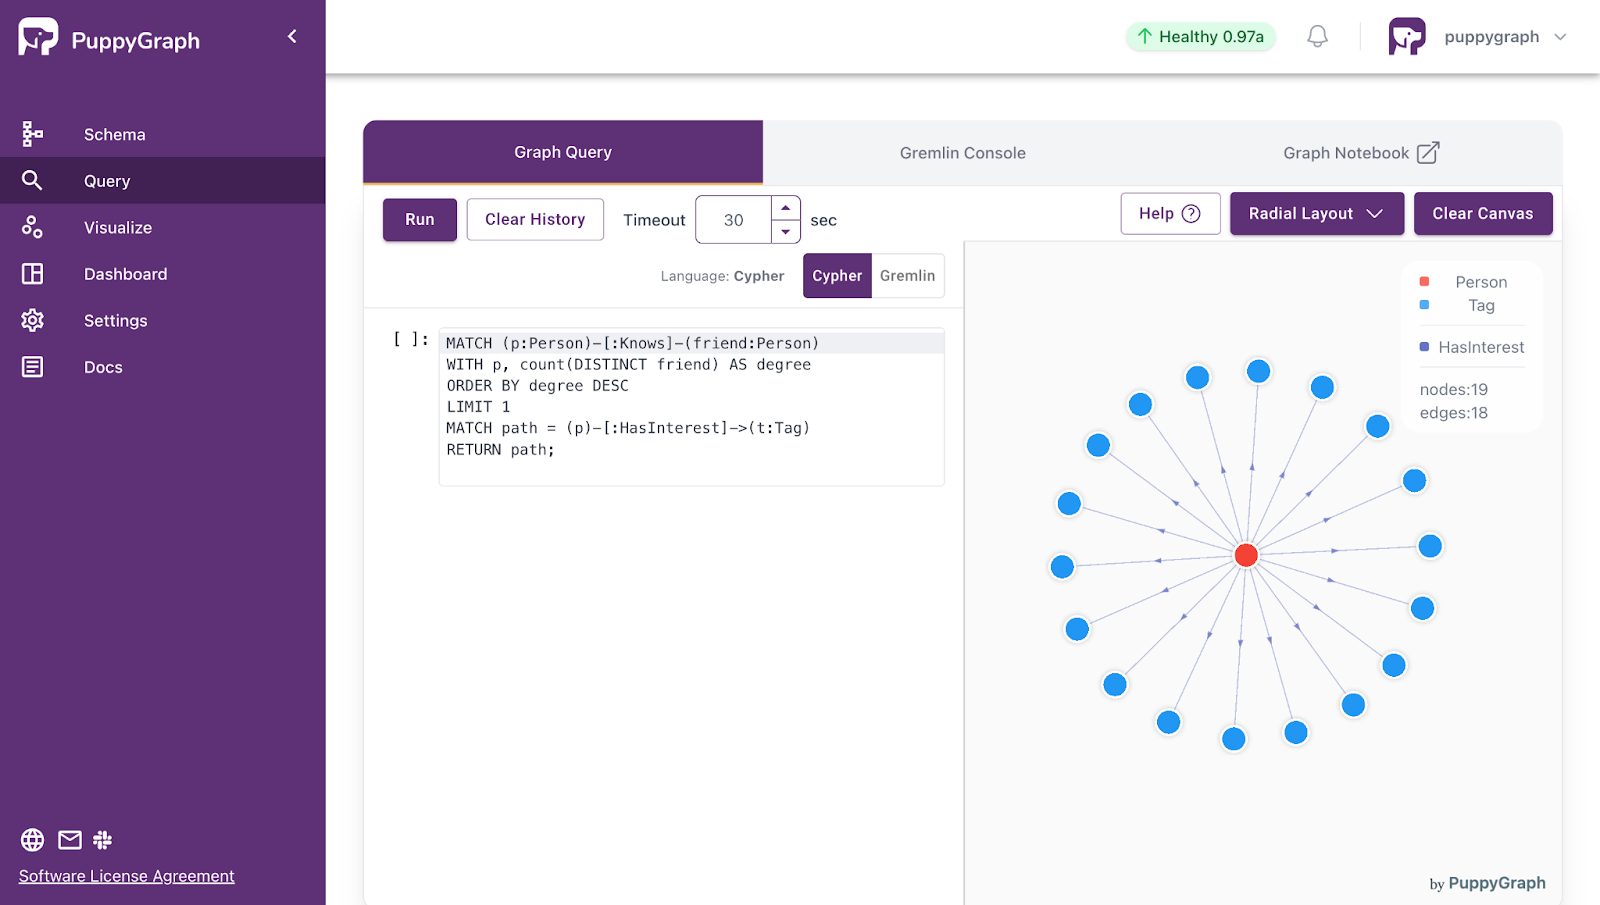
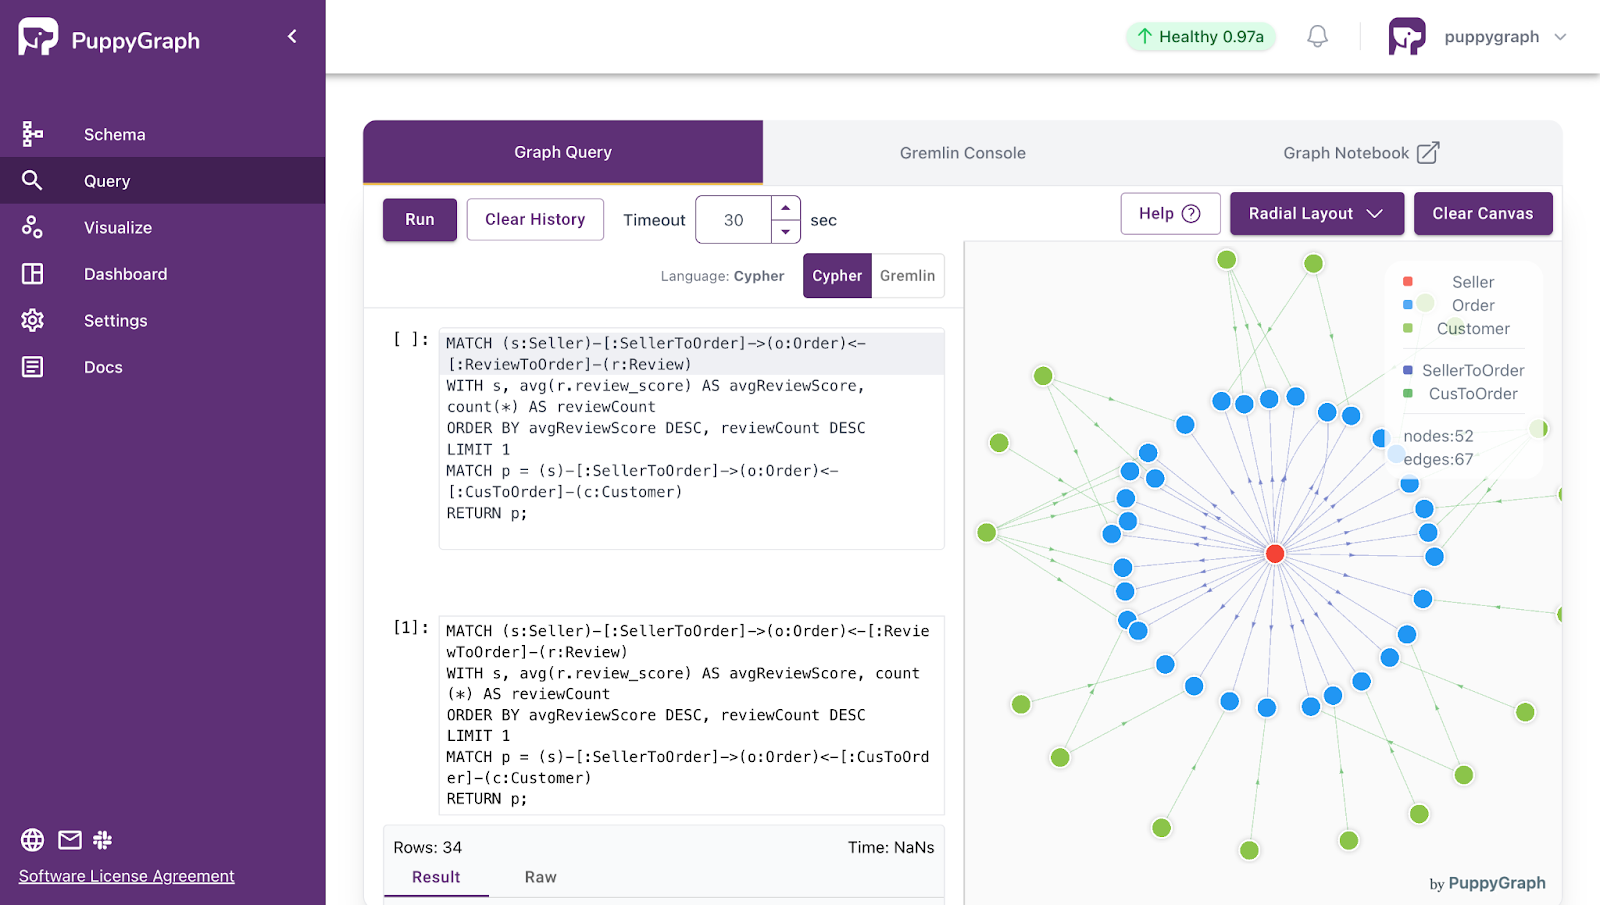
- Standard Querying and Visualization: Support for standard graph query languages (openCypher, Gremlin) and integrated visualization tools helps analysts explore relationships intuitively and effectively.
- Proven at Enterprise Scale: PuppyGraph is already used by half of the top 20 cybersecurity companies, as well as engineering-driven enterprises like AMD and Coinbase. Whether it’s multi-hop security reasoning, asset intelligence, or deep relationship queries across massive datasets, these teams trust PuppyGraph to replace slow ETL pipelines and complex graph stacks with a simpler, faster architecture.

Figure: PuppyGraph in-production clients

As data grows more complex, the most valuable insights often lie in how entities relate. PuppyGraph brings those insights to the surface, whether you’re modeling organizational networks, social introductions, fraud and cybersecurity graphs, or GraphRAG pipelines that trace knowledge provenance.
Deployment is simple: download the free Docker image, connect PuppyGraph to your existing data stores, define graph schemas, and start querying. PuppyGraph can be deployed via Docker, AWS AMI, GCP Marketplace, or within a VPC or data center for full data control.
Conclusion
AI telemetry is rapidly becoming a critical capability for understanding, monitoring, and governing modern AI systems. By capturing signals across infrastructure, models, data, and agents, telemetry transforms opaque AI pipelines into observable, measurable systems. This enables teams to detect anomalies, optimize performance, ensure fairness, and maintain compliance in real time, supporting both operational stability and continuous learning. As AI systems grow more complex and autonomous, traditional monitoring approaches are insufficient, making AI telemetry a strategic necessity rather than a technical convenience.
PuppyGraph extends AI telemetry by modeling relationships among telemetry signals, data, and system components as a unified graph. By enabling real-time, zero-ETL graph queries across diverse data sources, PuppyGraph allows organizations to analyze multi-hop dependencies, trace decision paths, and extract actionable insights without costly data duplication. This combination of AI telemetry and graph intelligence empowers enterprises to operate intelligent systems responsibly, efficiently, and at scale.
Explore the forever-free PuppyGraph Developer Edition, or book a demo to see it in action.

Hao Wu is a Software Engineer with a strong foundation in computer science and algorithms. He earned his Bachelor’s degree in Computer Science from Fudan University and a Master’s degree from George Washington University, where he focused on graph databases.

Get started with PuppyGraph!


Developer Edition
- Forever free
- Single noded
- Designed for proving your ideas
- Available via Docker install
Enterprise Edition
- 30-day free trial with full features
- Everything in developer edition & enterprise features
- Designed for production
- Available via AWS AMI & Docker install