

What is Asset Graph?
Managing the full landscape of devices, users, applications, identities, and cloud workloads has become a complex task. Simply having a list of assets is no longer sufficient, what matters is understanding how those assets relate to one another, how they interact, and what potential attack surface they create. That’s where the concept of an asset graph comes into play. By modelling assets and their relationships as nodes and edges in a graph, security and IT teams gain a richer, more intuitive view of their environment. In this article we will explain what an asset graph is, why it matters in modern security, the core components, how it works, some use cases, how it differs from traditional asset inventory, the challenges and considerations for implementation, and then draw conclusions about its value.
What Is an Asset Graph
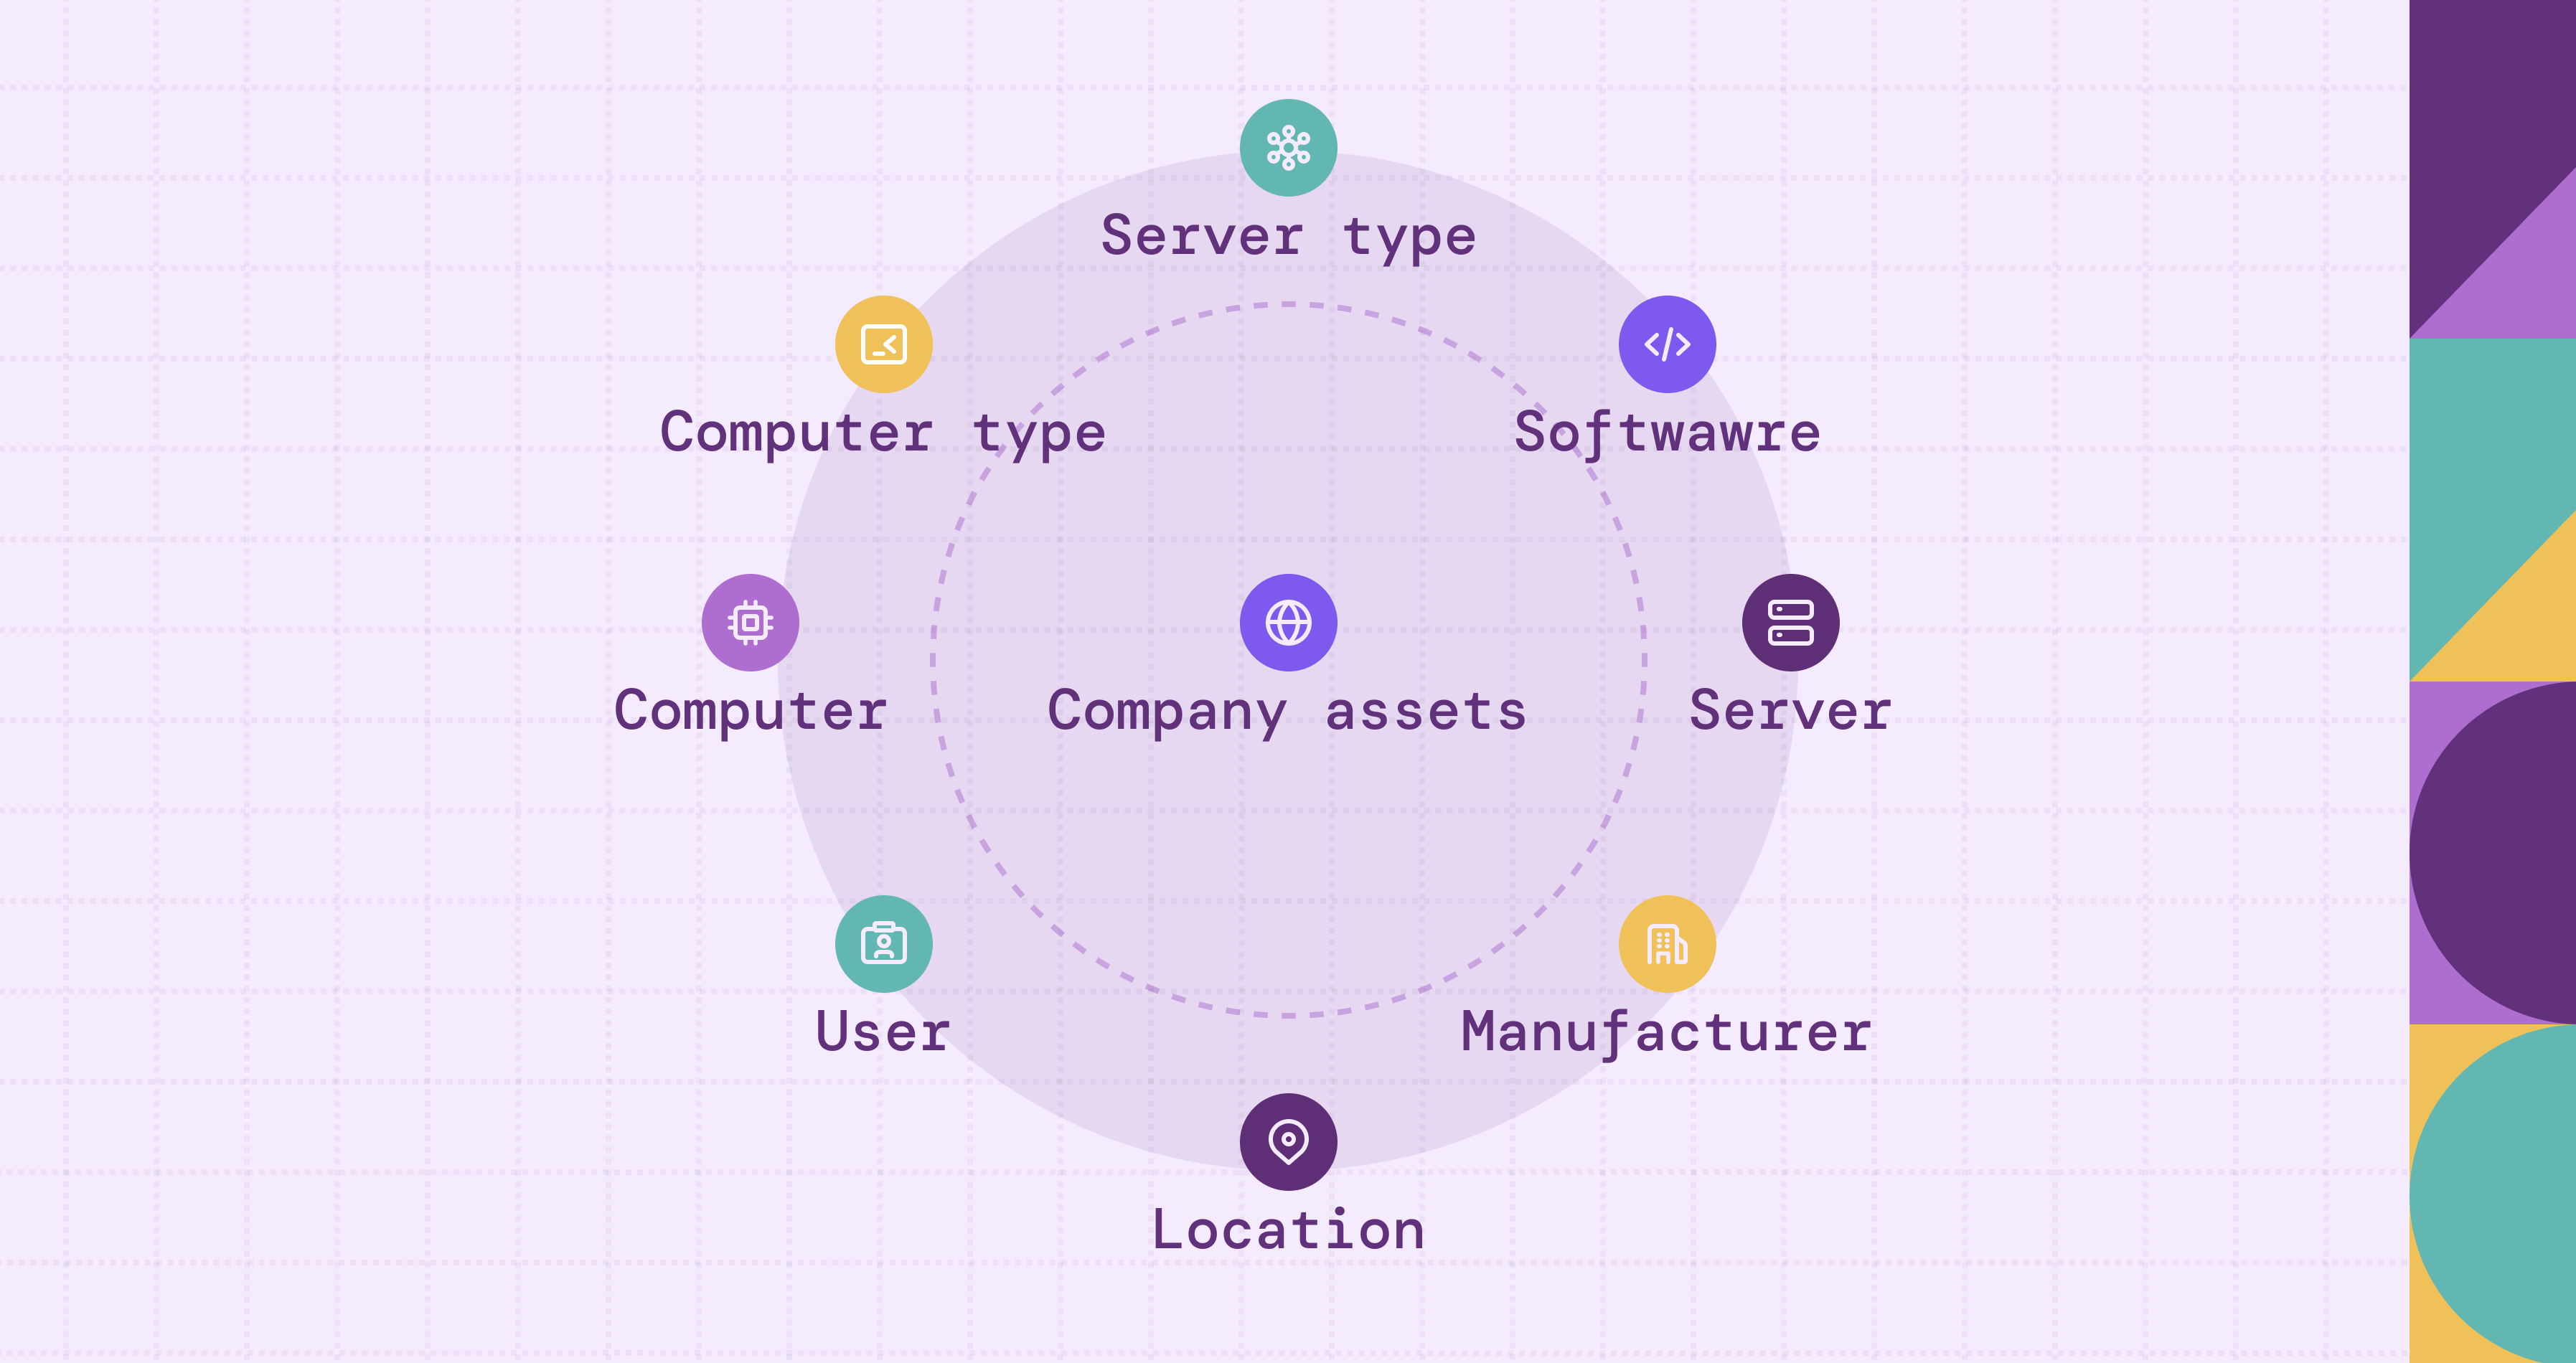
An asset graph represents an organization’s digital assets, such as devices, users, services, cloud workloads, applications, and identities, and the relationships or interactions between them in a graph structure (nodes = assets, edges = relationships).
.png)
For example, a device node may connect to a user node who operates it, or a cloud workload node may link to storage buckets, network segments, or identities that access it. This model goes beyond listing assets; it reveals how assets are connected and how these connections can form potential risk or attack pathways. An asset graph also updates dynamically to reflect changes across the environment, new devices, identities, configuration updates, access modifications, and cross-cloud relationships.
In essence, an asset graph is not merely an inventory; it is a relational map of the organization’s digital estate, designed to deliver security- and risk-oriented insights.
Why Asset Graphs Matter in Modern Security
There are several reasons asset graphs have become increasingly important in modern security operations:
- Complex and dynamic attack surfaces
Assets are no longer isolated: cloud, hybrid environments, IoT, mobile devices, and multi-cloud deployments create highly interconnected systems. Attack paths can traverse identities, devices, workloads, network segments, and services. Asset graphs visualize these non-linear relationships, helping identify exposure points. - Improved visibility and context
Traditional inventories show the existence of devices or accounts, but graphs reveal how assets connect, who uses them, and what services they touch. This enables prioritization, remediation, and answering questions like: if this user is compromised, what assets will they affect? - Fewer blind spots and better risk management
Some inventories miss up to 40% of assets, creating blind spots. Asset graphs correlate multiple data sources, deduplicate entries, and reveal unmanaged or unknown assets, allowing teams to reduce exposure. - Faster investigation and response
Graphs accelerate incident response by tracing asset connections after a compromise, vulnerability, or misconfiguration. - Proactive security posture management
Beyond reactive measures, asset graphs enable attack path analysis, least-privilege enforcement, and remediation of risky configurations before exploitation.
In short, asset graphs shift security from static lists to dynamic relationships, from reactive to proactive, and from siloed to unified.
Core Components of an Asset Graph
Building an asset graph involves two layers: the data model (what is represented) and the system architecture (how it’s built, stored, and analyzed).
1. Data Model: Nodes, Edges, and Attributes
- Nodes (assets): endpoints, cloud workloads, users, service accounts, applications, network devices, IoT/OT assets.
- Edges (relationships): connections or dependencies between assets, e.g., user → device, device → application, identity → role.
- Attributes and metadata: Nodes include type, owner, status, last-seen timestamp, or vulnerability state; edges can carry relationship type, timestamps, or risk scores.
2. System Architecture & Analytics
- Ingestion and normalization engine: Collects data from multiple sources, deduplicates, and normalizes assets into a coherent view.
- Graph engine/database: Stores nodes and edges, enabling traversal, queries, and analytics (e.g., shortest paths, connected components).
- Visualization and analysis layer: Allows exploration of relationships, dependency queries, and risk mapping.
- Risk and alert integration: Enriches graphs with vulnerability, exposure, and threat intelligence data for actionable insights.
Together, these components create a continuously updated, relationship-aware map connecting technical and operational security data.
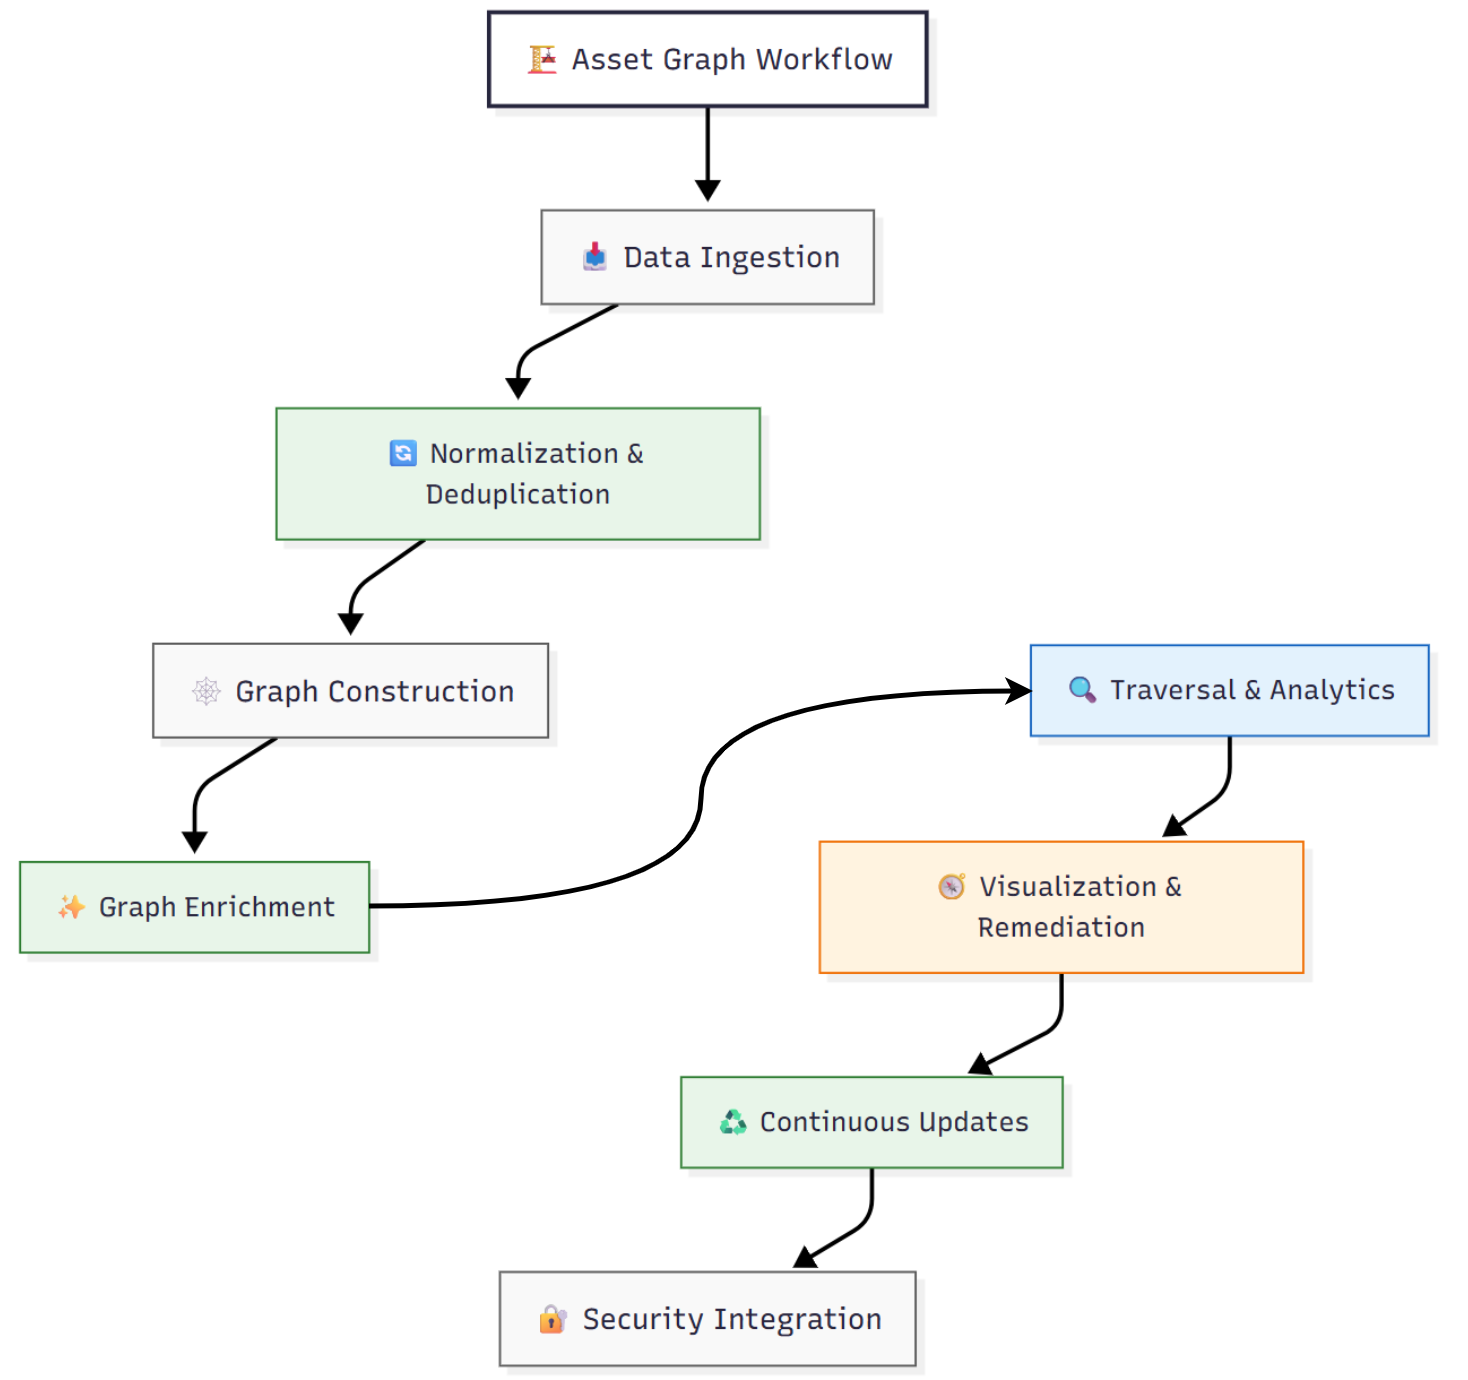
How an Asset Graph Works
- Data ingestion: Collects asset data from endpoints, identity systems, cloud services, vulnerability scanners, CMDBs, network monitors, and IoT/OT systems. Each asset is referenced by identifiers like device ID, IP, or user ID.
- Normalization and deduplication: Merges multiple representations of the same asset to create unique nodes. Asset resolution is a key challenge.
- Graph construction: Nodes represent assets; edges represent relationships. Examples include:
- User logs into device (user → device)
- Device runs application (device → application)
- Cloud account has storage access (identity → data store)
- Workload connected over network (workload → workload)
- Graph enrichment: Adds attributes like owner, asset type, last-seen timestamp, vulnerabilities, compliance, risk exposure, and edge properties like access type, trust relationship, or privilege escalation risk.
- Traversal and analytics: Supports queries like:
- Path from a user to a critical workload
- Devices connected to a compromised endpoint
- Identities with excessive privileges
- Blast radius if a node is compromised
Graph algorithms include shortest-path, connected components, centrality, reachability, and pattern-matching to identify risky configurations.
- Visualization and remediation: Analysts explore clusters, filter nodes, highlight risky paths, and trigger remediation actions like asset tagging or ticket creation.
- Continuous updates: Dynamic environments require near-real-time ingestion and updates to reflect new assets, relationships, and configuration changes.
- Security process integration: Asset graphs integrate with vulnerability management, incident response, and exposure dashboards for actionable insights.
In this way, the asset graph transitions from static inventory to dynamic relationship-aware security fabric.
Use Cases of Asset Graphs
Asset graphs provide powerful capabilities across security and IT operations. A key use case is attack-path analysis and lateral-movement detection, by mapping relationships among endpoints, identities, cloud workloads, and applications, teams can visualize attacker pathways, identify choke points, and design least-privilege controls to shift from reactive alerts to proactive risk reduction.
They also enable discovery of unmanaged or rogue assets, such as shadow IT, forgotten cloud instances, or orphaned identities. By exposing nodes that lack connections to managed systems, asset graphs uncover blind spots often missed by traditional inventories.
Another major use is exposure and blast-radius assessment. When vulnerabilities or compromises occur, graphs help pinpoint directly or indirectly affected assets, prioritize remediation, and contain spread.
In identity and privilege management, graphs clarify complex relationships between users, roles, and permissions, highlighting excessive privileges and risky trust links across hybrid environments.
Finally, asset graphs support automation, compliance, and governance by integrating with remediation workflows, triggering actions like patching or isolation, and providing visual evidence of ownership and control coverage. In essence, they turn static inventories into dynamic, relational views of the technology landscape, driving greater visibility, faster response, and stronger security posture.
Asset Graph vs Traditional Asset Inventory
The comparison of Asset Graph and Traditional Inventory is summarized into the following table:
Traditional inventories answer “What assets do we have?” Asset graphs answer “How are assets connected, and what does that mean for risk?”
Challenges & Implementation Considerations
Implementing an asset graph brings major advantages but also complex challenges across data, technology, and organization. A key hurdle is data ingestion and quality: asset data originates from diverse systems, endpoints, clouds, identity providers, vulnerability scanners, and CMDBs, each with different schemas and reliability. Effective integration, normalization, and deduplication are vital to avoid blind spots or misleading relationships. Scalability and performance are equally critical, as large enterprises may need to manage millions of assets and billions of links. Efficient graph traversal, indexing, and near-real-time updates are required to prevent the graph from becoming sluggish or outdated.
Continuous update capability is essential in dynamic environments where workloads, users, and configurations constantly change. Incremental ingestion and change detection keep data fresh and trustworthy. The usability and relevance of the graph also determine its value, not all data adds insight. Emphasis should be placed on relationships reflecting access, trust, dependency, and exposure, supported by visualization tools that enable filtering and contextual exploration rather than data overload.
Beyond technology, organizational integration is key. The asset graph should tie into vulnerability management, incident response, and remediation workflows to ensure insights drive action. This requires governance, access control, stakeholder alignment, and clear ownership of data flows. Finally, cost-to-value balance matters: investments in databases, connectors, and talent must yield measurable gains in visibility, risk reduction, and operational efficiency.
Success ultimately depends on six dimensions: data quality, scalability, update cadence, usability, integration, and governance, all crucial for realizing the full potential of an asset graph.
How PuppyGraph Can Help
Building and operationalizing an asset graph is far from simple. Data about assets and relationships is often fragmented across clouds, endpoints, identity providers, and security tools, each using different schemas, update cycles, and quality standards. Integrating and maintaining these datasets typically requires heavy ETL pipelines, ongoing normalization, and complex synchronization to stay accurate and current. PuppyGraph offers a real-time, zero-ETL engine that models and queries asset relationships directly on existing databases and lakes. Teams can instantly explore dependencies, attack paths, and exposures, without moving or duplicating data.

Key PuppyGraph capabilities include:
- Zero ETL: PuppyGraph runs as a query engine on your existing relational databases and lakes. Skip pipeline builds, reduce fragility, and start querying as a graph in minutes.
- No Data Duplication: Query your data in place, eliminating the need to copy large datasets into a separate graph database. This ensures data consistency and leverages existing data access controls.
- Real Time Analysis: By querying live source data, analyses reflect the current state of the environment, mitigating the problem of relying on static, potentially outdated graph snapshots. PuppyGraph users report 6-hop queries across billions of edges in less than 3 seconds.
- Scalable Performance: PuppyGraph’s distributed compute engine scales with your cluster size. Run petabyte-scale workloads and deep traversals like 10-hop neighbors, and get answers back in seconds. This exceptional query performance is achieved through the use of parallel processing and vectorized evaluation technology.
- Flexible and Iterative Modeling: Using metadata driven schemas allows creating multiple graph views from the same underlying data. Models can be iterated upon quickly without rebuilding data pipelines, supporting agile analysis workflows.
- Lower Total Cost of Ownership: Graph databases make you pay twice — once for pipelines, duplicated storage, and parallel governance, and again for the high-memory hardware needed to make them fast. PuppyGraph removes both costs by querying your lake directly with zero ETL and no second system to maintain. No massive RAM bills, no duplicated ACLs, and no extra infrastructure to secure.
- Flexible and Iterative Modeling: Using metadata driven schemas allows creating multiple graph views from the same underlying data. Models can be iterated upon quickly without rebuilding data pipelines, supporting agile analysis workflows.
- Standard Querying and Visualization: Support for standard graph query languages (openCypher, Gremlin) and integrated visualization tools helps analysts explore relationships intuitively and effectively.
- Proven at Enterprise Scale: PuppyGraph is already used by half of the top 20 cybersecurity companies, as well as engineering-driven enterprises like AMD and Coinbase. Whether it’s multi-hop security reasoning, asset intelligence, or deep relationship queries across massive datasets, these teams trust PuppyGraph to replace slow ETL pipelines and complex graph stacks with a simpler, faster architecture.


Let’s walk through an example using the PuppyGraph Asset Graph Demo, which shows how to construct an asset relationship graph and explore connections among devices, users, identities, and cloud workloads.
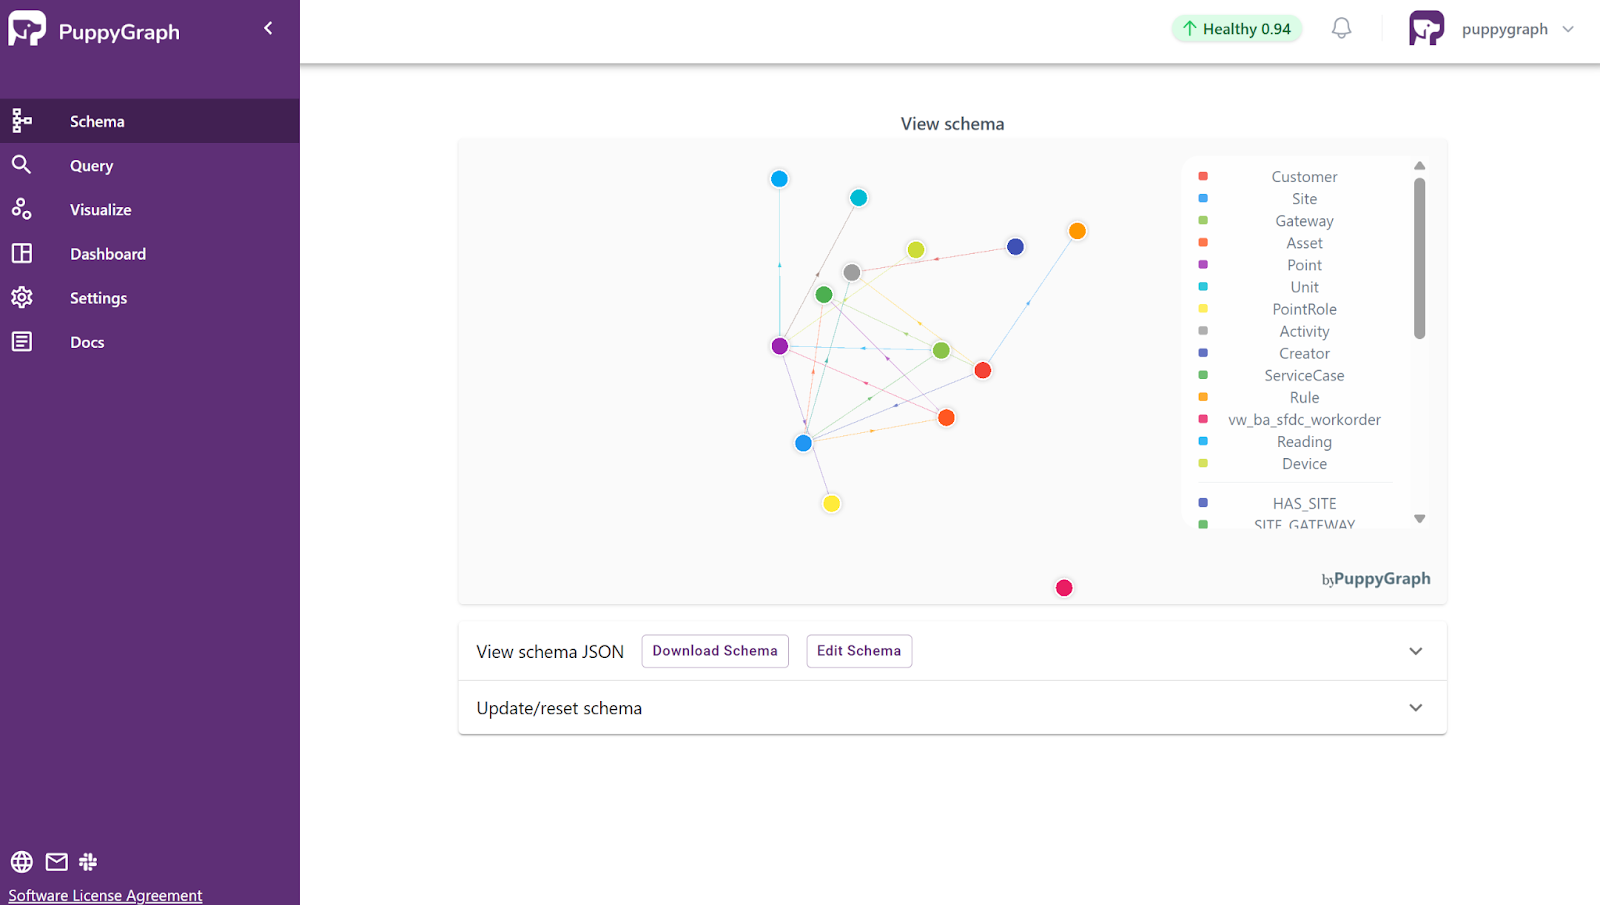
Asset Graph Visualization with PuppyGraph
With PuppyGraph, you can upload a schema that defines how assets and relationships map to your existing data, for example, linking devices to users, workloads to storage, or identities to access roles. PuppyGraph instantly generates an interactive, visual graph, allowing teams to explore asset interconnections and understand exposure across the environment.
From here, security teams can go beyond visualization, they can query paths, trace access flows, identify high-risk nodes, and track how vulnerabilities propagate through dependencies.
Asset Relationship Analysis with PuppyGraph
Once your environment is modeled as a graph, you can begin asking meaningful questions, such as:
- Which assets are owned by a specific customer?
- What is the complete data path from a customer through sites, gateways, and points?
Instead of static spreadsheets, graph queries let you trace relationships, identify indirect exposures, and gain actionable insights into your environment’s structure and risk posture.
PuppyGraph supports both Gremlin and openCypher, giving analysts flexibility in how they query and analyze asset data. Below are a few example Gremlin queries using the PuppyGraph Asset Graph Demo.
Example Cypher Queries
1. Find all Assets owned by a specific Customer
MATCH path=(c:Customer {customer_name: "Customer_2"})
  -[:HAS_SITE]->(s:Site)
  -[:HAS_ASSET]->(a:Asset)
RETURN path;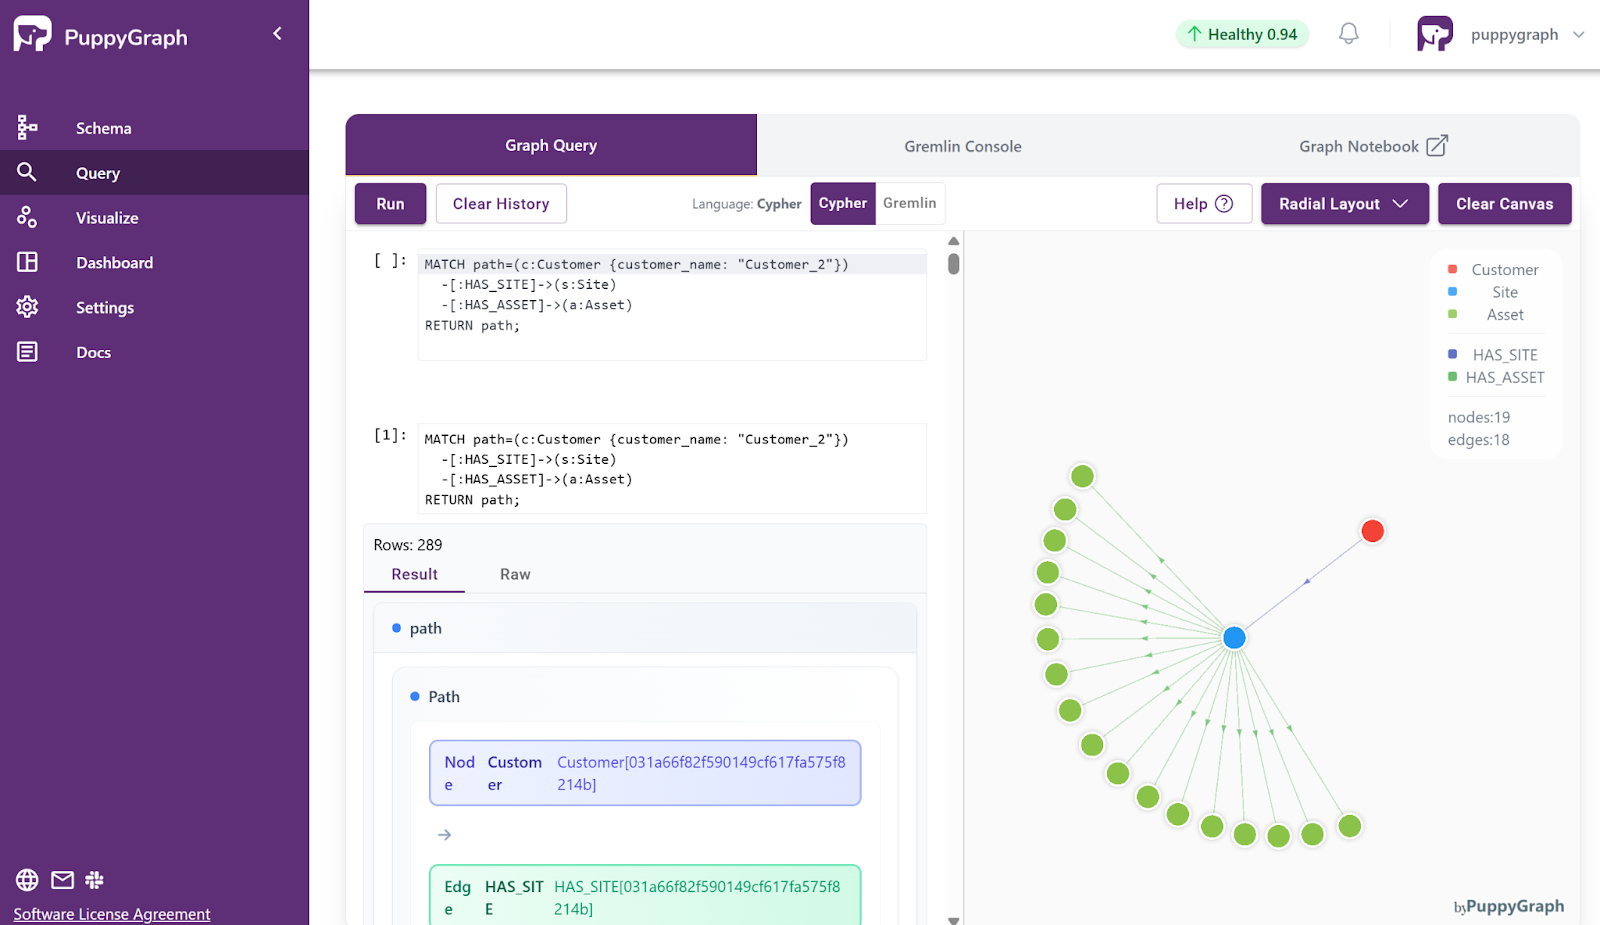
2. Trace full data path: Customer → Site → Gateway → Point
MATCH path=(c:Customer {customer_name: "Customer_2"})
  -[:HAS_SITE]->(s:Site)
  -[:SITE_GATEWAY]->(g:Gateway)
  -[:GATEWAY_POINT]->(p:Point)
RETURN path;
By modeling assets and relationships directly from your existing systems, without ETL or complex integration, PuppyGraph transforms asset data into a living, queryable graph. You can explore relationships across endpoints, identities, applications, and cloud workloads in real time, uncover hidden dependencies, and proactively reduce your attack surface.
Conclusion
Asset graphs offer a modern approach to security and IT visibility by modeling assets and their relationships as a unified graph. Unlike traditional inventories, which list assets in isolation, asset graphs show how devices, users, workloads, and services interconnect, how vulnerabilities may propagate, and where risks concentrate. By unifying, deduplicating, and correlating data from multiple sources, organizations gain real-time context and actionable insights for attack-path detection, identity-risk mapping, and faster incident response.
PuppyGraph takes this concept further by removing the need for ETL or duplicated storage. It lets you query your existing databases, data warehouses, and lakes as live graphs in real time. With defined schemas, you can create multiple graph views over the same data, scale to petabytes, and run complex multi-hop queries in seconds, all without changing your existing infrastructure.
If you’d like to explore this approach, try the forever free PuppyGraph Developer Edition or book a demo today to talk with our graph experts about your use case.

Hao Wu is a Software Engineer with a strong foundation in computer science and algorithms. He earned his Bachelor’s degree in Computer Science from Fudan University and a Master’s degree from George Washington University, where he focused on graph databases.

Get started with PuppyGraph!


Developer Edition
- Forever free
- Single noded
- Designed for proving your ideas
- Available via Docker install
Enterprise Edition
- 30-day free trial with full features
- Everything in developer edition & enterprise features
- Designed for production
- Available via AWS AMI & Docker install