

What is Business Data Lineage?
Business data lineage maps the journey of data from its sources to final destinations, capturing transformations, movements, and dependencies along the way. This visibility helps organizations understand how reports, dashboards, and analytics are generated, improving trust, transparency, and data quality. Clear lineage allows stakeholders to detect errors, trace anomalies, and assess the impact of changes across systems, reducing risk and supporting confident decision-making.
Beyond technical metadata, lineage bridges business understanding and technical workflows, making complex processes intelligible to analysts, compliance officers, and executives. In regulated or distributed environments, it ensures auditability, governance, and impact analysis. This article explores what business data lineage is, its key components and types, how it works, and the practical benefits and challenges of implementing it effectively within modern data ecosystems, including real-time lineage graph construction with PuppyGraph.
What Is Business Data Lineage
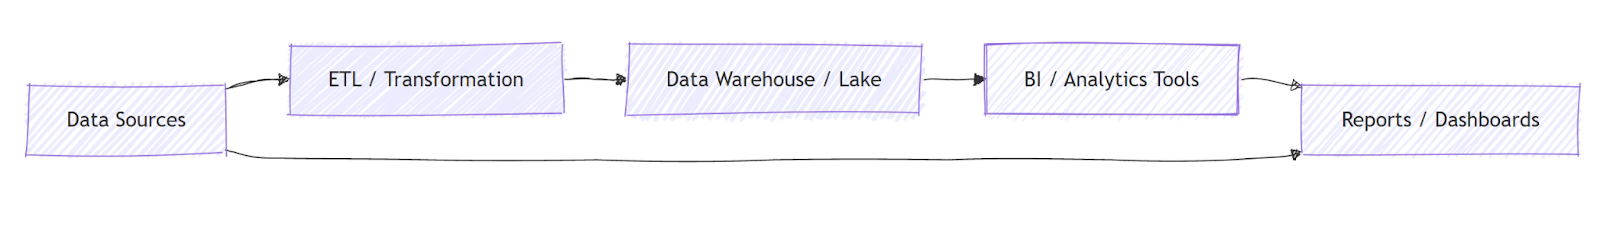
Business data lineage refers to the documentation and visualization of data’s lifecycle: tracing the origin, movement, transformations, and destinations of data as it flows through an organization's systems. It captures how data moves from source systems (like databases, applications, or external feeds), through transformation steps (such as ETL/ELT, data cleaning, enrichment, aggregation), into storage systems (data warehouse, data lake, marts), and finally into reporting or analytical tools. The lineage encompasses not only where data came from and where it ends up, but also what happened to it in between.
This concept is not confined to technical metadata. Business data lineage aims to bridge the gap between technical workflows and business understanding: it should be intelligible not only to data engineers and architects, but also to business analysts, compliance officers, and stakeholders who depend on data-driven decisions. In that sense, it is part technical metadata, part documentation, part governance mechanism. Properly implemented, business data lineage becomes a living map of data’s journey, aiding trust, repeatability, and clarity across the organization.
Key Components of Data Lineage
At its core, any data lineage solution rests on a few essential components. First, there are data sources, systems or applications holding original data, such as relational databases, SaaS applications, logs, or external APIs. Second, data transformations, the processes that shape, cleanse, aggregate, or reformat data. These transformations may be defined in ETL/ELT pipelines, SQL scripts, data integration tools, or custom code. Third, data stores, where data is kept after transformation, typically data lakes, warehouses, marts, or even caches. Finally, there are data consumers, downstream services, BI tools, dashboards, reports, or machine‑learning models that use the processed data.
Beyond these core actors, there are metadata layers that record schema information, transformation logic, timestamps, version histories, and dependencies. Good lineage systems also include business context: mapping technical data fields to business terms (e.g., “cust_id” maps to “Customer ID”), capturing data ownership, data sensitivity, compliance attributes, and usage policies. That extra layer transforms lineage from purely technical to business‑readable, supporting data governance, auditing, and stakeholder communication.
Lastly, a fully realized data lineage solution incorporates a lineage graph that ties these elements together in a visual, queryable structure. This graph is the foundation for understanding how data flows and evolves across your ecosystem.
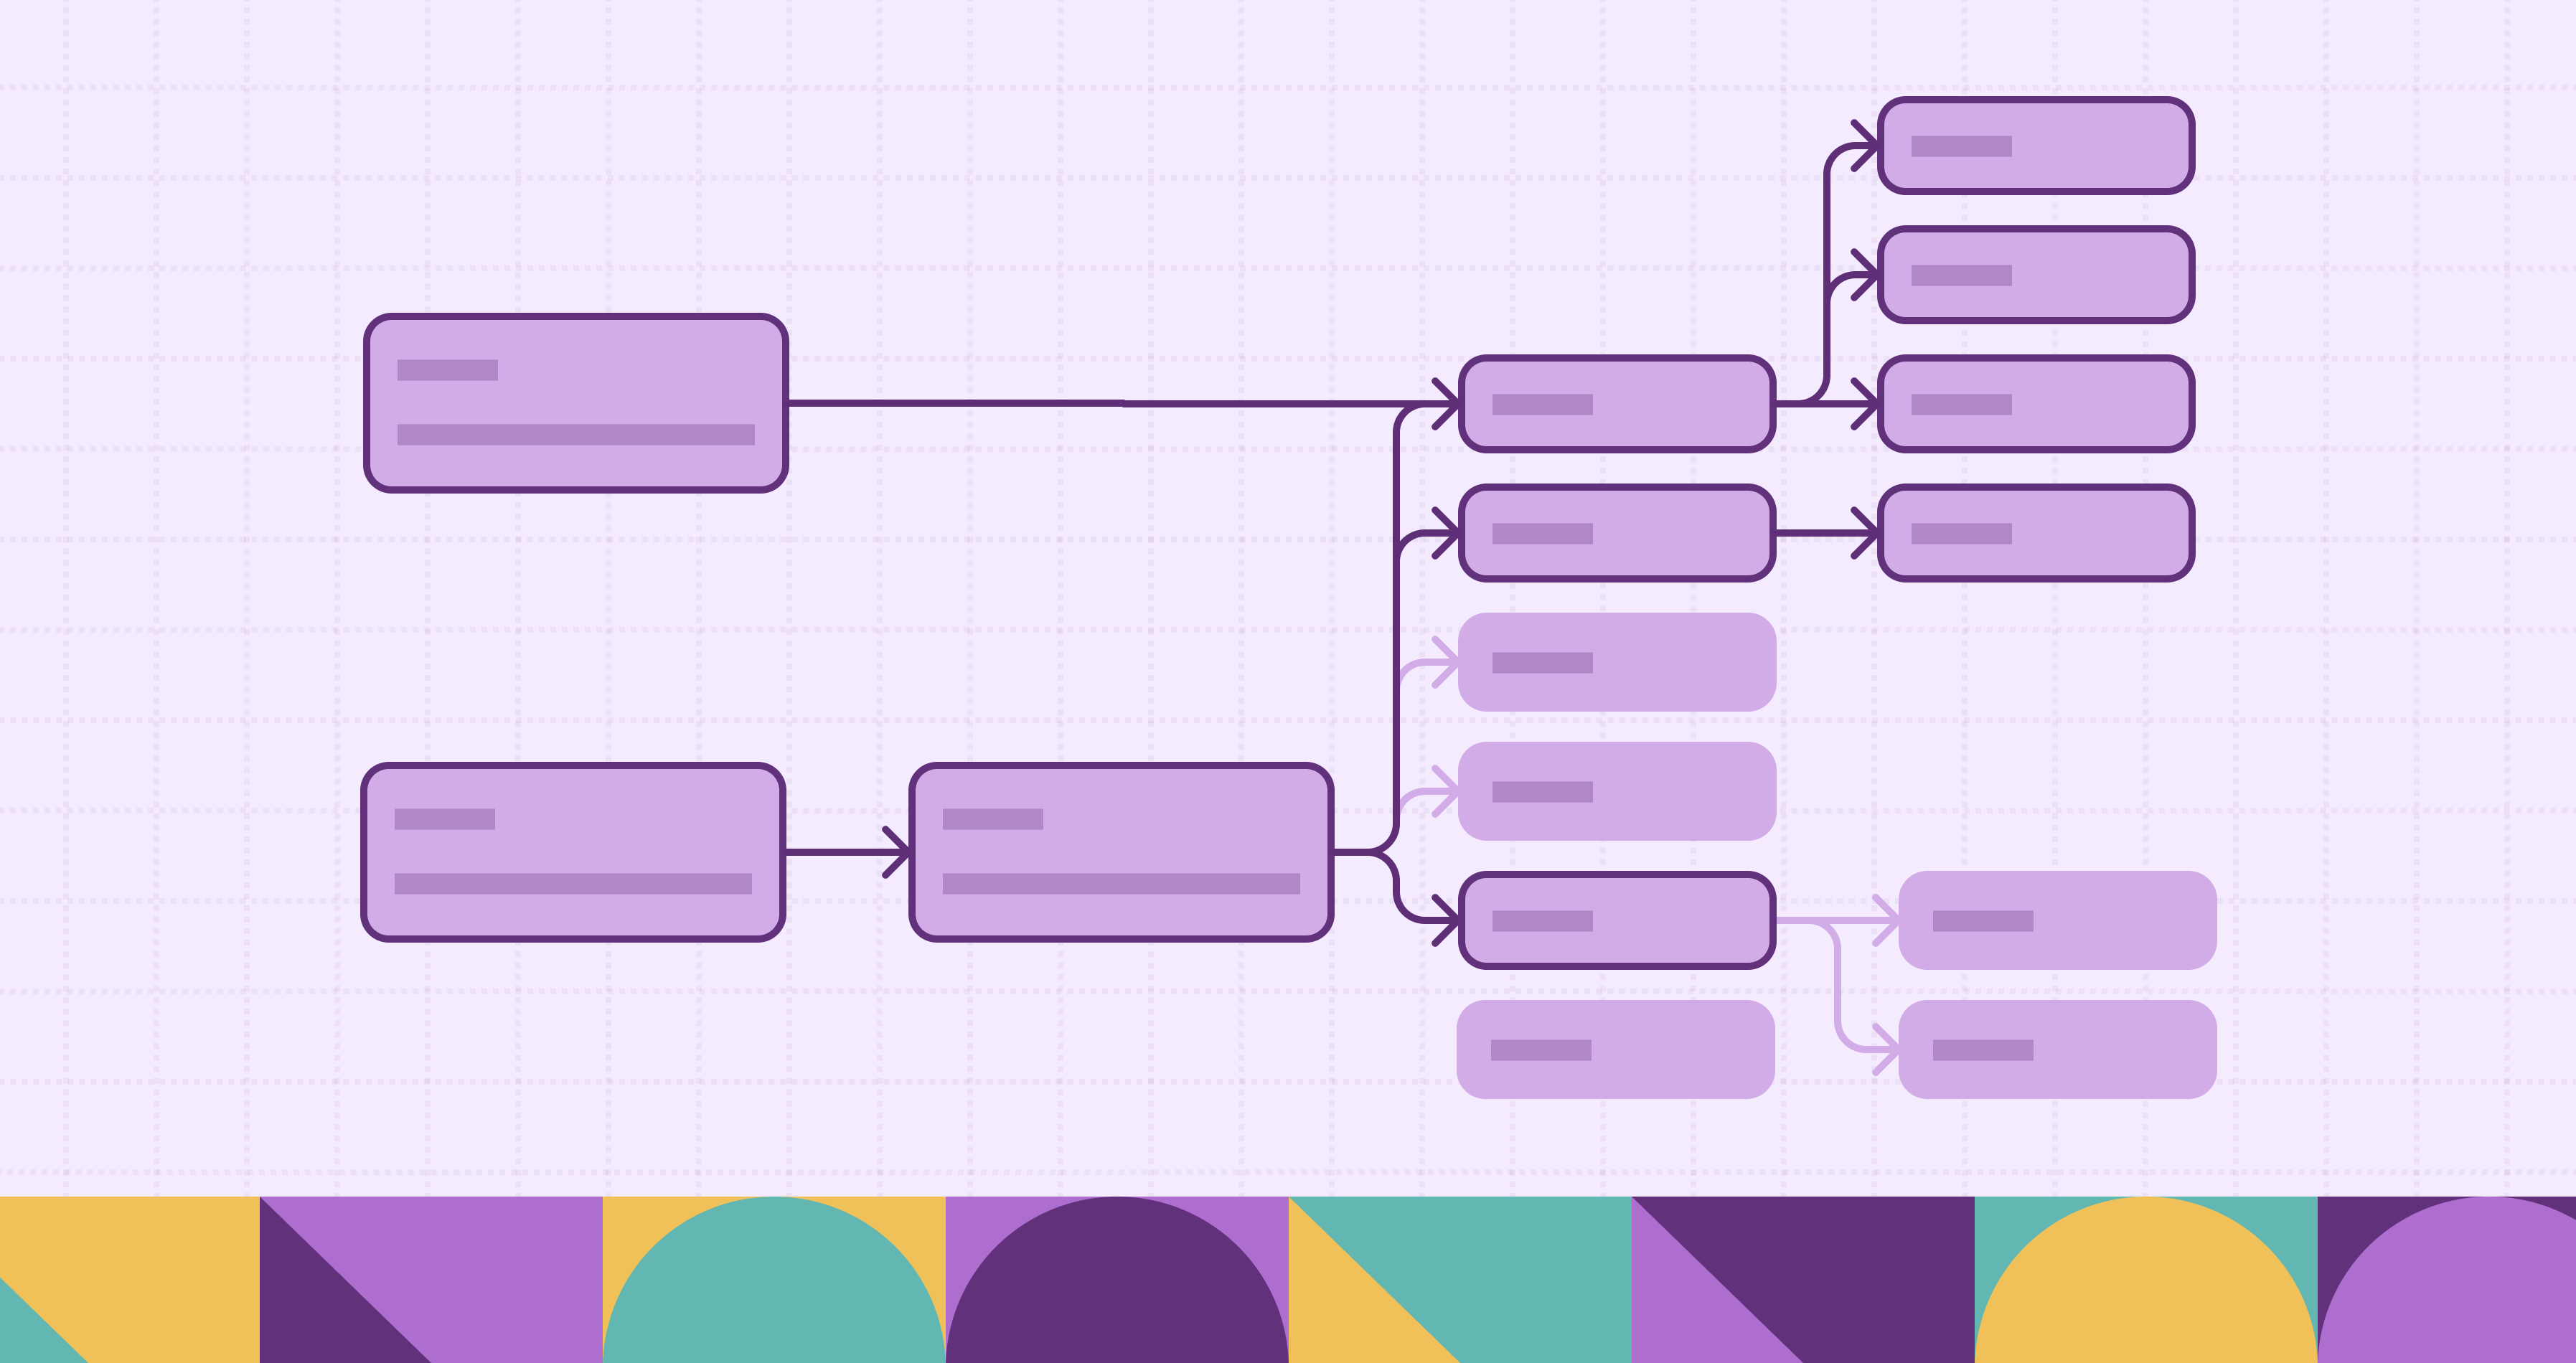
A lineage graph represents data entities as nodes (such as tables, views, ETL jobs, or dashboards) and relationships or transformations as edges between them. Nodes can represent multiple levels of detail, entire datasets, individual tables, or even specific columns, while edges often carry metadata describing the type of transformation, timestamps, or data ownership.
Example of Components in a Lineage Graph
- Source nodes: Original systems where data is created or ingested (e.g., production databases or event streams)
- Transformation nodes: ETL/ELT tasks or SQL jobs that change data shape, apply business logic, or merge data sources
- Storage nodes: Warehouses, data lakes, or marts where transformed datasets are persisted
- Consumption nodes: BI dashboards, reports, data products, or analytical models that derive insights from the data
By linking these nodes, the lineage graph encodes both technical and business context: technical metadata (schemas, transformation logic) and business semantics (friendly field names, business definitions, sensitivity labels). This makes it easier for technical and non‑technical stakeholders to navigate the data landscape and ask questions like “How is Total Revenue calculated?” or “Which dashboards depend on Customer ID?” without needing to wade through code.
Importance of Business Data Lineage
Business data lineage is fundamental to building trust in data, both for technical teams and business stakeholders. When decision-makers know exactly where data came from and how it was processed, they can evaluate its reliability and suitability. Without lineage, data can seem like a black box: a report might show “Total Sales,” but the reader may have no clue whether that includes returns, cancellations, or is filtered for regions. Transparent lineage ensures that such assumptions are visible and auditable.
Moreover, lineage is critical for regulatory compliance and auditability. Industries subject to stringent data regulations, finance, healthcare, insurance, need to show how data was generated, processed, stored, and accessed. Auditors may ask for evidence of data provenance, transformation steps, and who touched the data. Business data lineage provides exactly that record. In addition, lineage supports impact analysis: when schema changes happen or data pipelines are modified, lineage helps predict what downstream reports, dashboards, or systems might be affected, reducing risk and preventing data disasters.
How Business Data Lineage Works
Under the hood, implementing business data lineage involves capturing metadata at each stage of data’s journey and linking those pieces into a cohesive graph. Typically, this requires instrumenting data pipelines, tracking source-to-target mappings, and recording transformation logic. Modern lineage tools or systems scan ETL scripts, SQL, or workflow definitions to extract lineage automatically; others rely partly on manual annotations for complex transformations.
At each arrow, the lineage system logs metadata: where the data came from, what transformation was applied, which fields changed or aggregated, and where the outcome went. This builds a lineage graph, often directed, with nodes representing data stores, datasets, or tables, and edges representing transformations or movements. Over time, the graph can grow large, but it remains navigable: users can query “What upstream sources influence this dashboard?” or “Which reports will break if we rename this column?” This clarity forms the backbone of data governance and operational resilience.
Lineage Graph
At the heart of business data lineage is the lineage graph, a directed graph structure that models the flow of data from origin to consumption. Unlike simple lists of sources and destinations, a lineage graph encodes dependencies and transformations so users can traverse data paths forward (downstream) or backward (upstream).
In practice, lineage graphs are built by collecting metadata from tools and systems across your environment. Automated lineage extraction techniques analyze SQL scripts, ETL definitions, or workflow orchestrators to identify source‑to‑target mappings and transformation logic. Where automation falls short, such as in custom code, manual annotations or metadata registration help fill gaps.
Once assembled, the lineage graph supports powerful exploration patterns:
- Impact analysis: Before renaming a column or changing a schema, you can identify all downstream dashboards and reports that might break.
- Root cause analysis: When data quality issues arise, the graph lets engineers trace data back to its original source and pinpoint the transformation where anomalies were introduced.
- Business context mapping: Technical nodes and edges can be enriched with business meaning, helping analysts understand how raw fields like cust_id relate to “Customer ID” in reporting.
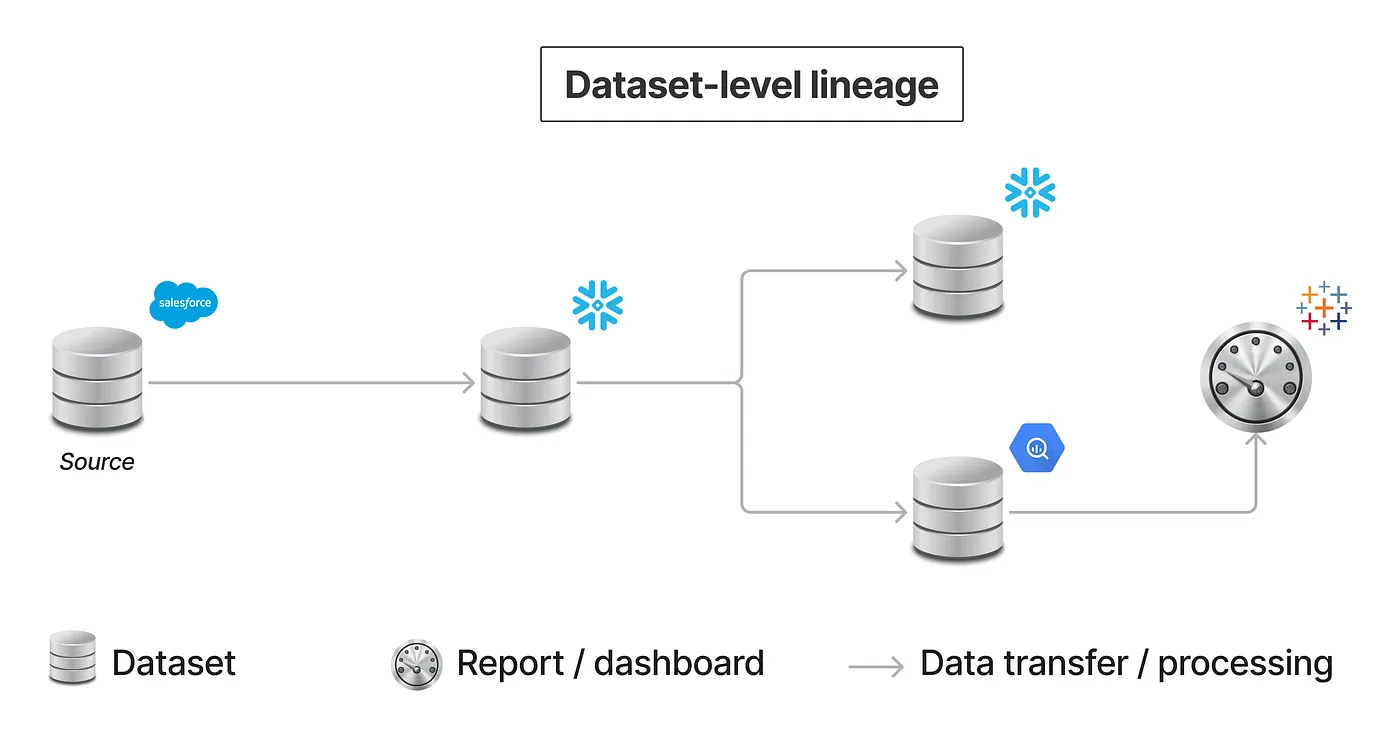
A typical lineage graph looks like a web of interconnected nodes, with arrows showing the direction of data flow, e.g., from source systems through transformations into a data warehouse, and then into BI dashboards as shown in diagrams above.
When implemented well, lineage graphs become interactive artifacts: users can click on a node to see its upstream dependencies or follow a path to understand how a metric is computed. This graph‑centric view supports both technical troubleshooting and business‑level transparency, turning complex data landscapes into intuitive visual maps.
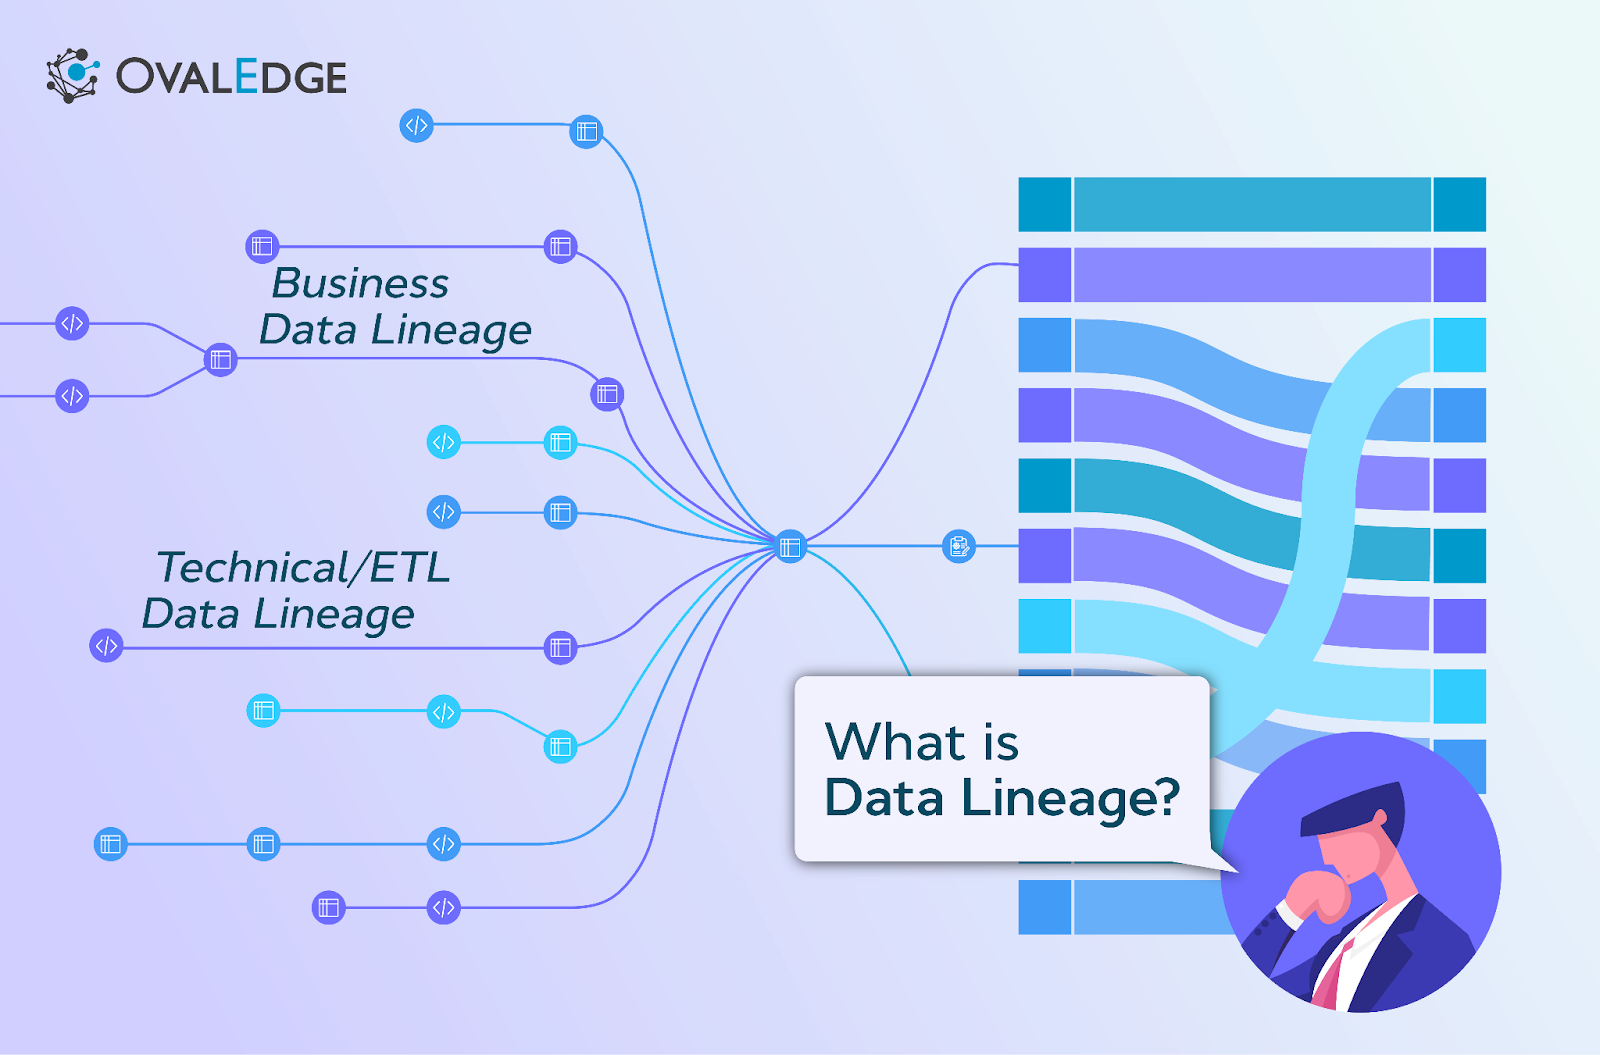
Types of Data Lineage
When discussing lineage, it is helpful to distinguish among several types, especially technical lineage, business lineage, and operational lineage. Technical lineage focuses on system-level details: tables, files, schemas, transformation code, timestamps. It is primarily used by data engineers to manage data flow, handle dependencies, and maintain infrastructure. Business lineage, on the other hand, abstracts away technical jargon and maps data elements to business concepts: “Customer,” “Order Value,” “Revenue,” etc. It helps business analysts, compliance officers, and decision-makers understand data in business‑relevant terms.
A third variety, operational lineage, captures run-time metadata: data volumes, performance metrics, latency, freshness, error logs, and historical lineage snapshots. Operational lineage helps monitor the health of data pipelines, identify bottlenecks, detect failures, and debug data quality issues. Effective data governance often requires a combination of all three: technical clarity, business semantics, and operational visibility. Together they provide a holistic view of data’s journey and state.
Benefits of Implementing Data Lineage
Implementing robust data lineage yields many advantages for an organization. First, it enhances data trust and transparency. Stakeholders can trace results back to their origin and see exactly how values were derived, leading to more confidence in decisions based on data. Second, it supports data governance and compliance: lineage offers evidence for audits, regulatory reviews, and internal governance policies, showing data provenance, transformation steps, and access logs. Third, lineage enables impact analysis and risk mitigation: before changing a schema, migrating a database, or refactoring an ETL job, engineers can see all downstream dependencies, avoiding unintended breakages. Finally, lineage supports data quality and debugging: when data anomalies or discrepancies arise, lineage helps pinpoint exactly where data entered, what happened to it, and who touched it, greatly accelerating root‑cause analysis and resolution.
Moreover, lineage contributes to data reuse and collaboration: with clear lineage documentation and business‑level definitions, different teams (analytics, finance, compliance) can share understanding of datasets, avoid redundant ETL jobs, and build on existing pipelines. Over time, lineage becomes institutional knowledge, reducing onboarding friction and promoting consistent data practices.
Challenges in Data Lineage Management
Despite the benefits, implementing and maintaining data lineage poses non-trivial challenges. One of the biggest hurdles is complexity in capturing lineage automatically. Modern data environments are heterogeneous: varying source systems, custom scripts, ad-hoc transformations, manual exports, not all of which can be scanned or parsed reliably. Some transformations may be embedded in code or in third-party tools without metadata export capability. As a result, automated lineage extraction often misses steps or produces incomplete lineage graphs, requiring manual annotation, which is labor-intensive and error-prone.
Another challenge is scale and maintenance. As data pipelines evolve, schemas change, new sources are added, and data flows shift. Without governance and discipline, lineage documentation can quickly become outdated. Maintaining the lineage graph demands continuous upkeep, updating mappings, re-scanning pipelines, and re-validating metadata. This is especially difficult in agile environments where data workflows are constantly changing.
A further complication lies in governance and ownership: who owns the lineage? Who is responsible for verifying and updating it? Without clear ownership, lineage efforts often stall. Also, there is the issue of privacy and security: recording detailed metadata about data flow may unintentionally expose sensitive information or create compliance risks, especially when data flows cross jurisdictions or involve sensitive data. Finally, representing lineage in a way that is both technically precise and business‑readable can be hard: blindly exporting table‑to‑table relationships may satisfy engineers but remain opaque to business stakeholders.
Data Lineage in Modern Data Ecosystems
Modern enterprises typically operate complex, distributed data ecosystems: multiple databases, data warehouses, data lakes, streaming platforms, cloud storage, and BI tools. In such environments, good data lineage becomes not just helpful but essential. Cloud-based data stacks often involve services like data ingestion pipelines, real-time streaming, scheduled batch jobs, and hybrid on‑prem/cloud storage, all feeding into analytical layers. Lineage solutions that integrate across these layers provide visibility beyond individual silos.
In addition, with the rise of data mesh, data fabric, and decentralized data ownership, business data lineage supports federated governance. Teams across business units can maintain their local datasets, while global lineage metadata provides visibility into how datasets interconnect, who owns what, and how data flows across domains. In cloud-native environments, lineage systems can integrate with orchestration tools, metadata catalogs, and data catalogs, building a centralized lineage graph accessible enterprise‑wide. This supports scalable data governance, compliance, and collaboration.
Moreover, modern regulatory pressures (e.g., data privacy laws, audit requirements) increasingly demand traceability of data lineage across jurisdictions and systems. A lineage-aware data ecosystem helps organizations respond faster to audit requests, demonstrate compliance, and enforce policies around data access, retention, and usage. As data becomes more central to business operations, lineage transitions from “nice-to-have” to “must-have.”
Building Lineage Graphs with PuppyGraph
As introduced in the previous sections, a lineage graph is a visual representation of how data flows through an organization, from sources, through transformations, to consumption in dashboards or reports. It captures both technical metadata (tables, ETL jobs, transformations) and business context (metrics, definitions, dependencies), helping teams understand how data moves and how metrics are derived.
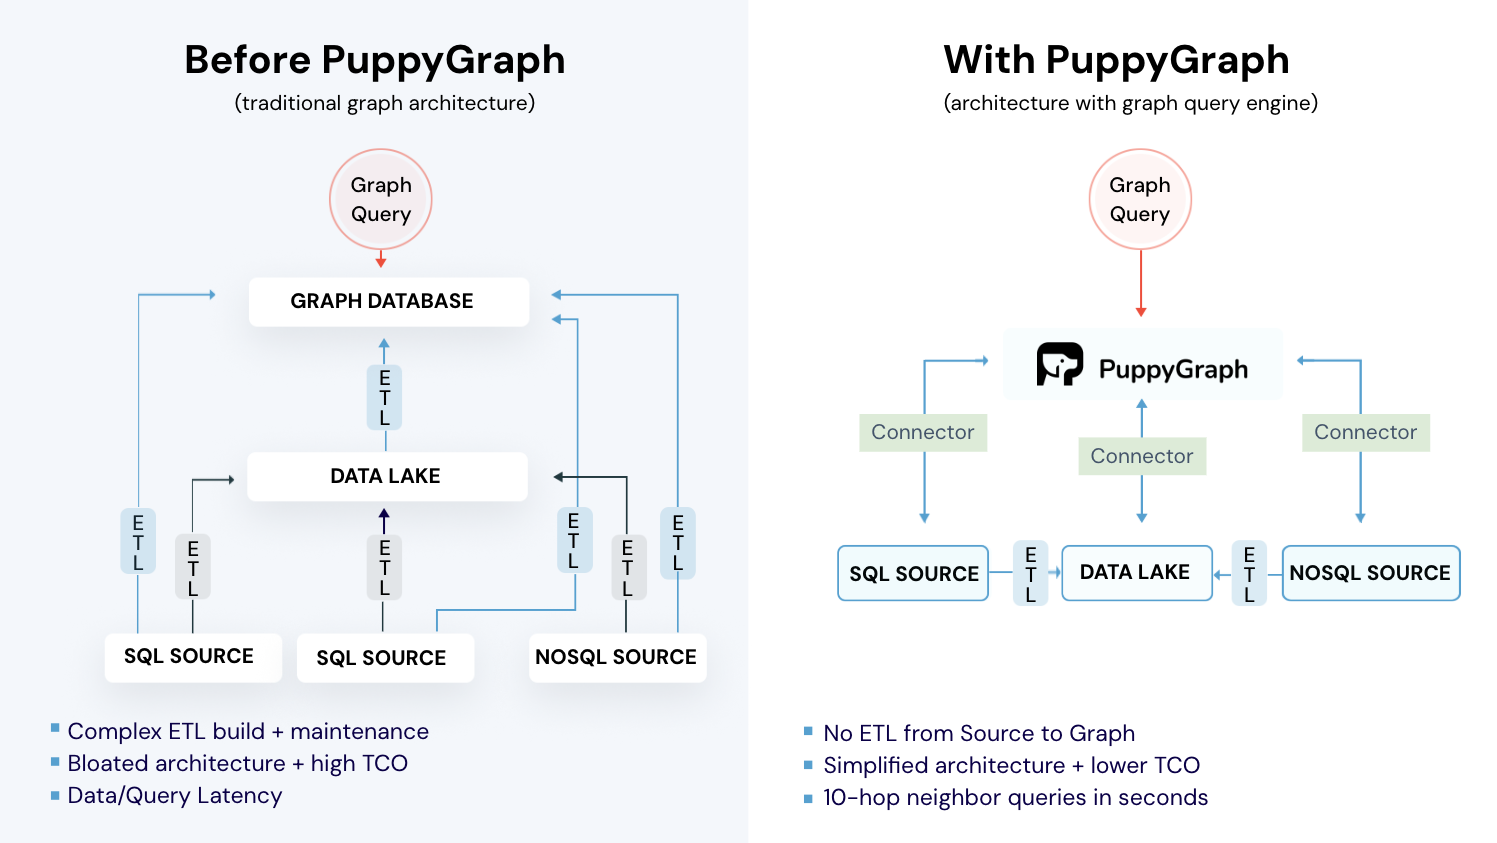
Building and maintaining such graphs across complex, distributed data ecosystems can be challenging. Traditional approaches often rely on extensive ETL pipelines, duplicated storage, and manual mapping. PuppyGraph simplifies this process by constructing and querying lineage graphs directly on your existing data sources in real time.
The process of building a lineage graph with PuppyGraph starts from existing data sources (such as relational tables) that already describe datasets, transformations, and consumers. Using a graph schema, PuppyGraph maps tables, ETL jobs, and dashboards to graph nodes, and maps their dependencies, transformations to edges. Lineage queries are evaluated at query time on live source data, ensuring the lineage view is always current and reflects the real state of the data ecosystem.

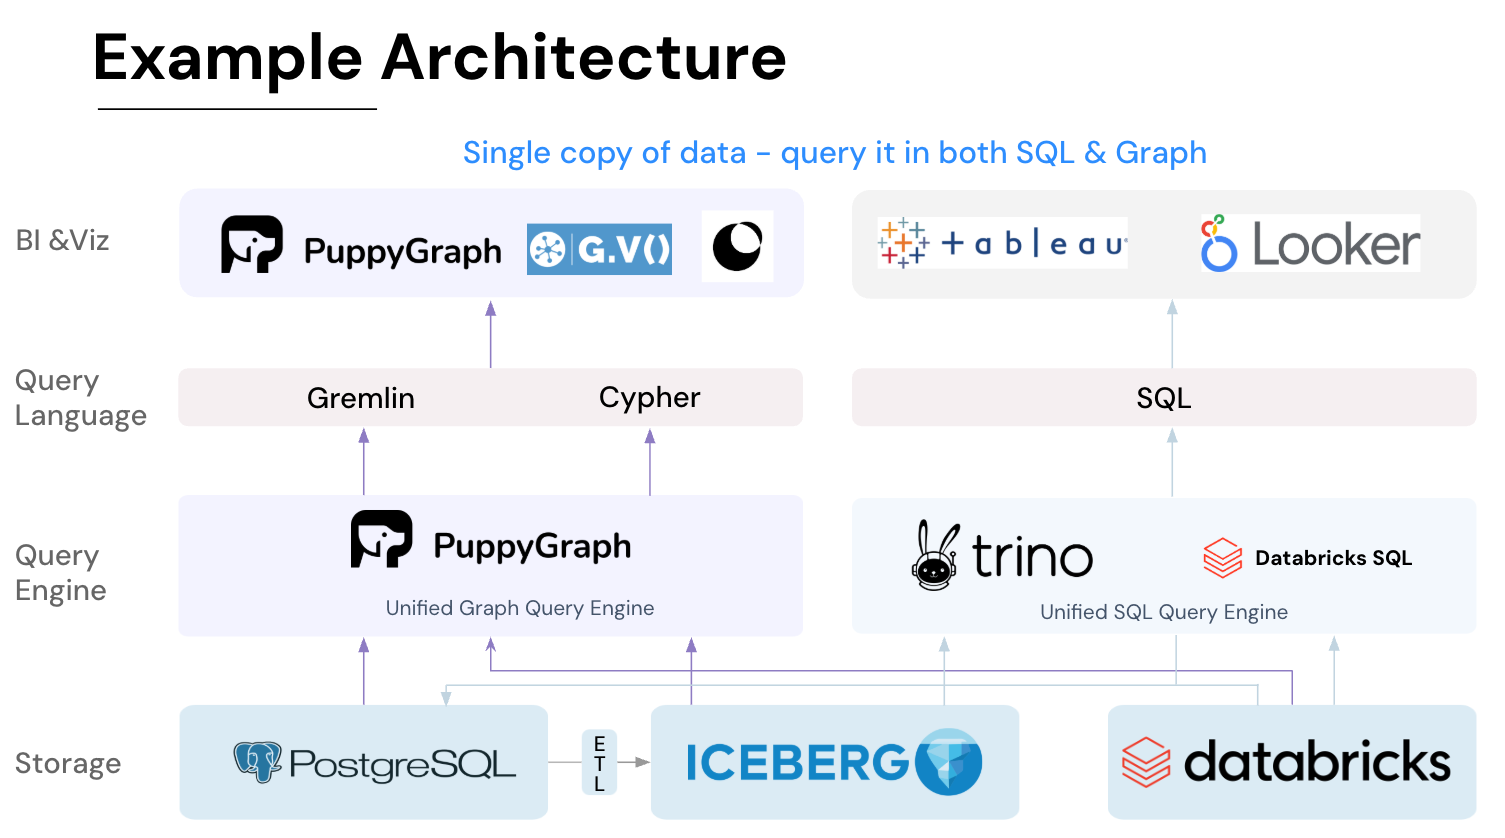
PuppyGraph is the first and only real time, zero-ETL graph query engine in the market, empowering data teams to query existing relational data stores as a unified graph model that can be deployed in under 10 minutes, bypassing traditional graph databases' cost, latency, and maintenance hurdles.
It seamlessly integrates with data lakes like Apache Iceberg, Apache Hudi, and Delta Lake, as well as databases including MySQL, PostgreSQL, and DuckDB, so you can query across multiple sources simultaneously.

Key PuppyGraph capabilities include:
- Zero ETL: PuppyGraph runs as a query engine on your existing relational databases and lakes. Skip pipeline builds, reduce fragility, and start querying as a graph in minutes.
- No Data Duplication: Query your data in place, eliminating the need to copy large datasets into a separate graph database. This ensures data consistency and leverages existing data access controls.
- Real Time Analysis: By querying live source data, analyses reflect the current state of the environment, mitigating the problem of relying on static, potentially outdated graph snapshots. PuppyGraph users report 6-hop queries across billions of edges in less than 3 seconds.
- Scalable Performance: PuppyGraph’s distributed compute engine scales with your cluster size. Run petabyte-scale workloads and deep traversals like 10-hop neighbors, and get answers back in seconds. This exceptional query performance is achieved through the use of parallel processing and vectorized evaluation technology.
- Best of SQL and Graph: Because PuppyGraph queries your data in place, teams can use their existing SQL engines for tabular workloads and PuppyGraph for relationship-heavy analysis, all on the same source tables. No need to force every use case through a graph database or retrain teams on a new query language.
- Lower Total Cost of Ownership: Graph databases make you pay twice — once for pipelines, duplicated storage, and parallel governance, and again for the high-memory hardware needed to make them fast. PuppyGraph removes both costs by querying your lake directly with zero ETL and no second system to maintain. No massive RAM bills, no duplicated ACLs, and no extra infrastructure to secure.
- Flexible and Iterative Modeling: Using metadata driven schemas allows creating multiple graph views from the same underlying data. Models can be iterated upon quickly without rebuilding data pipelines, supporting agile analysis workflows.
- Standard Querying and Visualization: Support for standard graph query languages (openCypher, Gremlin) and integrated visualization tools helps analysts explore relationships intuitively and effectively.
- Proven at Enterprise Scale: PuppyGraph is already used by half of the top 20 cybersecurity companies, as well as engineering-driven enterprises like AMD and Coinbase. Whether it’s multi-hop security reasoning, asset intelligence, or deep relationship queries across massive datasets, these teams trust PuppyGraph to replace slow ETL pipelines and complex graph stacks with a simpler, faster architecture.


As data grows more complex, the most valuable insights often lie in how entities relate. PuppyGraph brings those insights to the surface, whether you’re modeling organizational networks, social introductions, fraud and cybersecurity graphs, or GraphRAG pipelines that trace knowledge provenance.
Deployment is simple: download the free Docker image, connect PuppyGraph to your existing data stores, define graph schemas, and start querying. PuppyGraph can be deployed via Docker, AWS AMI, GCP Marketplace, or within a VPC or data center for full data control.
Conclusion
Business data lineage serves as a compass for understanding data’s journey through modern enterprises, from raw sources, through transformations and storage, to analytics, reporting, and compliance. By documenting where data comes from, how it changes, and where it flows, lineage fosters transparency, trust, and effective governance. Implementing lineage can be challenging in complex, evolving data environments, but the benefits in clarity, auditability, quality, and collaboration make it indispensable.
PuppyGraph enables real-time lineage graph construction and exploration without heavy ETL, connecting directly to existing databases and lakes. It allows organizations to visualize and query data relationships across distributed systems, turning data into actionable intelligence and supporting faster, informed decision-making. Download the forever free PuppyGraph Developer Edition, or book a demo with our engineering team to see how you can build and explore your enterprise data lineage in minutes.

Hao Wu is a Software Engineer with a strong foundation in computer science and algorithms. He earned his Bachelor’s degree in Computer Science from Fudan University and a Master’s degree from George Washington University, where he focused on graph databases.

Get started with PuppyGraph!


Developer Edition
- Forever free
- Single noded
- Designed for proving your ideas
- Available via Docker install
Enterprise Edition
- 30-day free trial with full features
- Everything in developer edition & enterprise features
- Designed for production
- Available via AWS AMI & Docker install