

What Is a Compliance Graph? Visualizing Risk & Regulation

Compliance is messy. Compliance data is scattered across multiple systems and rarely follows a consistent format. Regulations arrive as PDFs, policies live in wikis, controls sit in spreadsheets, issues appear in tickets, and evidence hides in logs and emails. At the same time, overlapping standards and constantly changing requirements make tracking compliance difficult. A small tweak that satisfies one clause can inadvertently weaken coverage for another, forcing teams to rework the same problems or create new ones without realizing it.
A compliance graph provides a single, connected view of what must be true and what actually is. It actively links requirements to policies, controls, assets, identities, datasets, and the evidence that proves each claim. One compliance graph can work for multiple compliance standards simultaneously, it just depends on what graph lens you choose to view it through. This enables teams to measure coverage, spot gaps, and understand the impact of changes before they trigger audit issues.
In this guide, we explain what a compliance graph is, why it matters, and how it works. We walk through a pragmatic build process, show real use cases, and explore the future of compliance graphs with AI and automation. We also share how tools like PuppyGraph lets you quickly get started with compliance graphs, so you can start answering compliance questions quickly and grow from there.
What Is a Compliance Graph?
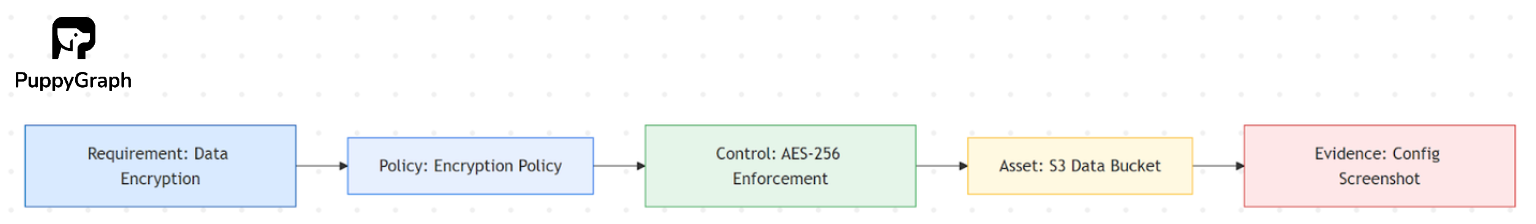
A compliance graph is more than a catalog of controls. It is a connected model that shows how an organization translates regulatory requirements into actionable policies and technical enforcement. Nodes represent requirements, policies, controls, and assets such as systems, applications, or datasets. Edges capture the relationships between them: How a policy fulfills a requirement, how a control enforces a policy, and which assets that control protects.
By linking external obligations to internal implementation, the compliance graph enables full traceability, coverage checks, and impact analysis with audit-ready proof and timestamps.
Conceptually, it combines two chains: the intent chain (Requirement → Policy → Control) that defines what should exist, and the implementation chain (Control → Assets / Identities → Evidence) that shows what does exist. Comparing these chains reveals where compliance is strong, where it’s exposed, and where remediation should focus.

Why Compliance Graphs Matter for Modern Enterprises
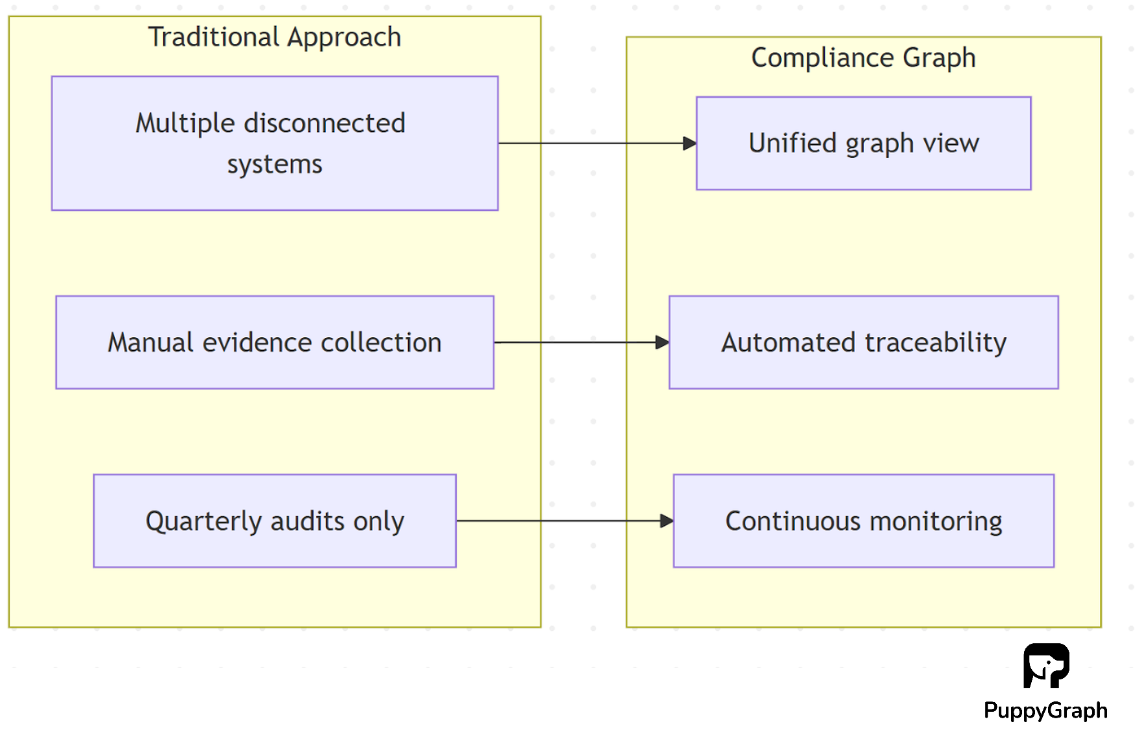
Traditional compliance management struggles to keep pace with the scale and complexity of modern enterprise systems. To understand the value of compliance graphs, let’s first look at the common challenges organizations face today.
Siloed Compliance Data
Large enterprises operate across dozens of platforms, security controls in AWS, HR data in Workday, risk logs in Jira, and evidence scattered across spreadsheets and emails. Each department maintains its own view, and shadows IT or forgotten assets fragment context even further. Without a unified picture, reports become inconsistent, and teams waste time reconciling mismatched numbers. Missing context raises the risk of incomplete findings or failed audits. A compliance graph addresses this by linking all sources: requirements, controls, and assets, into a connected, queryable network, giving teams full visibility.
Unnoticed Shared Controls
Frameworks like ISO 27001, SOC 2, PCI DSS, and GDPR often require similar safeguards but express them differently. Teams end up duplicating efforts and manually replicating evidence across systems. When one framework updates, others drift out of sync, creating inconsistent implementations and hidden risks. For example, a small change in encryption policy under SOC 2 might unintentionally weaken coverage for ISO 27001. Without a dependency view, these conflicts surface late, during audits or incidents, causing rework, delays, and uncertainty. A compliance graph makes shared controls visible across frameworks, so one update can automatically reveal all affected policies and assets.
Lack of Continuous Assurance
Many compliance programs still rely on quarterly reviews and spreadsheet rollups. Evidence quickly goes stale between check-ins, leaving teams blind to emerging gaps. Manual exports and status reports consume hours that should go toward remediation. The result: compliance posture lags behind reality until the next audit cycle. Without automated monitoring, compliance becomes reactive instead of preventive. By connecting live system data with defined controls, a compliance graph enables continuous assurance, real-time visibility into which safeguards are active, misconfigured, or missing.

How a Compliance Graph Works
Once your compliance data is modeled as a graph, you can apply powerful graph analytics to explore relationships, detect weaknesses, and automate assurance. A compliance graph typically consists of two linked parts:
- Intent Chain: maps Requirement → Policy → Control to describe what should exist.
- Implementation Chain: connects Control → Assets / Data / Identities → Evidence to show what actually exists.
By comparing these two chains within one connected model, organizations can spot coverage gaps, trace obligations to proof, and continuously validate that policies are enforced in practice. Below are several graph analytical techniques that let you draw critical insights from your compliance graphs.
Reachability
Reachability analysis finds what connects to what across the graph. In compliance, it answers practical questions like:
- Which assets does a given control touch?
- Which systems will a policy change impact?
- Where does personal data flow downstream?
This helps with impact analysis, audit scoping, and data lineage tracing. For example:
MATCH (c:Control)-[:APPLIES_TO]->(a:Asset)
RETURN c, a;
This simple Cypher query reveals which assets each control governs, no spreadsheets required. By visualizing these links, teams can instantly trace how a single requirement influences the broader environment.

Centrality
Centrality measures how influential or connected a node is within the graph. In a compliance graph, this highlights:
- High-leverage controls that satisfy many requirements.
- Critical assets that multiple controls depend on.
For instance, a single IAM control protecting dozens of systems may appear as a highly central node, meaning its failure would create outsized risk. By ranking nodes by centrality, teams can prioritize testing, hardening, and remediation where it matters most.
Cycle Detection
Cycle detection scans relationships to uncover loops and circular approvals that threaten process integrity. In compliance graphs, it can reveal:
- Approval loops that let a requester approve their own access.
- Circular exception paths or dependency chains that bypass segregation-of-duties policies.
By visualizing these cycles, compliance teams can fix broken workflows early, enforce separation of duties, and prevent audit findings tied to process control failures.
Community Detection
Community detection groups nodes that naturally belong together and flags outliers. In a compliance graph, this helps identify:
- Shadow IT assets or mis-scoped systems.
- Datasets with weak links to required controls or owners.
These clusters are also powerful for automation. You can train models to recommend access policies for similar users or applications, or to score risk for groups of assets based on their cluster’s control density and incident history. The result is faster anomaly triage, smarter IAM decisions, and risk scores that reflect systems’ behavior in context.
Pattern Matching
Pattern matching checks the graph for required relationship structures, flagging what should exist but doesn’t. In access governance, for example, every role granting access to a privileged asset should also require MFA and a quarterly review. With a compliance graph, that rule easily translates to a graph query:
MATCH (r:Role)-[:GRANTS_ACCESS]->(a:Asset {class:'Privileged'})
WHERE NOT (r)-[:REQUIRES_AUTH]->(:Control {name:'MFA'})
   OR NOT (r)-[:REQUIRES_AUDIT_INTERVAL]->(:Interval {name:'Quarterly'})
RETURN r, a;
This instantly returns violating roles and the privileged assets they reach, pinpointing where risk is highest. Pattern queries like this turn static compliance rules into living controls that can be continuously validated.
Benefits of Using a Compliance Graph
A compliance graph transforms how organizations understand and manage compliance data. Instead of treating regulations, controls, risks, and evidence as separate silos, it connects them in a single, queryable network. This shift unlocks several concrete advantages.
End-to-End Traceability
Compliance graphs link requirements to policies, controls, assets, data, identities, and evidence, creating a single connected path from obligation to proof. This eliminates fragmented reporting across systems and departments, replacing email chains and ad hoc exports with a clear, audit-ready view. Point-in-time details, such as versions and effective dates, ensure precision in responses to auditors.
Coverage and Gap Detection
By making relationships explicit, the graph surfaces gaps early: requirements without mapped controls, in-scope assets without coverage, or expired exceptions. Teams can route issues directly to owners with exact nodes and links needing attention, reducing duplication and ensuring shared controls are consistently applied across frameworks.
Change Impact Analysis
Before making changes to policies or controls, you can traverse the graph to understand which systems, reports, and owners will be affected. This prevents unintended regressions, reduces post-change rework, and ensures compliance is maintained across overlapping standards.
Shared-Control Prioritization
Controls that satisfy multiple requirements, across ISO 27001, SOC 2, PCI, GDPR, and others, are easily identified. The graph helps teams prioritize high-leverage controls first, retiring redundant efforts, and improving coverage in several standards simultaneously.
Continuous Assurance
Instead of relying on quarterly reviews and spreadsheets, compliance graphs enable ongoing monitoring of coverage, evidence freshness, and exceptions. Alerts are tied to owners in real time, ensuring the compliance posture remains accurate and remediation occurs promptly.
Real-World Use Cases
While the underlying compliance graph is universal, each industry has unique regulatory pressures and data priorities. The same graph can be leveraged from different angles to address these specific challenges.
Financial Services
Finance is one of the most heavily regulated industries, juggling standards like GDPR, SOX, PCI DSS, and Anti-Money Laundering (AML). A compliance graph links customers, accounts, transactions, entitlements, controls, and evidence in a single view.
- Reachability allows teams to trace suspicious money flows across accounts and merchants.
- Centrality surfaces shared controls that protect multiple in-scope systems.
- Pattern matching can detect violations, such as users who both create and approve the same journal entries.
By connecting regulations to controls and assets in one network, firms achieve tighter AML reviews, cleaner access attestations, and a clearer PCI scope. Instead of reconciling spreadsheets across departments, teams can now identify exposures and control gaps instantly.
Cybersecurity
Security teams must comply with ISO 27001, SOC 2, NIST CSF, and CIS benchmarks, but telemetry and ownership are often scattered across tools. A compliance graph ties together assets, identities, roles, controls, vulnerabilities, network zones, and tickets.
- Community detection identifies shadow IT and weakly connected assets lacking clear owners.
- Cycle detection reveals approval loops in change management processes.
- Reachability highlights exposure paths to sensitive datasets and flags critical CVEs on unpatched assets.
This approach replaces manual spreadsheet hunts with targeted, evidence-backed remediation, improving both response time and accuracy. Organizations gain real-time visibility into critical risks and dependencies.
Healthcare
Healthcare organizations must meet HIPAA, HITECH, and often HITRUST standards, while PHI moves across clinical systems, analytics platforms, and backups. A compliance graph links PHI datasets to systems, vendors, Business Associate Agreements (BAAs), policies, and access lineage.
- Community detection clusters vendors by PHI handled and flags outliers missing current BAAs.
- Pattern matching ensures privileged access uses MFA with timely reviews and that emergency access is time-boxed and documented.
- Reachability traces data flow and verifies encryption and residency compliance.
By centralizing controls, datasets, and evidence, healthcare organizations maintain complete audit trails, ensure PHI flows remain compliant, and identify access risks more efficiently. This reduces manual effort while improving both security and regulatory posture.
How to Build a Compliance Graph
Building a compliance graph requires careful planning, as each step, from scoping to analysis, directly impacts its accuracy and usefulness. The process can be broken down into four key steps: Scope, Collect, Model, and Analyze & Visualize.

Scope
Scoping sets clear boundaries to ensure your graph reflects the organization’s regulatory and operational landscape. Different frameworks prioritize different slices:
- GDPR focuses on data categories, subjects, purposes, consent, residency, and cross-border flows.
- Cybersecurity frameworks like ISO 27001, SOC 2, NIST CSF, and CIS Benchmarks emphasize control families, asset posture, and continuous monitoring.
- HIPAA/HITECH zeroes in on PHI, covered entities, business associates, safeguards, and audit trails.
Decide which slices apply, which business units and systems fall in scope, and what constitutes “in-scope” data, assets, identities, and vendors. Correct scoping prevents unnecessary complexity, ensures effort is focused on high-value areas, and reduces noise in the final graph.
Collect
Once the scope is defined, gather only relevant data from core sources to maintain efficiency and accuracy. Typical sources include:
- HR systems: employee roles, entitlements, and approvals.
- IT systems: configuration records, access logs, and system inventories.
- Security tools: vulnerability scans, incident tickets, and audit reports.
For each data element, retain essential details such as original IDs, owners, timestamps, and source links. This ensures provenance and traceability, which are crucial for audits and regulatory compliance. Focused collection prevents teams from chasing low-value rabbit holes while building a graph that mirrors reality.
Model
Transform the collected data into a graph structure by identifying nodes and edges. Nodes typically represent requirements, controls, assets, identities, and evidence. Edges define the relationships between them, such as:
- “Control enforces Requirement”
- “Asset is governed by Control”
- “Evidence validates Control”
Both structured (tables, configs, catalogs) and unstructured data (policies, audits, tickets, PDFs) can be used. For unstructured content, natural language processing (NLP) or rule-based extraction can identify entities and propose relationships. Each node and edge should include provenance and timestamps, maintaining trustworthiness and auditability.
Analyze and Visualize
With the graph in place, its full value emerges through analytics and visualization. Key activities include:
- Coverage Analysis: Identify gaps where requirements lack mapped controls or evidence is missing or outdated.
- Dashboards & Alerts: Track coverage rate, evidence age, exceptions nearing expiry, and mean time to remediate (MTTR).
- Point-in-Time Views: Answer questions like “What was true on March 31?” without rebuilding reports.
Advanced graph analytics such as reachability, centrality, cycle detection, and community detection help prioritize high-risk areas, visualize dependencies, and uncover hidden gaps. Integrating these insights into tickets or workflows ensures teams remediate the right issues quickly, rather than reacting to incomplete or outdated information.
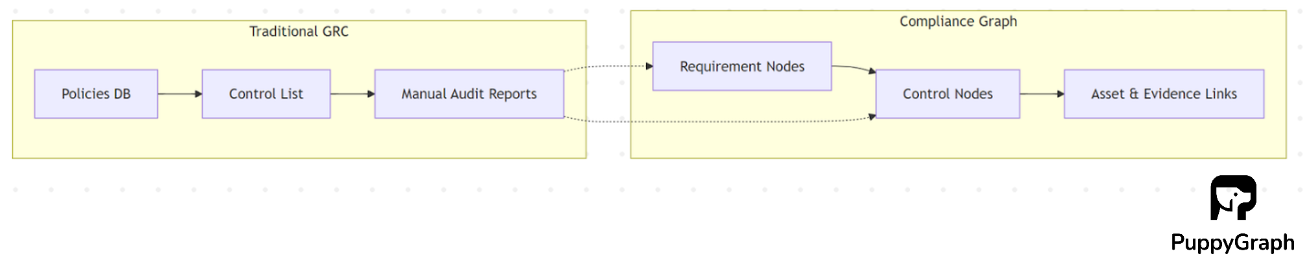
Integrating Compliance Graphs with GRC Platforms
GRC platforms remain the system of record for policies, controls, tests, and issues. A compliance graph complements GRC by enabling multi-hop queries that traditional record-centric tools struggle to answer. For example, from a single policy change, you can:
- Trace the blast radius across downstream assets, owners, and reports.
- Follow PII lineage across systems to detect cross-border flows.
- Identify shared controls that satisfy multiple requirements across frameworks.
By connecting these relationships in a graph, organizations gain faster, deeper insights without overloading the GRC system or forcing it to do tasks it wasn’t designed for.
Future of Compliance Graphs: AI, Automation & Predictive Insights
Automated Graph Modeling
Most compliance evidence exists in unstructured sources such as PDFs, wikis, tickets, and emails. AI can quickly parse this content to extract candidate nodes, requirements, policies, controls, assets, identities, and evidence, and propose edges between them with source links and timestamps. Reviewers stay in the loop to accept or correct suggestions, transforming slow copy-paste work into fast, auditable graph construction. The result is a queryable compliance graph built from existing data, ready for coverage checks and analytics.
Automation for Missing Links
Keep a live dashboard that continuously queries the graph for gaps and stale proof. Encode rules like “in-scope asset → required control → current evidence” or “privileged role → MFA → quarterly review,” and surface violations in real time. When edges include versions and effective dates, the dashboard can show both current breaks and “as-of” views for audits. Each alert links to the exact missing relationships so owners can fix the right gap quickly and efficiently.
Knowledge and Predictions
A compliance graph doubles as a knowledge graph you can query with natural language. With GraphRAG, retrieval follows the structure from requirements to policies to controls to assets and evidence, so answers come with the right context and the most relevant proof. The same graph can be turned into graph embeddings for machine learning, which enables suggestions such as:
- Suggesting control mappings for new requirements.
- Recommending access policies for new roles.
- Generating risk scores for asset groups that resemble past incidents.
As reviewers accept or reject AI suggestions, the models improve over time, making predictions sharper and more actionable.

Getting Started with Compliance Graphs
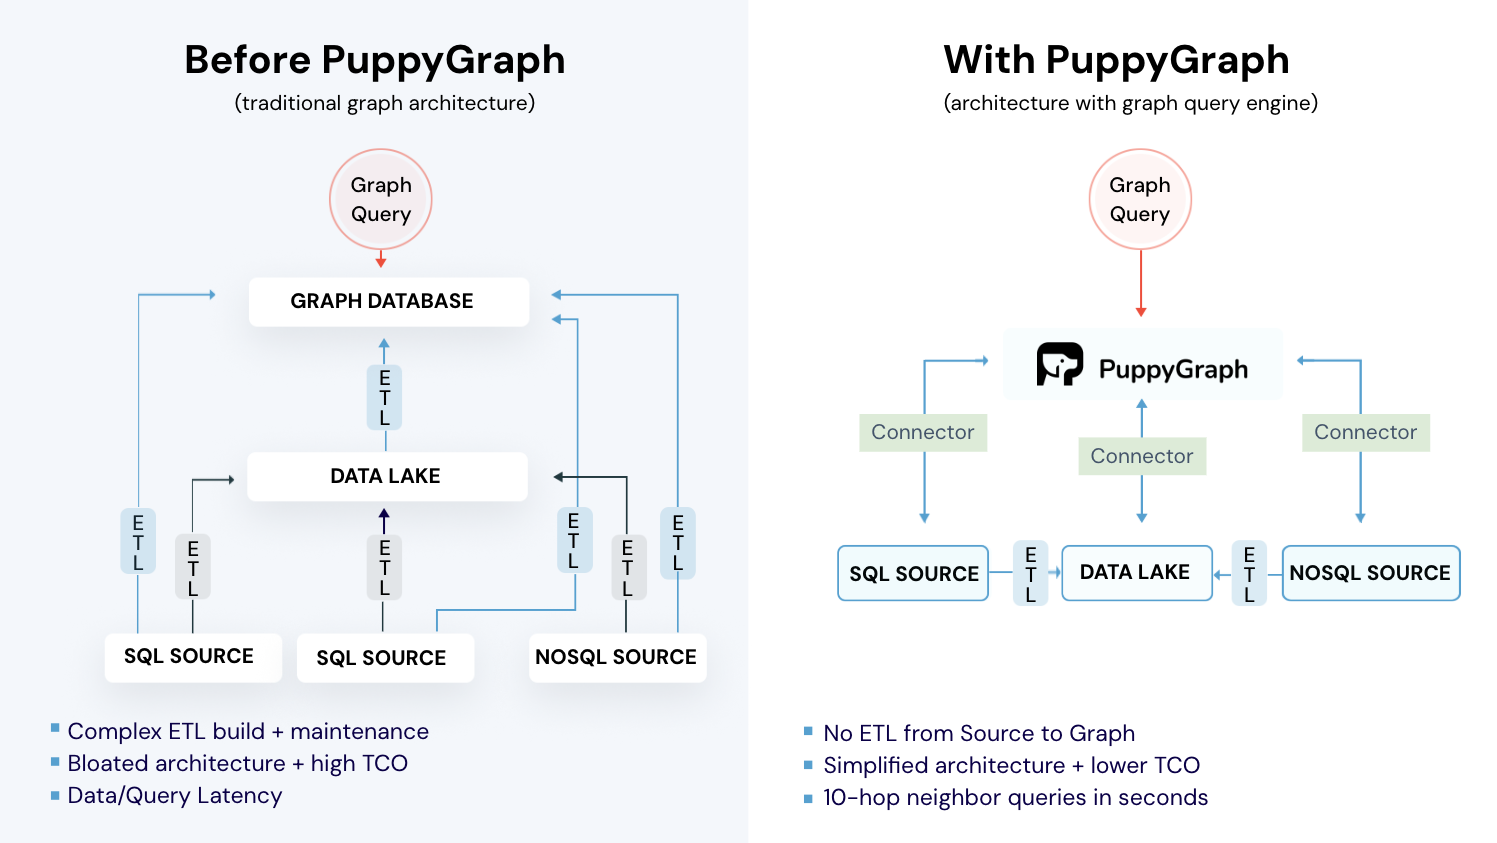
Compliance graphs work alongside your GRC platform. While GRC remains the system of record for policies, controls, tests, and issues, a compliance graph enables multi-hop analytics that traditional record-centric tools struggle to answer. The catch with traditional graph databases is the heavy ETL and the need to maintain a separate copy of sensitive data spread across many systems. It’s hard to justify the costs. PuppyGraph offers a real-time, zero-ETL alternative.

PuppyGraph allows data teams to query existing relational stores as a unified graph, getting up and running in under 10 minutes. It runs directly on your existing data infrastructure, whether in data warehouses, lakes, or databases, without copying or moving sensitive data. This "zero-ETL" approach saves time, reduces operational overhead, and avoids the cost and latency of maintaining a separate graph database.
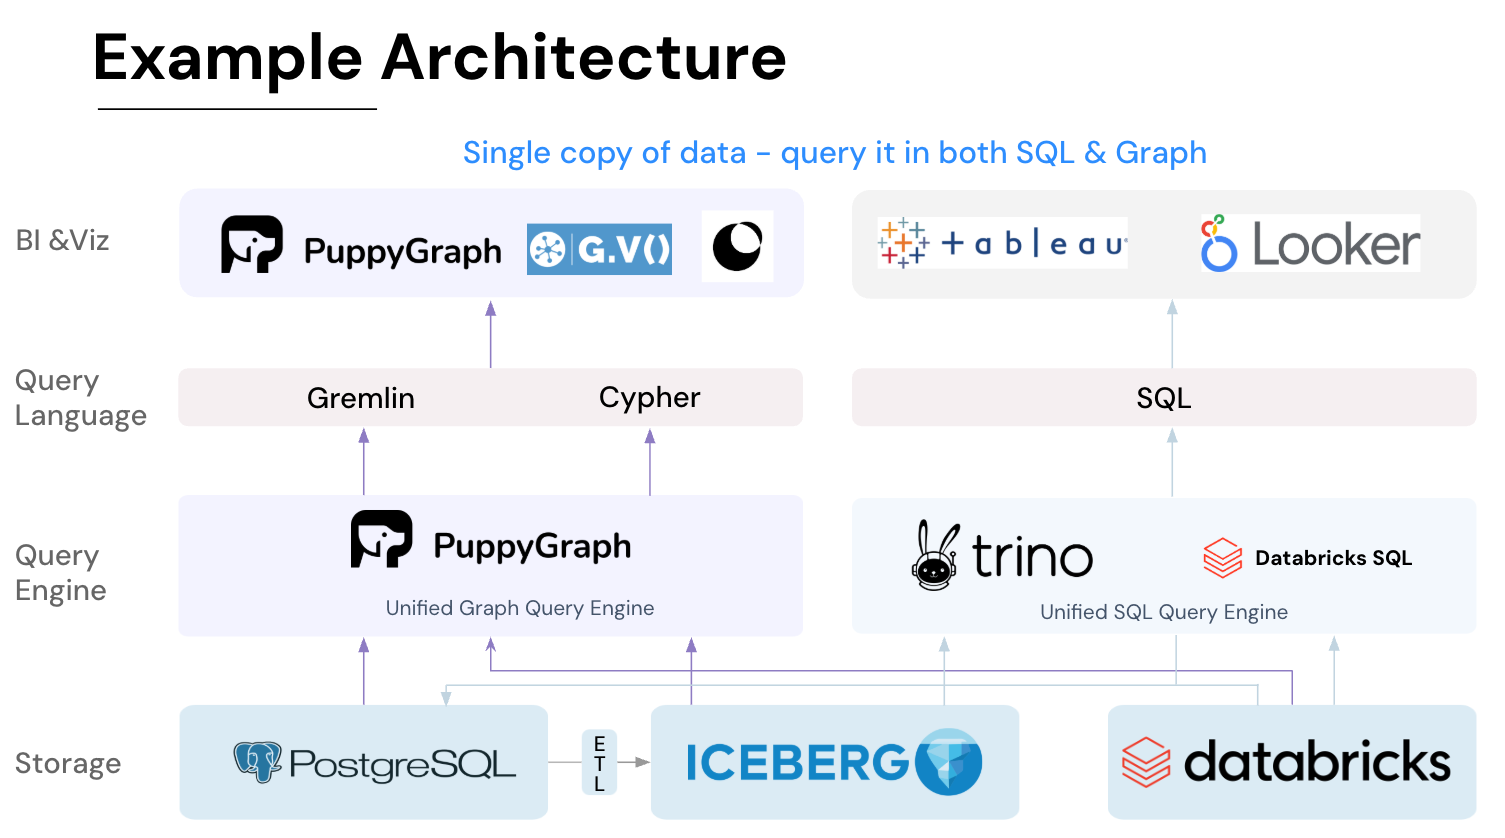
Even if you don’t have a dedicated GRC platform, you can still benefit from the unified view provided by a compliance graph. PuppyGraph connects to sources including PostgreSQL, Apache Iceberg, Delta Lake, BigQuery, and others, building a virtual graph layer. Teams can use expressive graph query languages like Gremlin and openCypher to answer real compliance questions:
- Assess the blast radius of a control change.
- Trace PII lineage across systems.
- Detect cross-framework control overlaps.
PuppyGraph also supports flexible graph views, so the same model can serve different frameworks and double as a knowledge graph for tasks like flagging fraudulent transactions or strengthening your cybersecurity posture.

Key PuppyGraph capabilities include:
- Zero ETL: PuppyGraph runs as a query engine on your existing relational databases and lakes. Skip pipeline builds, reduce fragility, and start querying as a graph in minutes.
- No Data Duplication: Query your data in place, eliminating the need to copy large datasets into a separate graph database. This ensures data consistency and leverages existing data access controls.
- Real Time Analysis: By querying live source data, analyses reflect the current state of the environment, mitigating the problem of relying on static, potentially outdated graph snapshots. PuppyGraph users report 6-hop queries across billions of edges in less than 3 seconds.
- Scalable Performance: PuppyGraph’s distributed compute engine scales with your cluster size. Run petabyte-scale workloads and deep traversals like 10-hop neighbors, and get answers back in seconds. This exceptional query performance is achieved through the use of parallel processing and vectorized evaluation technology.
- Best of SQL and Graph: Because PuppyGraph queries your data in place, teams can use their existing SQL engines for tabular workloads and PuppyGraph for relationship-heavy analysis, all on the same source tables. No need to force every use case through a graph database or retrain teams on a new query language.
- Lower Total Cost of Ownership: Graph databases make you pay twice — once for pipelines, duplicated storage, and parallel governance, and again for the high-memory hardware needed to make them fast. PuppyGraph removes both costs by querying your lake directly with zero ETL and no second system to maintain. No massive RAM bills, no duplicated ACLs, and no extra infrastructure to secure.
- Flexible and Iterative Modeling: Using metadata driven schemas allows creating multiple graph views from the same underlying data. Models can be iterated upon quickly without rebuilding data pipelines, supporting agile analysis workflows.
- Standard Querying and Visualization: Support for standard graph query languages (openCypher, Gremlin) and integrated visualization tools helps analysts explore relationships intuitively and effectively.
- Proven at Enterprise Scale: PuppyGraph is already used by half of the top 20 cybersecurity companies, as well as engineering-driven enterprises like AMD and Coinbase. Whether it’s multi-hop security reasoning, asset intelligence, or deep relationship queries across massive datasets, these teams trust PuppyGraph to replace slow ETL pipelines and complex graph stacks with a simpler, faster architecture.


Getting started is quick. Most teams go from deploy to query in minutes. You can run PuppyGraph with Docker, AWS AMI, GCP Marketplace, or deploy it inside your VPC for full control.
Conclusion
Compliance data is fragmented, and standards overlap. A compliance graph provides a single, connected view linking requirements, policies, controls, assets, and evidence. This enables end-to-end traceability, gap detection, and change impact analysis.
With AI and automation, unstructured documents can be converted into graph facts, missing links flagged in real time, and GraphRAG-powered queries provide natural-language answers. Graph embeddings enable ML-driven suggestions for controls, access policies, and risk scoring.
Experience the benefits without standing up a separate graph database: try PuppyGraph with our forever-free Developer Edition or schedule a free demo today.

Jaz Ku is a Solution Architect with a background in Computer Science and an interest in technical writing. She earned her Bachelor's degree from the University of San Francisco, where she did research involving Rust’s compiler infrastructure. Jaz enjoys the challenge of explaining complex ideas in a clear and straightforward way.

Get started with PuppyGraph!


Developer Edition
- Forever free
- Single noded
- Designed for proving your ideas
- Available via Docker install
Enterprise Edition
- 30-day free trial with full features
- Everything in developer edition & enterprise features
- Designed for production
- Available via AWS AMI & Docker install