

ETL Graph Explained: Visualizing and Optimizing Data Pipelines
Modern data ecosystems have become increasingly complex as organizations collect data from transactional systems, APIs, IoT devices, analytics platforms, and cloud services. Traditional ETL pipelines were designed as sequential workflows, but today’s pipelines often involve dozens of transformations, conditional branches, and parallel execution stages. As complexity increases, understanding dependencies, identifying bottlenecks, and tracking lineage becomes significantly harder. This is where ETL graphs provide a powerful alternative perspective.
An ETL graph models the entire data pipeline as a connected network of nodes and edges, representing datasets, transformations, jobs, and data flows. Instead of thinking in terms of linear scripts or step-by-step processes, engineers can visualize pipelines as dynamic structures where relationships and dependencies become clear. Graph modeling helps teams reason about data lineage, impact analysis, failure propagation, and optimization strategies.
This article explains what ETL graphs are, how they represent pipelines, and how graph modeling enhances visibility and operational efficiency. It also explores architecture patterns, implementation steps, and how modern tools like PuppyGraph help organizations build virtual graph views on top of existing data infrastructure.
What Is an ETL Graph?
An ETL graph is a conceptual and technical representation of extract-transform-load workflows using graph structures. In this model, nodes represent entities such as datasets, transformation steps, tasks, or data sources, while edges represent relationships like data movement or dependency flows. Instead of visualizing pipelines as static sequences, ETL graphs capture the interconnected nature of modern data processing systems.
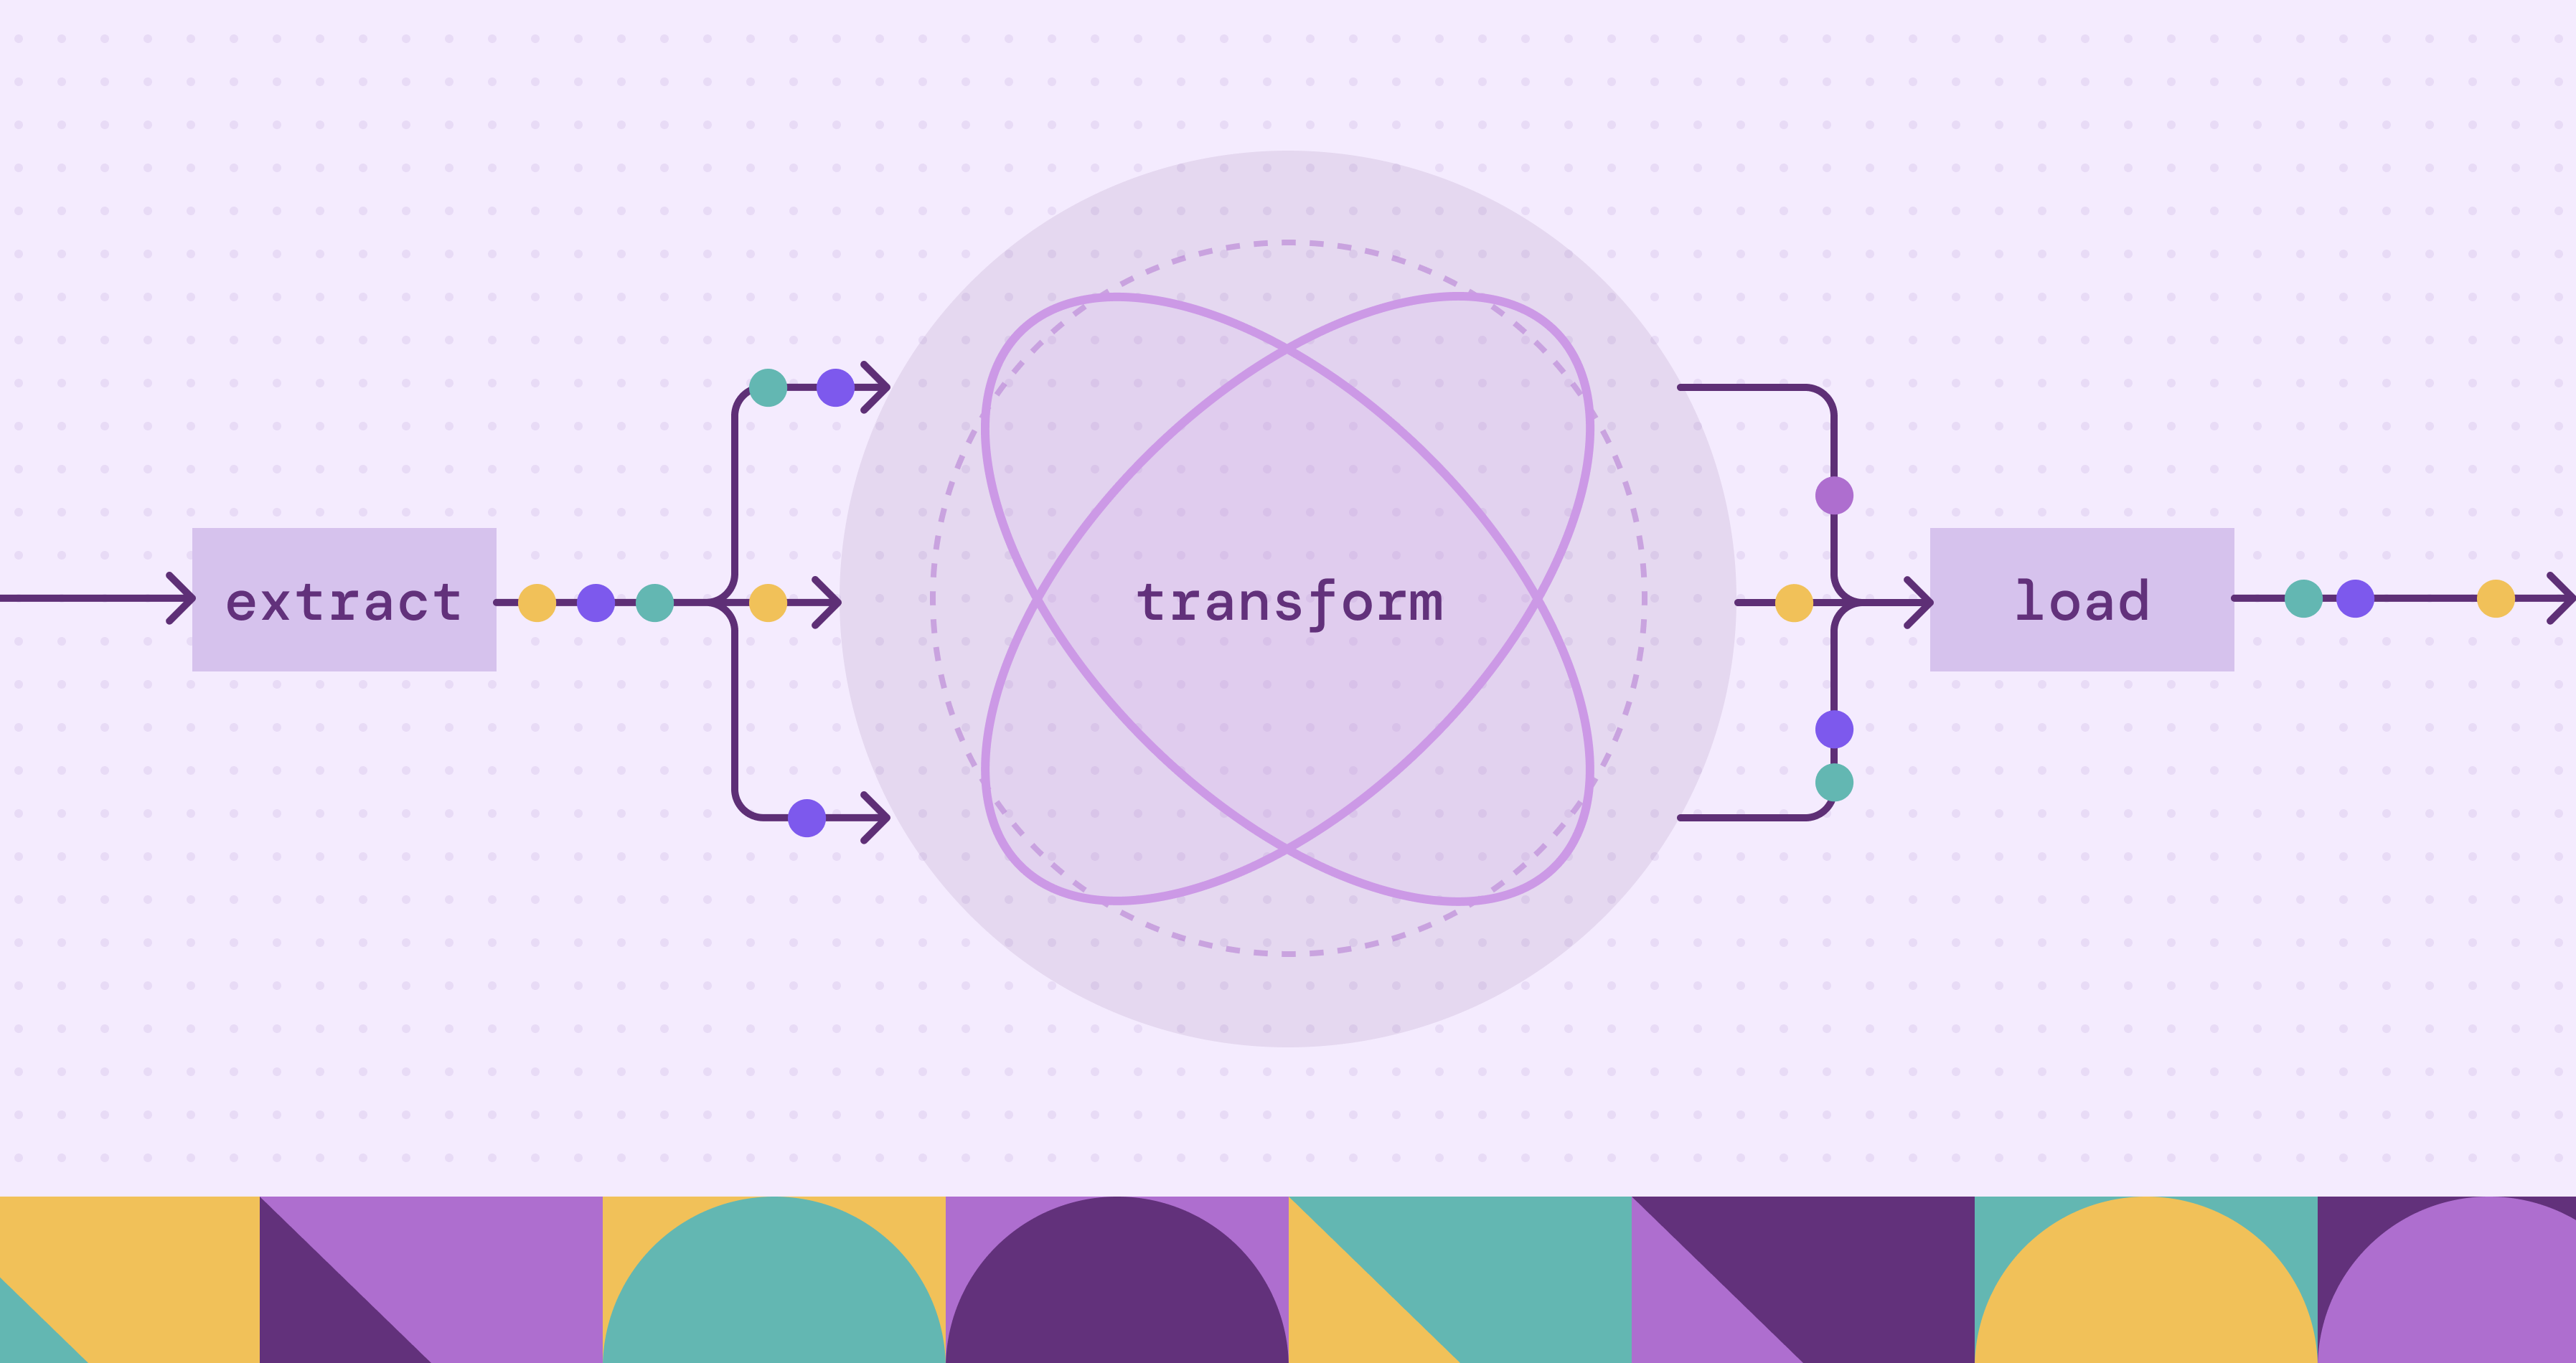
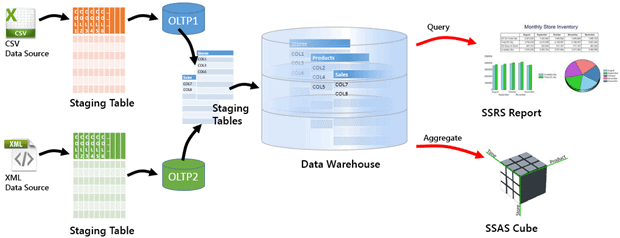
Traditional ETL pipelines involve extracting data from sources, transforming it into consistent formats, and loading it into storage systems such as data warehouses or lakes.
An ETL graph represents the ETL process by modeling each extraction, transformation, and loading step as connected elements within a unified structure. Rather than describing workflows as sequential stages, it captures how operations interact, depend on upstream data, and propagate changes across the pipeline. This allows engineers to see how transformations depend on upstream datasets, how changes propagate through the system, and how failures might impact downstream consumers. Instead of static diagrams, ETL graphs can be dynamically generated from metadata or execution logs, offering real-time insights into data flows.
Graph representations are particularly valuable in distributed environments where pipelines span multiple tools and storage systems. By modeling ETL workflows as graphs, teams gain a unified view of complex orchestration logic and can reason about pipelines at scale.
How ETL Graphs Represent Data Pipelines
ETL graphs represent data pipelines as structured, directed graph architectures that model how data moves, transforms, and depends on upstream processes. Instead of describing workflows as linear scripts or isolated jobs, an ETL graph treats the entire pipeline as an interconnected system composed of nodes and edges. Functional pipeline components exist as conceptual groupings of nodes rather than separate structural elements. This unified structure allows engineers to understand execution logic, operational dependencies, and system architecture in a single view.
Nodes: Functional Units of the Pipeline
Nodes represent the core building blocks of an ETL pipeline. Each node corresponds to a specific entity or operation within the data lifecycle. Depending on the implementation, nodes can be categorized by function, including:
- Data Source Nodes: external systems, APIs, transactional databases, or streaming platforms where data originates.
- Processing Nodes: transformations, aggregations, enrichment tasks, validation checks, or machine learning inference steps.
- Storage Nodes: data warehouses, lakehouse tables, or analytics datasets that store processed results.
- Operational Nodes: orchestration jobs, scheduling tasks, monitoring checkpoints, or data quality gates.
These functional categories can be viewed as abstract pipeline components used to organize nodes conceptually. They do not introduce additional structural elements beyond the nodes themselves.
Nodes can carry attributes such as schema information, execution time, ownership, data freshness, resource usage, or data volume. These attributes enable performance analysis, governance tracking, and operational monitoring directly within the graph model.
Edges: Dependencies and Data Flow
Edges define the relationships between nodes and describe how data and execution dependencies propagate through the pipeline. Directed edges indicate the order of execution and the flow of information between stages.
Common edge types include:
- Data Flow Edges: represent how datasets move from extraction to transformation and storage stages.
- Dependency Edges: define task prerequisites, showing which jobs must complete before others begin.
- Control Flow Edges: represent conditional logic, branching paths, or parallel execution stages.
Edges may also include attributes such as processing latency, failure rates, transformation complexity, or data lineage metadata. By embedding operational metrics into edges, ETL graphs allow engineers to analyze critical paths, identify bottlenecks, and trace failure propagation across distributed systems.
Graph Architecture and Pipeline Components
At an architectural level, an ETL graph models the pipeline structure entirely through nodes and edges. Pipeline components are conceptual layers formed by grouping nodes according to their functional role rather than separate graph entities. The architecture therefore emerges from how nodes are organized and connected.
Common conceptual pipeline layers include:
- Ingestion Layer: nodes representing extraction jobs and raw data sources.
- Transformation Layer: nodes performing cleansing, joins, enrichment, and business logic processing.
- Storage and Consumption Layer: nodes representing downstream analytics tables, dashboards, or machine learning pipelines.
- Operational Control Layer: orchestration systems, scheduling engines, monitoring services, and validation processes that coordinate execution.
Metadata collected from orchestration platforms or execution logs forms the structural foundation of this architecture. The resulting graph provides both a logical model of pipeline structure and an operational view of runtime behavior. Because the architecture is derived from the continuously updated graph structure of nodes and edges rather than static diagrams, it can be updated dynamically and analyzed programmatically.
A Unified Representation of ETL Graph Architecture
By combining nodes and edges into a single directed structure, ETL graphs serve as a living architectural model of data pipelines. Conceptual pipeline components help organize and interpret the structure. Engineers can visualize complex branching workflows, understand how changes propagate through dependencies, and perform automated lineage analysis at scale. Rather than separating workflow design, monitoring, and architecture documentation, the ETL graph unifies them into one continuously evolving representation of the organization’s data infrastructure.
ETL Graph vs Traditional ETL Workflow Diagrams
Traditional ETL workflow diagrams are typically static representations created manually using flowcharts or diagramming tools. While useful for documentation, they often become outdated as pipelines evolve. Maintaining accuracy requires continuous manual updates, which is difficult in fast-changing data environments.
ETL graphs, by contrast, are often generated automatically from pipeline metadata or orchestration engines. This ensures that the visualization reflects the current state of the system. Graph-based views are interactive, allowing engineers to explore dependencies, filter by dataset, or trace lineage across systems in real time.
Another key difference lies in scalability. Traditional diagrams struggle to represent large pipelines with hundreds of nodes. Graph-based visualizations handle complex structures more naturally because they rely on data-driven rendering rather than manual drawing. Engineers can zoom into specific sections or analyze high-level topology without losing context.
Graph representations also enable computational analysis. Algorithms can identify cycles, detect bottlenecks, or estimate execution critical paths. Traditional diagrams lack this analytical capability because they are static images rather than structured data models.
Benefits of Using Graphs for ETL and Data Lineage
Graph modeling brings significant advantages to ETL operations and data lineage tracking. One major benefit is improved visibility into dependencies. Engineers can instantly identify which downstream datasets will be affected by a schema change or transformation modification. This makes impact analysis faster and reduces the risk of unintended disruptions.
Another advantage is enhanced debugging and monitoring. When a job fails, the graph structure makes it easy to trace upstream sources and downstream consumers. Instead of searching through logs or scripts, teams can navigate the graph visually to identify failure points.
Graph-based lineage tracking also supports governance and compliance initiatives. Organizations can maintain a complete history of how data moves and transforms across systems, which is essential for regulatory reporting and audit processes.
Additionally, ETL graphs enable performance optimization. By analyzing node execution times and dependency chains, engineers can identify critical paths that determine overall pipeline latency. This allows targeted optimization efforts that improve throughput and resource utilization across distributed environments.
Building an ETL Graph Step-by-Step
The following step-by-step process demonstrates how engineers can design, construct, and operationalize an ETL graph with real pipeline metadata.
- Define the Scope and Collect Metadata
Begin by defining the scope of the pipelines and identifying relevant metadata sources. Engineers typically extract information about tasks, datasets, dependencies, and execution states from workflow engines or job schedulers. This metadata forms the foundation of the ETL graph. - Model Nodes and Edges
Define nodes and edges based on pipeline semantics. Each dataset or job becomes a node, while dependencies form edges between them. Additional attributes, such as schema details, ownership, and performance metrics, can be attached to nodes or edges to enrich the graph model. - Store and Visualize the Graph
Once the structure is defined, store the graph in a graph database or represent it as a virtual graph on top of existing systems. Visualization tools can then render interactive diagrams that help users explore lineage, dependencies, and workflow relationships. - Integrate Monitoring and Automation
Implement automated updates so the graph reflects real-time pipeline changes. Monitoring systems can generate alerts when critical paths are delayed or when schema changes impact downstream systems. Over time, the ETL graph evolves into a living representation of the organization’s data infrastructure.
How PuppyGraph Helps Build and Operate ETL Graphs
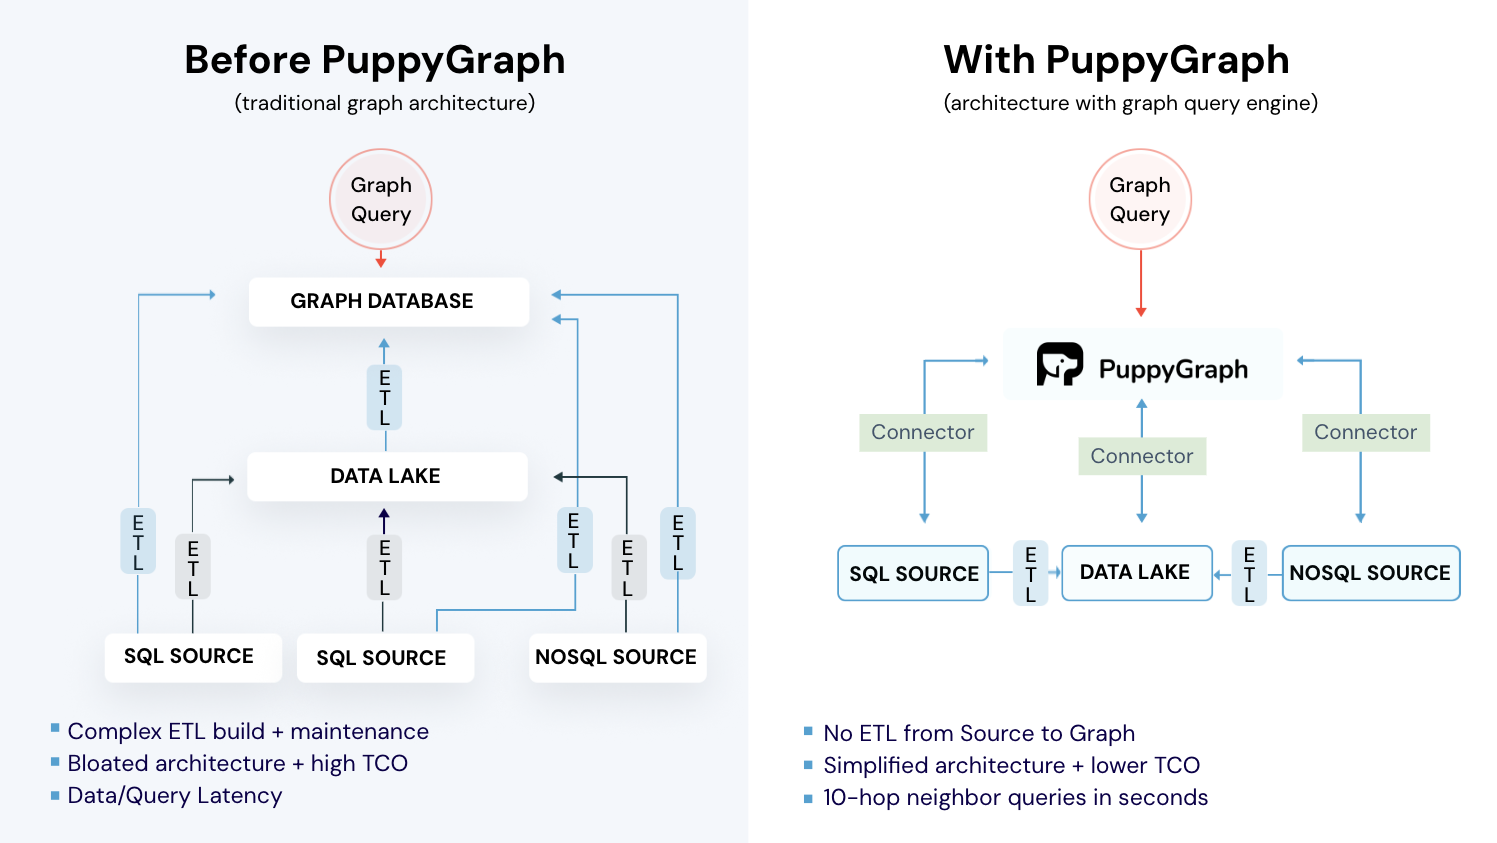
Building and maintaining ETL graphs across modern, distributed data ecosystems can be difficult. Pipeline metadata often lives in multiple systems such as orchestration engines, relational tables, logging platforms, and analytics tools. Traditional approaches typically require exporting this metadata into a separate graph database through additional ETL pipelines, introducing duplicated storage, delayed updates, and ongoing maintenance overhead. PuppyGraph simplifies this process by providing a virtual graph layer that constructs and queries ETL graphs directly on top of existing data sources in real time.
Constructing a Virtual ETL Graph Layer
Instead of physically moving data into a graph database, PuppyGraph builds a logical graph view using metadata that already describes pipelines. Existing tables or logs that represent datasets, transformation jobs, schedules, dependencies, or downstream consumers serve as the foundation. Using a graph schema definition, engineers map these relational structures into graph elements:
- Tables describing datasets, pipeline stages, or jobs become graph nodes.
- Dependency relationships, execution flows, or data transfers become graph edges.
- Operational metadata such as execution time, ownership, or lineage information becomes node or edge attributes.
This schema-driven mapping creates a virtual ETL graph without duplicating data. Because the graph is defined as a metadata layer rather than a physical structure, teams can quickly iterate on modeling decisions, create multiple graph views from the same underlying data, and adjust schemas without rebuilding pipelines.
Query-Time Graph Construction on Live Data
Once the virtual graph schema is defined, ETL graph queries are evaluated directly against live source systems at query time. PuppyGraph dynamically interprets relational data as graph structures during traversal execution. This ensures that lineage views, dependency analysis, and operational insights always reflect the current state of the pipeline rather than a periodically refreshed snapshot.
Because the graph exists as a virtual layer, engineers can explore relationships using graph query languages such as openCypher or Gremlin while underlying data remains in relational databases or lakehouse storage. The result is a continuously updated, operationally accurate ETL graph derived from real pipeline metadata.
PuppyGraph is the first and only real time, zero-ETL graph query engine in the market, empowering data teams to query existing relational data stores as a unified graph model that can be deployed in under 10 minutes, bypassing traditional graph databases' cost, latency, and maintenance hurdles.
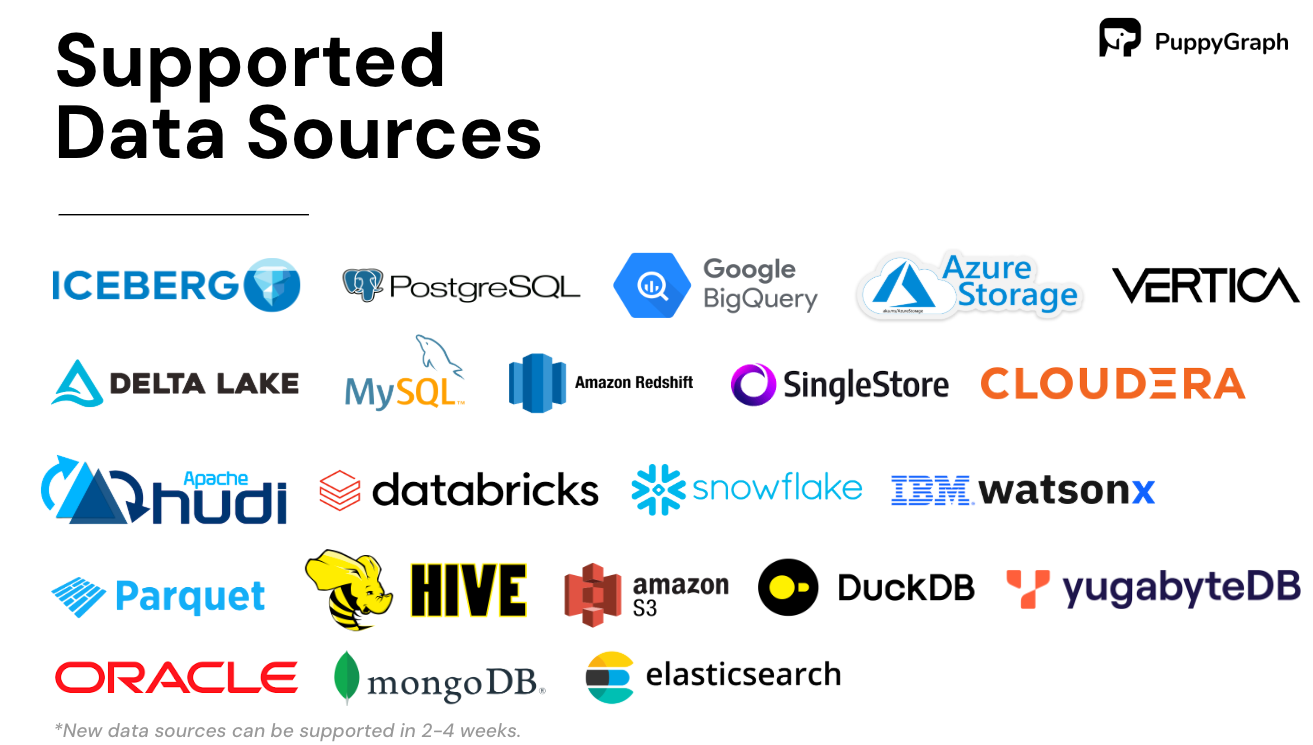
It seamlessly integrates with data lakes like Apache Iceberg, Apache Hudi, and Delta Lake, as well as databases including MySQL, PostgreSQL, and DuckDB, so you can query across multiple sources simultaneously.
Key PuppyGraph capabilities include:
- Zero ETL: PuppyGraph runs as a query engine on your existing relational databases and lakes. Skip pipeline builds, reduce fragility, and start querying as a graph in minutes.
- No Data Duplication: Query your data in place, eliminating the need to copy large datasets into a separate graph database. This ensures data consistency and leverages existing data access controls.
- Real Time Analysis: By querying live source data, analyses reflect the current state of the environment, mitigating the problem of relying on static, potentially outdated graph snapshots. PuppyGraph users report 6-hop queries across billions of edges in less than 3 seconds.
- Scalable Performance: PuppyGraph’s distributed compute engine scales with your cluster size. Run petabyte-scale workloads and deep traversals like 10-hop neighbors, and get answers back in seconds. This exceptional query performance is achieved through the use of parallel processing and vectorized evaluation technology.
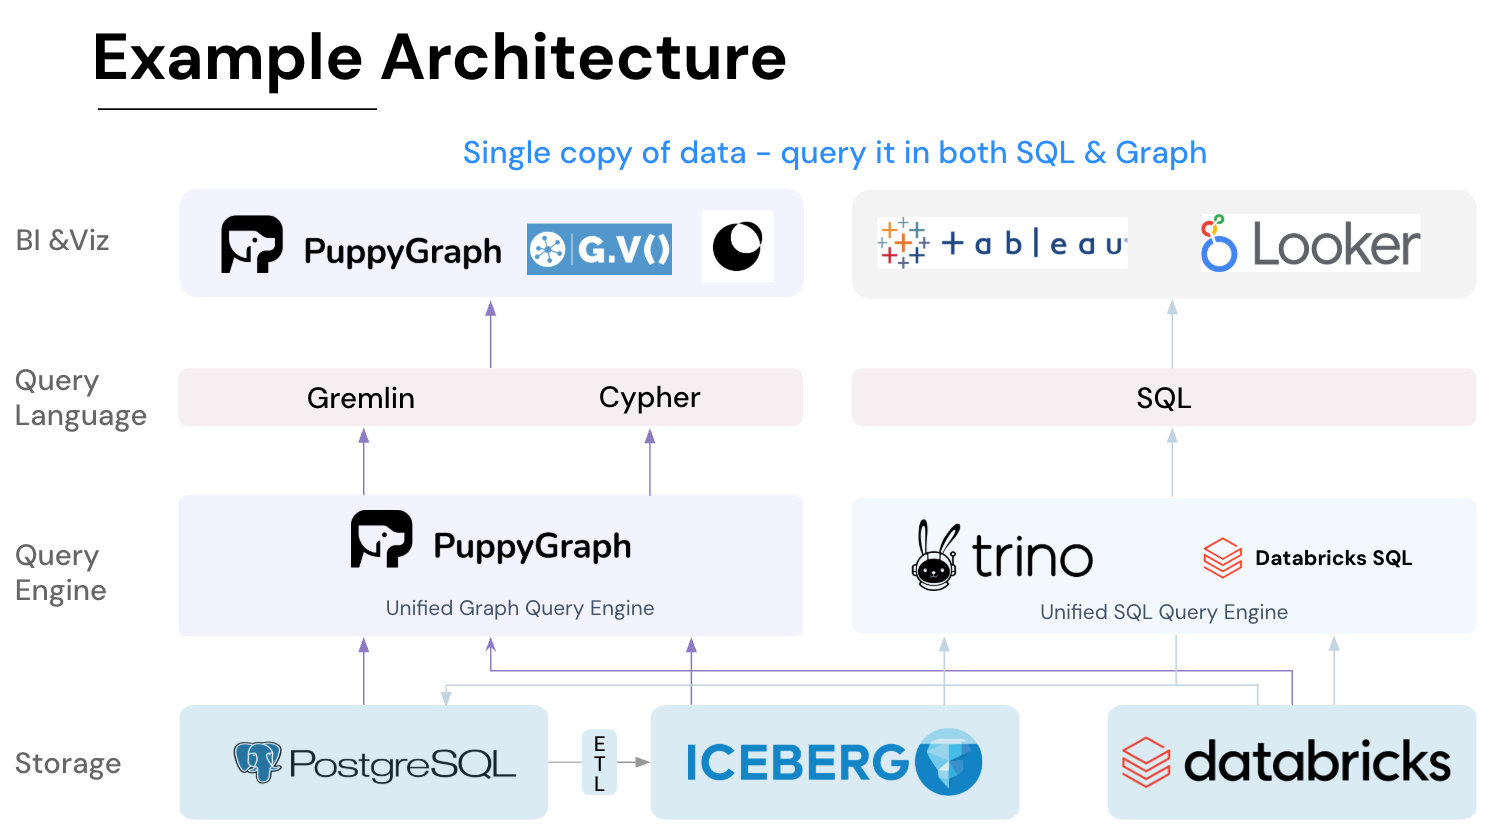
- Best of SQL and Graph: Because PuppyGraph queries your data in place, teams can use their existing SQL engines for tabular workloads and PuppyGraph for relationship-heavy analysis, all on the same source tables. No need to force every use case through a graph database or retrain teams on a new query language.
- Lower Total Cost of Ownership: Graph databases make you pay twice — once for pipelines, duplicated storage, and parallel governance, and again for the high-memory hardware needed to make them fast. PuppyGraph removes both costs by querying your lake directly with zero ETL and no second system to maintain. No massive RAM bills, no duplicated ACLs, and no extra infrastructure to secure.
- Flexible and Iterative Modeling: Using metadata driven schemas allows creating multiple graph views from the same underlying data. Models can be iterated upon quickly without rebuilding data pipelines, supporting agile analysis workflows.
- Standard Querying and Visualization: Support for standard graph query languages (openCypher, Gremlin) and integrated visualization tools helps analysts explore relationships intuitively and effectively.
- Proven at Enterprise Scale: PuppyGraph is already used by half of the top 20 cybersecurity companies, as well as engineering-driven enterprises like AMD and Coinbase. Whether it’s multi-hop security reasoning, asset intelligence, or deep relationship queries across massive datasets, these teams trust PuppyGraph to replace slow ETL pipelines and complex graph stacks with a simpler, faster architecture.
As data grows more complex, the most valuable insights often lie in how entities relate. PuppyGraph brings those insights to the surface, whether you’re modeling organizational networks, social introductions, fraud and cybersecurity graphs, or GraphRAG pipelines that trace knowledge provenance.

Deployment is simple: download the free Docker image, connect PuppyGraph to your existing data stores, define graph schemas, and start querying. PuppyGraph can be deployed via Docker, AWS AMI, GCP Marketplace, or within a VPC or data center for full data control.
Conclusion
Modern ETL pipelines have become increasingly complex, spanning multiple systems, transformations, and parallel workflows. Traditional sequential diagrams struggle to capture these intricate dependencies, making lineage tracking, impact analysis, and performance optimization challenging. ETL graphs address these limitations by representing pipelines as interconnected nodes and edges, offering a unified view of datasets, transformations, jobs, and their relationships. This graph-based approach enhances visibility, supports automated lineage analysis, and enables real-time operational insights.
PuppyGraph extends this concept by providing a virtual, zero-ETL graph layer on top of existing data infrastructure. It allows teams to query live data as a graph, perform multi-hop analyses, and explore relationships without duplicating data or maintaining separate graph databases. By combining real-time analysis, scalable performance, and flexible modeling, ETL graphs with PuppyGraph help organizations simplify pipeline management, accelerate insight generation, and reduce operational overhead.
Explore the forever-free PuppyGraph Developer Edition, or book a demo to see it in action.

Hao Wu is a Software Engineer with a strong foundation in computer science and algorithms. He earned his Bachelor’s degree in Computer Science from Fudan University and a Master’s degree from George Washington University, where he focused on graph databases.

Get started with PuppyGraph!


Developer Edition
- Forever free
- Single noded
- Designed for proving your ideas
- Available via Docker install
Enterprise Edition
- 30-day free trial with full features
- Everything in developer edition & enterprise features
- Designed for production
- Available via AWS AMI & Docker install