

Knowledge Graph Python: A Complete Guide
Knowledge graphs have become one of the most powerful ways to represent complex relationships within data. Instead of storing information in rigid tables, knowledge graphs organize data as interconnected entities and relationships. This structure allows machines to understand how concepts relate to one another, enabling richer analytics, semantic search, recommendation systems, and AI reasoning.
Python has emerged as one of the most popular languages for building and working with knowledge graphs. Its simplicity, extensive ecosystem, and strong data processing capabilities make it well suited for graph modeling, data integration, and machine learning workflows.
In this guide, we will explore how knowledge graphs work in Python, the core concepts behind them, and the most widely used libraries. You will also learn how to build a simple knowledge graph step by step and how modern platforms like PuppyGraph can simplify querying and analytics across existing data sources.
What Is a Knowledge Graph in Python?
At its core, the idea of a knowledge graph in Python is using Python as a tool to represent, query, and reason over complex relationships between entities. In a narrower sense, it refers to using Python libraries to build, manipulate, and query graph structures directly within code. In this case, graph construction and processing are performed within the Python environment itself. In a broader sense, the concept includes this approach and extends to any workflow where Python is used to work with knowledge graphs. This means Python may not only process graph data locally but also interact with external graph engines or graph databases to explore knowledge networks.
Python provides a flexible bridge between raw data and structured relational knowledge. You can use it to define entities and relationships, construct triples, or interface with graph databases like Neo4j and engines like PuppyGraph. This dual perspective, both as a modeling language and as a querying interface, is what makes Python particularly powerful for knowledge graph workflows.
In practical terms, Python-based knowledge graph processing allows developers to capture real-world entities and their connections in a machine-readable format, run complex queries, and integrate graph reasoning into larger analytics and AI pipelines. Whether you are building a graph from scratch, or querying a graph engine or graph database, Python serves as the common layer that ties together data, relationships, and computation.
Why Use Python for Building Knowledge Graphs
Python has become a preferred language for knowledge graph development because of its balance between simplicity and powerful capabilities. Many of the tools required to construct, process, and analyze graph data are already available in the Python ecosystem, making it easy to move from raw data to a functioning knowledge graph.
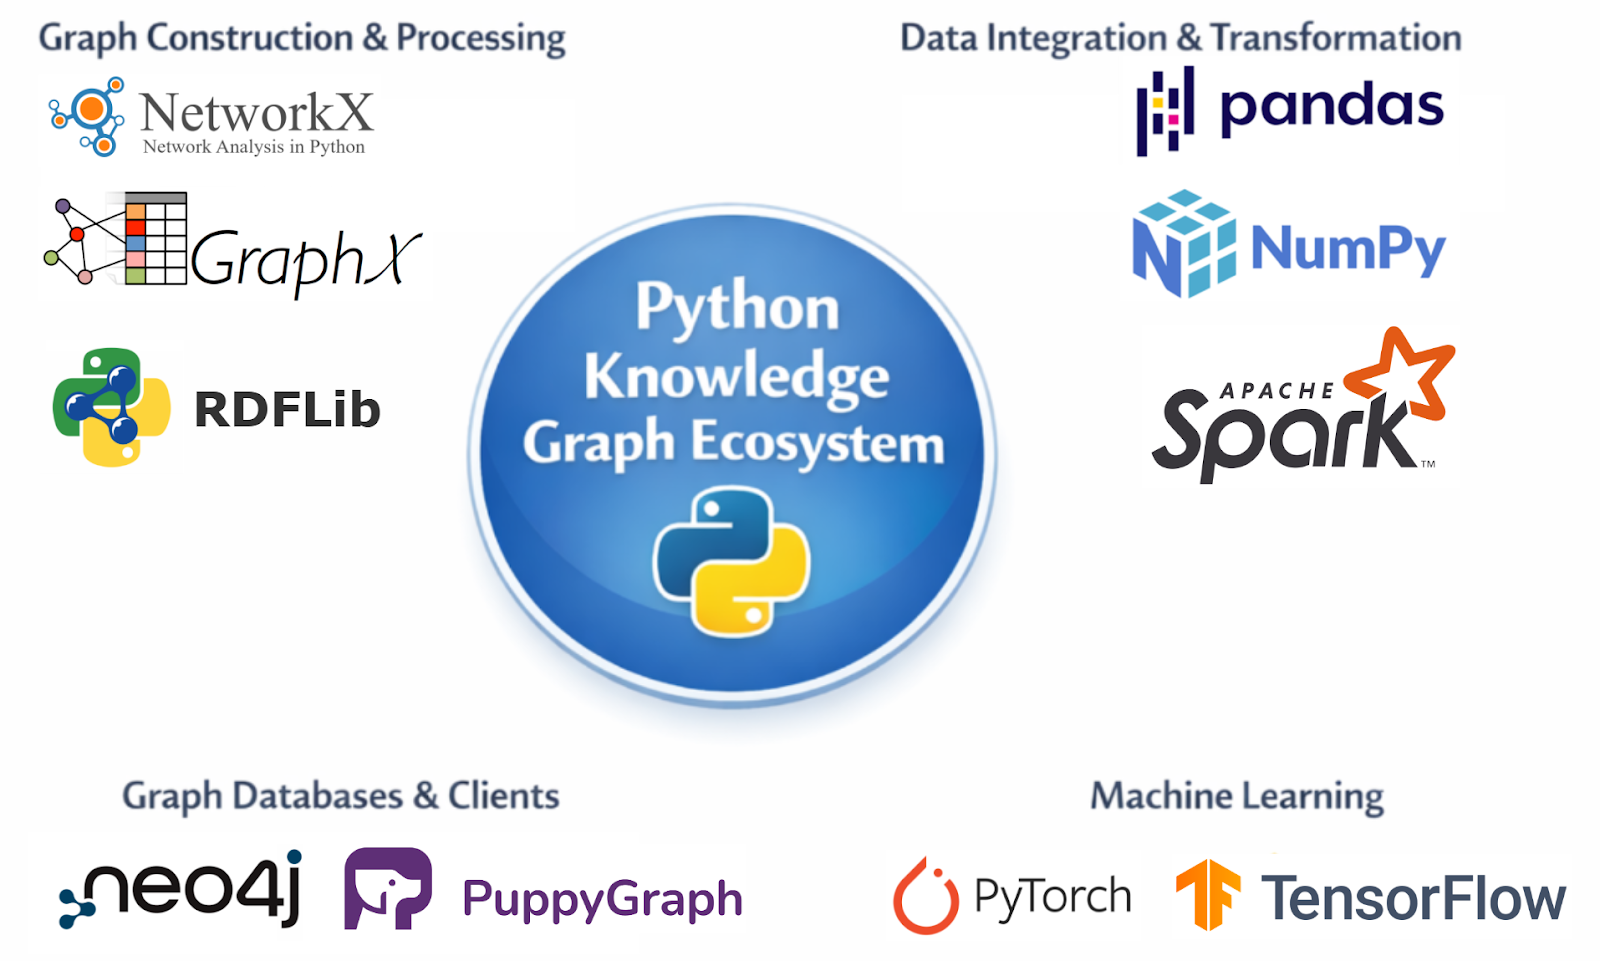
One of Python’s biggest strengths is its rich ecosystem of libraries and tools designed specifically for graph processing. Libraries such as NetworkX, RDFLib, and Apache Spark's GraphX allow developers to construct graph structures, manipulate triples, and perform large-scale graph computations. Additionally, Python supports drivers and clients for connecting to standard graph databases like Neo4j and graph engines like PuppyGraph, which simplifies database integration. This extensive ecosystem reduces much of the complexity involved in building graph-based systems and enables developers to focus on modeling and analysis rather than low-level implementation details.
Another reason Python is widely used is its strong capabilities for data integration and transformation. Building real-world knowledge graphs requires collecting, cleaning, and transforming data from diverse sources such as relational databases, APIs, spreadsheets, and text documents, essentially performing full ETL (Extract, Transform, Load) workflows. Python’s rich ecosystem, including libraries like pandas and NumPy for data manipulation and Apache Spark for large-scale distributed processing, makes it easier to clean, transform, and consolidate these heterogeneous sources. This process ensures that all relevant data can be structured and loaded into a centralized knowledge graph repository for analysis and querying.
Python also excels in graph visualization, which is essential for understanding complex relationships. Libraries like NetworkX and Matplotlib allow developers to create intuitive visual representations of nodes and edges, helping identify patterns, anomalies, and key entities in the data. Visualization not only aids in debugging and model validation but also facilitates communication of insights to non-technical stakeholders, making knowledge graphs more actionable and interpretable.
Python also integrates naturally with machine learning frameworks such as PyTorch and TensorFlow. This makes it possible to combine knowledge graphs with predictive models or graph embeddings. As a result, developers can build intelligent systems that not only store knowledge but also learn from it.
Python also serves as a powerful orchestration or “glue” language for knowledge graph systems. Beyond processing and integrating data, Python can coordinate complex workflows, manage interactions between multiple components, and handle large-scale data pipelines. This orchestration capability allows developers to manage complex, large-scale knowledge graphs efficiently, ensuring that data collection, transformation, and analysis work seamlessly together.
Core Concepts: Entities, Relationships, and Triples
Understanding the structure of a knowledge graph begins with a few fundamental components: entities, relationships, and how they are represented in a graph. These elements form the foundation of how knowledge is organized and queried.
Entities are the objects or concepts represented in the graph. They can be people, organizations, locations, products, or abstract ideas. In a knowledge graph about movies, for example, entities might include actors, films, and directors.
Relationships describe how entities are connected. A relationship might indicate that an actor starred in a film, a company owns a subsidiary, or a researcher authored a paper. These connections transform isolated data points into a meaningful network.
In property graphs, such as those adopted in PuppyGraph, entities are represented as nodes and relationships as edges. Both nodes and edges can have properties, key-value pairs that store additional information. For example, a node representing a film might have properties like title, releaseYear, and genre, while an edge representing an actor starring in the film might have a property role. This makes Property Graphs highly flexible for storing rich, structured data.
An alternative representation is the RDF (Resource Description Framework) triple model, which expresses knowledge in the form of triples:
- Subject: the entity being described
- Predicate: the type of relationship
- Object: the target entity or value
For example, the statement “Marie Curie discovered radium” can be represented as an RDF triple:
- Subject: Marie Curie
- Predicate: discovered
- Object: Radium
Graphically, triples form nodes connected by labeled edges. By combining many triples, an RDF graph captures complex relationships in a machine-readable format.
Both RDF and Property Graphs provide ways to model interconnected data, but they differ in focus:
- RDF emphasizes standardized triples suitable for semantic web and interoperability.
- Property Graphs emphasize flexibility and properties on nodes and edges, making it easier to model real-world entities and support complex queries efficiently.
By understanding these graph models, developers can choose the representation that best fits their knowledge graph use case, while queries can traverse nodes and edges to uncover patterns and insights beyond what traditional relational databases allow.
Popular Python Libraries for Knowledge Graphs
Python offers several libraries that simplify the process of creating and working with knowledge graphs. These libraries support different graph models, data formats, and storage systems, allowing developers to choose tools that fit their specific requirements.

One of the most widely used libraries for graph manipulation is NetworkX. It provides an intuitive interface for creating nodes, edges, and attributes within a graph. Although it is primarily designed for graph algorithms and network analysis rather than semantic knowledge graphs, it is often used for experimentation and visualization.

Another important library is RDFLib, which focuses on RDF-based knowledge graphs. RDFLib allows developers to create triples, parse RDF files, and execute SPARQL queries. Because RDF is a standard for semantic data, RDFLib is commonly used in academic research and semantic web projects.
For applications that rely on graph databases, developers often use the official Neo4j Python Driver to interact with Neo4j. The driver enables Python programs to connect to a running Neo4j instance, execute Cypher queries, and retrieve query results programmatically. By using the Bolt protocol, it provides a reliable and efficient way to integrate graph databases into Python-based workflows.
For large-scale graph processing tasks, distributed frameworks are often required. GraphX, a graph processing library built on top of Apache Spark, is designed for analyzing massive graphs across distributed computing clusters. GraphX provides APIs for graph-parallel computation and includes built-in algorithms such as PageRank and connected components. Although GraphX itself is implemented in Scala, Python users can access Spark-based graph analytics through the PySpark ecosystem, making it possible to integrate large-scale graph processing into Python data pipelines.
Finally, PuppyGraph can also be accessed from Python. Similar to Neo4j, PuppyGraph provides an official Python client that allows applications to connect to a running graph engine, execute queries, and retrieve results programmatically. In addition to the native client, developers can also interact with PuppyGraph using standard graph drivers such as the Neo4j Python Driver for Cypher queries or Gremlin drivers for Gremlin-based graph traversal.
Each of these tools serves a slightly different purpose, but together they form a powerful ecosystem for building and working with knowledge graphs in Python. In practice, developers often combine multiple libraries within a single workflow. For example, data might first be processed using pandas, converted into RDF triples with RDFLib, and then loaded into a graph database for querying and visualization.
Python provides a wide range of tools, libraries, and clients for working with knowledge graphs. From ETL and graph construction to querying, analytics, and visualization, developers can organize these components into a workflow that fits their specific needs. For example, data might first be processed using pandas, converted into RDF triples with RDFLib, and then loaded into a graph database for querying and visualization.
Building a Knowledge Graph in Python Step by Step
Creating a knowledge graph in Python typically involves several stages, including data preparation, entity extraction, relationship modeling, and graph construction. Although real-world graphs can become extremely large, the basic workflow can be demonstrated with a small example.
The first step is defining the entities and relationships that will appear in the graph. Suppose we want to create a small knowledge graph describing books and authors. The entities might include authors and books, while relationships describe which author wrote which book.
Next, we construct triples representing these relationships. In Python, this can be done using RDFLib.
from rdflib import Graph, URIRef


# Create RDF graph
g = Graph()

author = URIRef("http://example.org/author/JRR_Tolkien")
book = URIRef("http://example.org/book/Lord_of_the_Rings")
relation = URIRef("http://example.org/relation/wrote")

g.add((author, relation, book))

print("Triple count:", len(g))
This code creates a graph and adds a triple linking the author J.R.R. Tolkien to the book The Lord of the Rings. Each element in the triple is represented as a URI, which uniquely identifies entities within the graph.
Once the graph is created, developers can run queries to retrieve information. RDF graphs are commonly queried using SPARQL.
query = """
SELECT ?book
WHERE {
?author <http://example.org/relation/wrote> ?book .
}
"""

for row in g.query(query):
    print("Book:", row.book)

# The expected output is:
# Triple count: 1
# Book: http://example.org/book/Lord_of_the_Rings
SPARQL queries allow developers to search for patterns in triples. In larger graphs, these queries can identify complex relationships across thousands or millions of entities.
Another common step is visualizing the graph structure. Visualization tools help developers understand how entities connect and whether the data model accurately reflects the underlying knowledge.
For example, we can use the scripts below to visualize the constructed graph:
import networkx as nx
import matplotlib.pyplot as plt
import textwrap

# Label formatting function
def format_label(uri, width=12):
    label = uri.split("/")[-1].replace("_", " ")
    return "\n".join(textwrap.wrap(label, width))


# Convert RDF triples to NetworkX graph
G = nx.DiGraph()

for subj, pred, obj in g:
    G.add_node(subj, label=format_label(subj))
    G.add_node(obj, label=format_label(obj))
    G.add_edge(subj, obj, label=pred.split("/")[-1])


# Create figure
plt.figure(figsize=(8, 6))

# Manually set node positions (horizontal layout)
pos = {
    author: (0, 0),
    book: (3, 0)
}

# Draw nodes
nx.draw_networkx_nodes(
    G,
    pos,
    node_color="lightblue",
    node_size=2200
)

# Draw edges with visible arrow
nx.draw_networkx_edges(
    G,
    pos,
    arrowstyle="-|>",
    arrowsize=30,
    width=2,
    min_source_margin=15,
    min_target_margin=30
)

# Draw node labels
labels = {n: format_label(n) for n in G.nodes()}
nx.draw_networkx_labels(
    G,
    pos,
    labels,
    font_size=8
)

# Draw edge labels
edge_labels = {(u, v): d["label"] for u, v, d in G.edges(data=True)}
nx.draw_networkx_edge_labels(
    G,
    pos,
    edge_labels=edge_labels,
    font_color="red",
    font_size=10
)

plt.title("Book Knowledge Graph")
plt.axis("off")
plt.show()
The visualization result is as follows:
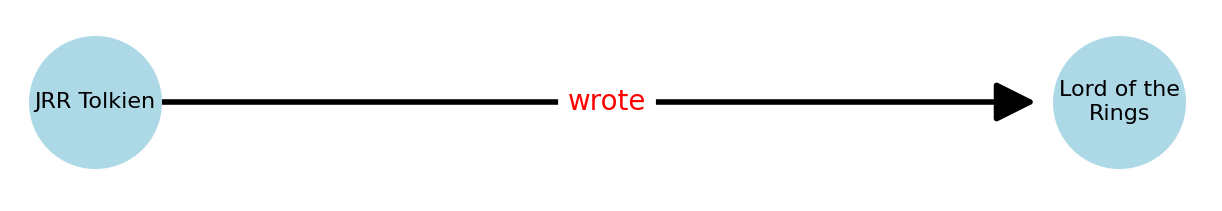
As the dataset grows, the graph becomes richer and more informative. Additional relationships such as publication dates, publishers, and adaptations can be added to expand the knowledge base.
In production systems, the graph is usually stored in a dedicated graph database. Python scripts are then used to ingest data, update relationships, and run analytics on top of the graph.
Conclusion
Knowledge graphs provide a powerful way to represent complex relationships between entities, enabling richer data analysis, semantic search, and intelligent applications. In this guide, we explored how Python supports knowledge graph development through its flexible programming model and extensive ecosystem. From defining entities and relationships to constructing RDF triples and visualizing graph structures, Python allows developers to build and experiment with knowledge graphs efficiently.
We also discussed key tools such as NetworkX, RDFLib, and distributed frameworks, as well as how modern graph engines like PuppyGraph can integrate with Python for scalable querying and analytics. By combining Python’s data processing capabilities with graph technologies, developers can transform raw data into interconnected knowledge networks that support deeper insights and advanced AI-driven applications.
Explore the forever-free PuppyGraph Developer Edition, or book a demo to see it in action.

Hao Wu is a Software Engineer with a strong foundation in computer science and algorithms. He earned his Bachelor’s degree in Computer Science from Fudan University and a Master’s degree from George Washington University, where he focused on graph databases.

Get started with PuppyGraph!


Developer Edition
- Forever free
- Single noded
- Designed for proving your ideas
- Available via Docker install
Enterprise Edition
- 30-day free trial with full features
- Everything in developer edition & enterprise features
- Designed for production
- Available via AWS AMI & Docker install