

What Is Relationship Analytics?
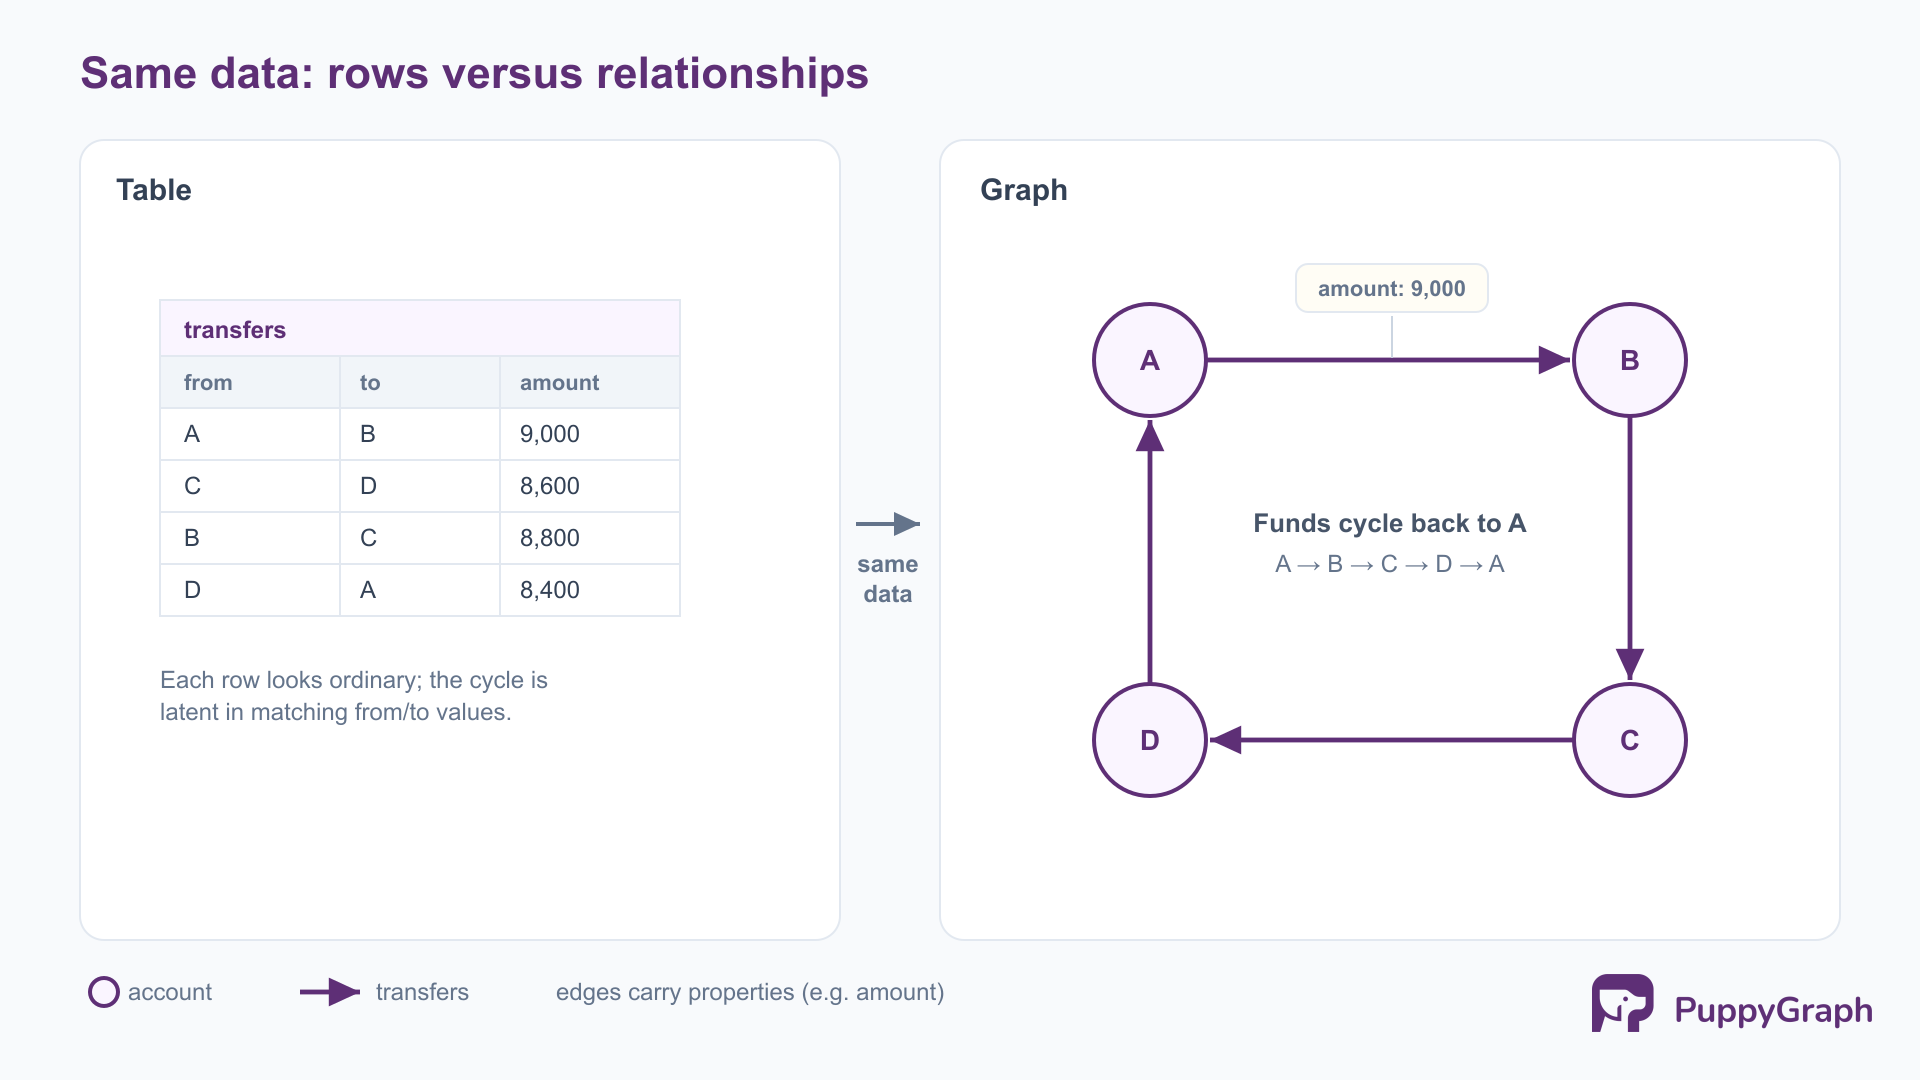
Most analytics summarizes records one at a time: it counts transactions, averages order values, and segments customers by their attributes. That work is essential, but it treats each entity as an island described by its own columns, rarely by its connections. Relationship analytics starts from the opposite premise, that the connections between entities are themselves the data worth analyzing. A single payment looks ordinary; the same payment seen as one edge in a ring of accounts that move money in a circle does not. The signal lives in the relationship, and a row-by-row view never sees it.
This post explains what relationship analytics is, how it differs from traditional analytics, and how organizations model and query it: the relationship types and data sources they hold, the graph-based approaches and techniques used to analyze them, the role of network analysis, and how AI is changing the practice.
What is relationship analytics?
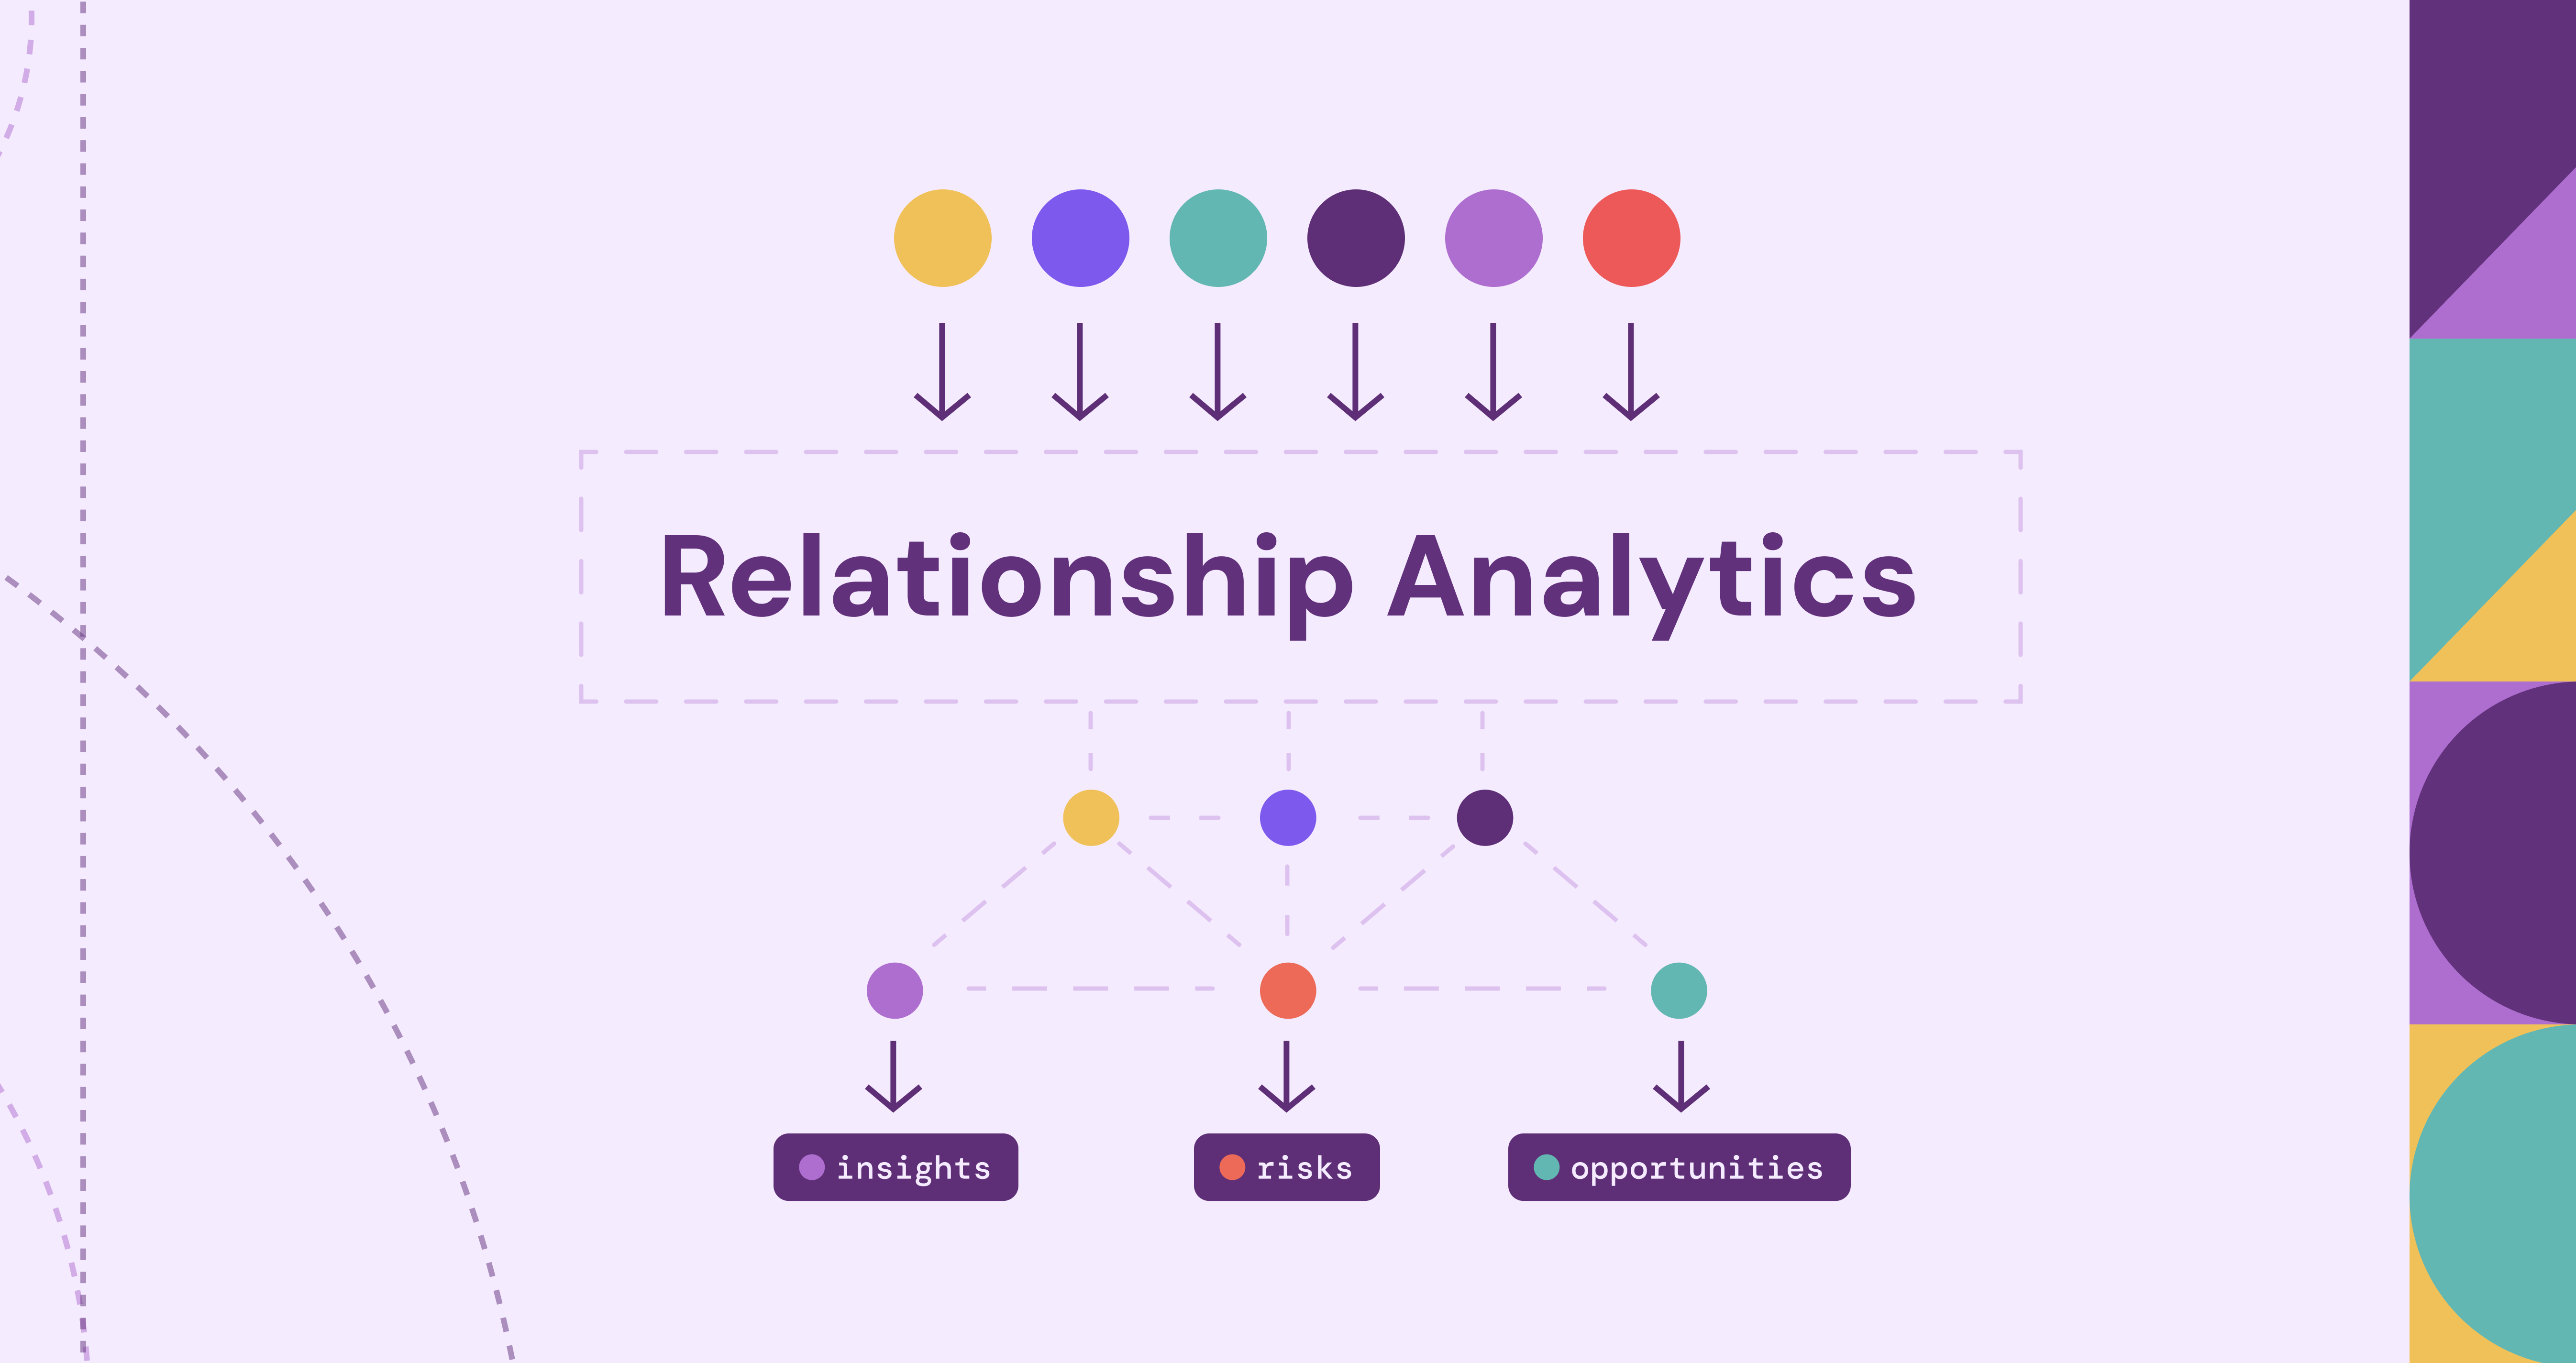
Relationship analytics is the practice of analyzing the connections between entities, people, accounts, devices, products, organizations, to find patterns, risks, and opportunities that attribute-level analysis misses. Where conventional analytics asks about the properties of records (how many, how much, what kind), relationship analytics asks how records relate: who is connected to whom, through what, how directly, and what those connections imply.
The discipline has a long lineage. Graph theory, the mathematics of nodes and the edges between them, dates to the eighteenth century; social network analysis formalized the study of relationships among people in the twentieth, giving us concepts like centrality and community; network science extended the same ideas to biology, infrastructure, and the web. Relationship analytics applies this body of work to the entities and connections an organization holds in its own data.
It is also distinct from a plain database join. A join combines two tables on a matching key and returns the rows it was asked for. Relationship analytics is concerned with the structure that emerges when many connections are followed: the chains, loops, clusters, and hubs that form when entities link to entities that link to others. The question is not just whether two records share a key, but what the shape of the surrounding network says about each entity in it.
Why relationship analytics matters
Relationships carry signal that individual records do not. An account looks clean on its own attributes; it becomes interesting when it shares a device, a payment instrument, and a shipping address with a dozen accounts opened minutes apart. Fraud rings, money-laundering structures, coordinated inauthentic behavior, and supply-chain concentration risk are all defined by their connection patterns, none of them visible in a per-record summary because none is a property of any single record.
The same holds for opportunity. Recommendation systems read the relationships between users and items; influence and reach are properties of position in a network, not of any actor’s attributes; customer-360 and entity-resolution efforts exist to assemble scattered relationships into one view. In each case the value comes from connecting things that were stored apart.
This is part of why graph approaches have drawn sustained analyst attention. Gartner predicted in 2021 that graph technologies would be used in 80% of data and analytics innovations by 2025, up from 10% in 2021. The figure is a forward-looking estimate rather than a measured outcome, but the direction is real: as data spreads across more systems, the questions that matter increasingly span those systems, and spanning-systems questions are relationship questions. The relationship, not the record, is becoming the asset.
Relationship analytics vs traditional analytics
Traditional analytics and relationship analytics answer different shapes of question. Traditional analytics aggregates and slices attributes, and it is unmatched for totals, trends, distributions, and segments. Relationship analytics traverses connections, and it is unmatched for questions about structure, reach, and indirect association. The contrast is clearest laid out by the dimensions an analyst actually cares about.
The row that does the most work is multi-hop. Asking which customers bought a product is one join. Asking which customers connect, through any chain of shared devices, addresses, or payment instruments, to a known-fraudulent account is a variable-length traversal, and in SQL that means a join per hop with the depth fixed in advance. The relationship view treats depth as a parameter of a single traversal. That difference is not cosmetic: it decides which questions are practical to ask, and a question too awkward to express is one that does not get asked. The point is not that one model is superior, but that the unit of analysis should match the question, and a growing class of valuable questions is about connections.
Types of relationships analyzed in modern organizations
Relationships in enterprise data fall into a few recurring kinds, and most organizations already hold all of them, spread across different systems.
Social and organizational relationships connect people to people: reporting lines, collaboration, communication, and membership, the substrate of org analytics and the social network analysis described below.
Transactional and financial relationships connect parties through payments, transfers, trades, and purchases, the center of fraud detection, anti-money-laundering, and customer-behavior analysis.
Ownership and dependency relationships connect things to what they rely on or control, a company and its subsidiaries, a service and its upstream dependencies, driving risk-propagation analysis of what else fails when one node does.
Identity and access relationships connect principals to the resources they can reach, users to roles to permissions to systems, the substrate of access reviews where the real question is reachability across several hops.
Similarity and affinity relationships connect entities that resemble or co-occur, similar customers, co-purchased products, related documents, behind recommendation and segmentation.
Temporal and sequential relationships connect events in order, a path through a funnel or an incident timeline, where order and timing change meaning.
What these share is that the relationship is usually implicit: it is not stored as a relationship but derived by connecting records that live in separate places, which makes the data-source and modeling questions the practical heart of the discipline.
Data sources for relationship analytics
Relationship analytics rarely has a single source that already contains the connections. They are latent in operational systems each built around a different entity, and assembling them is most of the work.
The contributors are familiar systems seen from a connection-first angle: CRM and customer systems (accounts and contacts), transaction and payment systems (flows of value), application and security logs (which principal touched which resource), identity providers and directories (users, groups, roles, entitlements), communication and collaboration metadata (who interacted with whom, not the content), product, asset, and supply-chain systems (dependency and ownership links), IoT and telemetry (device interactions), and external and third-party data (registries, sanctions lists, enrichment).
The recurring difficulty is that the same real-world entity appears across these systems under different keys, and the most important relationships cross system boundaries: a customer in the CRM, a payer in the transaction system, and a user in the identity provider may be one person, and the fraud or access risk only appears once those three are recognized as connected. Relationship analytics is therefore bounded less by any single source than by how well entities can be resolved and joined across all of them.
Relationship modeling and entity mapping
Turning scattered records into something queryable as a network takes two steps: resolving entities, then modeling them and their connections explicitly.
Entity resolution comes first. The same person, company, or device appears across sources with different identifiers and formats, and analytics on unresolved data produces either phantom distinctions (one entity treated as several) or false merges (several treated as one). Both corrupt the network: a fraud ring disappears if its shared device is recorded three ways, and a clean customer is wrongly implicated if two people are collapsed into one. Resolution ranges from deterministic matching on strong keys to probabilistic and machine-learning approaches that score whether two records refer to the same entity.
Modeling comes second, usually onto the property-graph model: entities become nodes, relationships become edges, and the attributes of each become properties. A payment, for instance, is an edge between two account nodes with properties like amount and timestamp. Edges are typed and directed, so the model distinguishes a payment from a login from an ownership link and follows each in the right direction. A relationship becomes a first-class object you can attach data to and traverse, rather than a key match recomputed on every query.
Holding the model together over time takes a schema, and at the disciplined end an ontology: an agreed definition of which entity types exist, which relationships are allowed between them, and what properties each carries. It keeps the graph consistent as new sources are added and gives analysts and downstream tools a shared vocabulary for what the connections mean.
Graph-based approaches to relationship analytics
Once data is modeled as entities and relationships, a graph is the natural representation, because a graph makes relationships first-class. In a relational layout a connection between two rows is implied by a shared key and reconstructed with a join each time; in a graph it is stored directly as an edge, so following it is a traversal, not a recomputation. This is why multi-hop questions that grow awkward in SQL are expressed naturally as graph traversals where depth is just a parameter. The model fits because the thing being analyzed, the connection, is the thing it represents.
Query languages reflect this. openCypher and Gremlin let an analyst describe a shape to find, a cycle of payments, a chain of permissions reaching a sensitive system, rather than the mechanics of joining tables.
There is a real architectural choice in how the graph is provided. A graph database stores the graph in its own format, which means loading and synchronizing a separate copy of data that usually originates in a warehouse or lake, delivering graph-native storage at the cost of an ETL pipeline and the drift that comes with a second system of record. A graph query engine instead leaves the data in place and presents a graph view over existing tables, computing traversals without first copying the data into a graph store.
A graph approach that fits the second path is PuppyGraph. It is a graph query engine that maps existing tables in a warehouse, lakehouse, or open table format such as Apache Iceberg to nodes and edges through a user-defined schema, then runs openCypher and Gremlin queries over them in place, with no ETL into a separate graph database. It is a query engine, not a translation front-end: rather than rewriting a graph query into one large SQL statement and pushing it down, it compiles the traversal into graph operators and executes them in its own distributed engine, reading only simple projections and filters from the tables. Because compute is separated from storage, the tables stay in the warehouse and PuppyGraph supplies the graph computation on top. It is not a BI tool or a data warehouse and keeps no second copy of the data; it is the graph layer that lets analysts traverse the entities and relationships already present in their tables. It is used for relationship and graph workloads at companies including Coinbase, Dawn Capital, and Prevalent AI.
Relationship analytics techniques and methods
Graph representation is the substrate; the analysis runs from describing the network as it is to predicting connections not yet present.
Pattern matching and rule-based detection is the most direct: an analyst describes a structure of interest, accounts that transact in a closed loop, a new-device login followed by access to sensitive data, and the engine finds every instance. It is transparent and explainable, which anchors fraud and security use cases, and limited to patterns someone thought to specify.
Pathfinding answers questions about routes: the shortest path between two entities, whether one is reachable from another, which paths exist within a number of hops. Reachability is the core question behind access analysis and dependency tracing.
Similarity and link prediction move from what is connected to what is likely connected, scoring how alike two entities are by their neighborhoods and estimating which edges are missing or likely to form, powering recommendation, deduplication, and the surfacing of implied relationships.
Community detection finds groups more densely connected internally than to the rest of the graph, and centrality measures an entity’s importance by its position. Both are detailed in the network-analysis section below.
Graph embeddings and graph neural networks sit at the predictive end, encoding each node’s connection structure into a numeric vector that general machine-learning models can consume, so relationship context becomes a feature for classification and prediction.
These methods are complementary: a mature practice combines rules for known patterns, pathfinding and community detection to explore structure, and prediction to anticipate connections.
Network analysis in relationship analytics
Network analysis is the lens relationship analytics inherits most directly from social network analysis, supplying the measures that turn a graph into findings by quantifying the structure of the network and the position of entities within it.
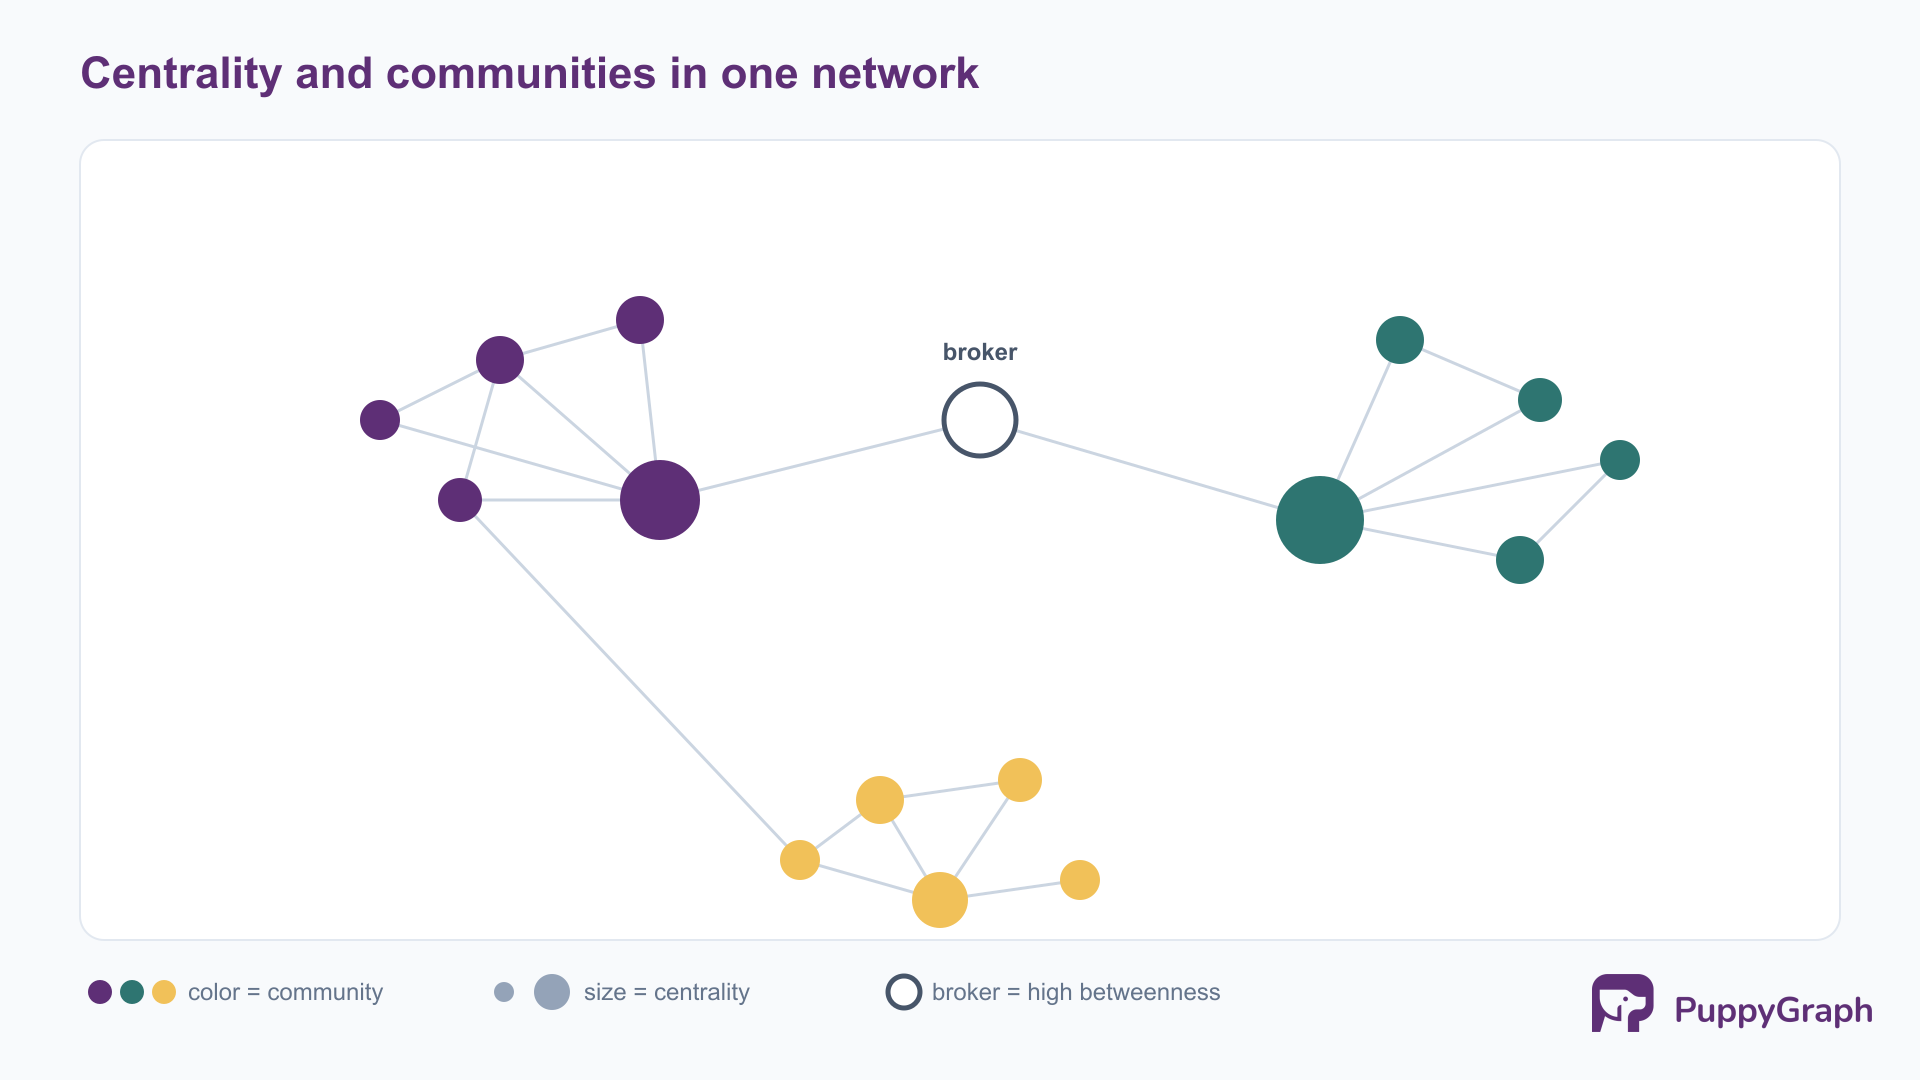
Centrality measures how important a node is by its position, and the right measure depends on what importance means. Degree centrality counts a node’s direct connections. Betweenness centrality measures how often a node lies on the shortest paths between others, surfacing brokers and bottlenecks whose removal would fragment the network. Closeness centrality captures how quickly a node can reach all others. Eigenvector centrality, and its well-known variant PageRank, weights a node’s importance by the importance of its neighbors, so connection to influential nodes counts for more than raw connection count. Using the wrong one produces a confident but misleading ranking.
Community detection partitions the network into groups that are internally dense and externally sparse. Algorithms such as Louvain and label propagation find these groups without being told in advance how many to expect, which is what makes them useful for discovery: a fraud ring or a customer segment emerges from the connection structure rather than from a predefined label.
Connected components identify the disjoint, mutually reachable pieces of a graph, often the first step in isolating a subgraph for closer analysis. Above the node level, network-level measures such as density (how many of the possible connections actually exist) and diameter (the longest shortest path across the network) describe the network as a whole.
The value of network analysis is that it converts a vague intuition that connections matter into specific, computable quantities, which feed back into the techniques above: ranking what to investigate, segmenting whom to target, and isolating which part of the network a question concerns.
How AI enhances relationship analytics
AI strengthens relationship analytics at several stages, and the relationship is increasingly two-way: AI improves the analysis, and a well-modeled relationship graph improves AI.
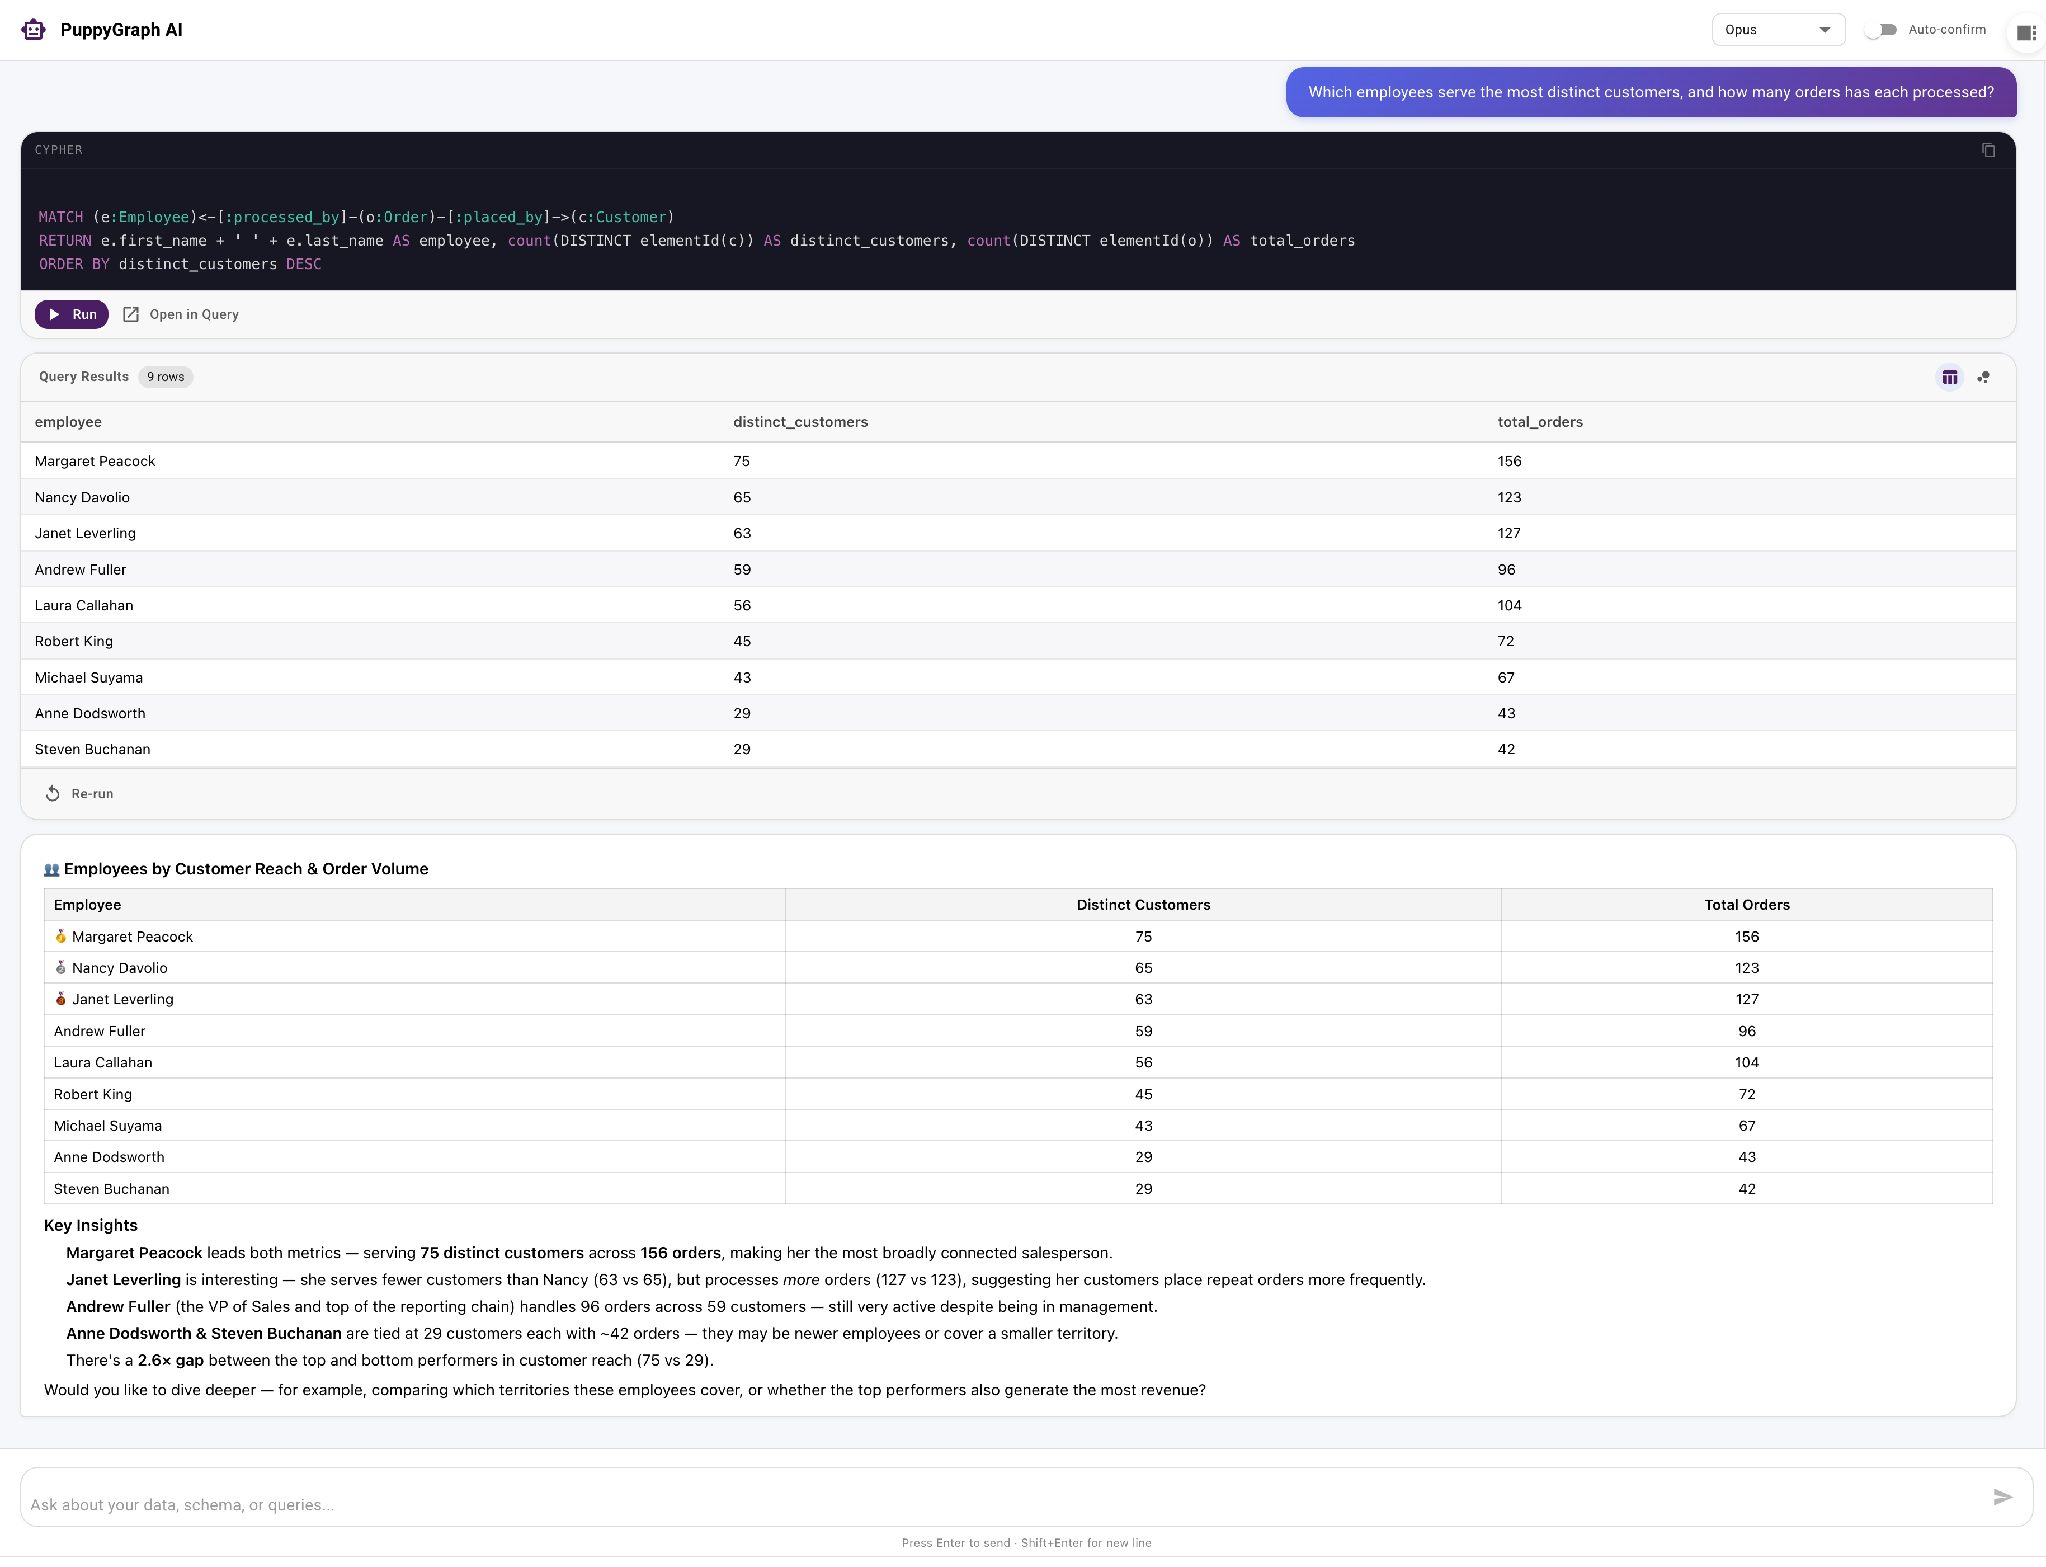
On the analysis side, machine learning sharpens entity resolution, scoring whether two records refer to the same entity far more accurately than rules alone and improving every relationship built on top. Graph neural networks and embeddings bring the predictive methods to scale, learning from connection structure to classify nodes, predict missing links, and flag anomalies no hand-written rule anticipated. And large language models lower the barrier to asking relationship questions, translating plain language into a graph query so an analyst who does not know the query language or schema can still interrogate the network.
The reverse direction is moving fastest. An AI agent reasoning over enterprise data is only as reliable as its model of what the entities are and how they relate; without one it guesses at structure and produces answers that are fluent but wrong. A relationship graph with an explicit schema, an ontology, gives the agent a grounded semantic model: which entities exist, which relationships are valid between them, and what each means. Querying against that model keeps the agent aligned with the real structure of the data, turning the relationship graph into the substrate it reasons over rather than a static report it reads. This is the framing in which a graph layer like PuppyGraph functions as an ontology between underlying data sources and AI agents, exposing the modeled entities and relationships as the contract an agent queries against. Because that contract is enforced when a query runs, a reference to an entity or relationship that does not exist comes back as structured feedback the agent can read and correct, so the agent can revise an invalid query and chain related ones to build up an answer. That makes the interaction a self-correcting loop rather than a one-shot translation of a question into a query. As more analysis is delegated to agents, a well-modeled relationship graph becomes the grounding that makes automated reasoning over connected data dependable.
Conclusion
Relationship analytics reframes the unit of analysis from the record to the connection, and a large and growing class of valuable questions, about fraud rings, influence, reachability, dependency, and recommendation, turns out to be about connections rather than attributes. Making them answerable is a chain of deliberate work: resolving entities across sources, modeling them and their relationships explicitly, choosing a graph representation that makes traversal natural, and applying the right technique to the question. Done well, the relationships an organization already holds, latent and scattered across its systems, become a queryable asset, and increasingly the grounding that automated reasoning over that data depends on.
Try the forever-free PuppyGraph Developer Edition and book a demo with the team to see how openCypher and Gremlin queries run over warehouse and lakehouse tables, with no graph-specific ETL, turning the relationships already implicit in those tables into a queryable graph.

Sa Wang is a Software Engineer with exceptional mathematical ability and strong coding skills. He holds a Bachelor's degree in Computer Science and a Master's degree in Philosophy from Fudan University, where he specialized in Mathematical Logic.

Get started with PuppyGraph!


Developer Edition
- Forever free
- Single noded
- Designed for proving your ideas
- Available via Docker install
Enterprise Edition
- 30-day free trial with full features
- Everything in developer edition & enterprise features
- Designed for production
- Available via AWS AMI & Docker install