

Top 7 Root Cause Analysis Tools
Root cause analysis (RCA) has strong roots in manufacturing, where quality teams needed repeatable ways to explain defects and stop them from happening again. Many of the early RCA practices were designed to improve efficiency and quality control on the production line, and later became standard problem-solving habits across industries.
Today, RCA shows up far beyond factory floors. In cybersecurity, RCA often focuses on identifying the entry point, meaning the initial weakness or exposure that attackers used to get in. In IT and observability, RCA helps teams explain why a service degraded or went down by connecting timelines with system signals like logs, metrics, traces, and recent changes. Beyond technical failures, RCA can reveal process gaps such as broken handoffs, missing training, or unclear escalation criteria, issues that quietly reduce efficiency and degrade customer experience.
In this blog, we’ll cover the main RCA tools and methodologies teams use, plus the software products that help organize evidence, align stakeholders, and track corrective actions. We’ll also look at the growing push toward automated, data-driven RCA, and where graph-based approaches like PuppyGraph fit when getting to the real cause depends on tracing relationships and paths across connected data.
What is Root Cause Analysis?
Root cause analysis (RCA) is a structured problem-solving process for figuring out why an incident or failure happened, then turning that insight into changes that prevent it from happening again. Instead of stopping at the most visible symptom, RCA pushes teams to validate causes with evidence, separate contributing factors from the primary driver, and leave behind a clear plan for corrective and preventive action.
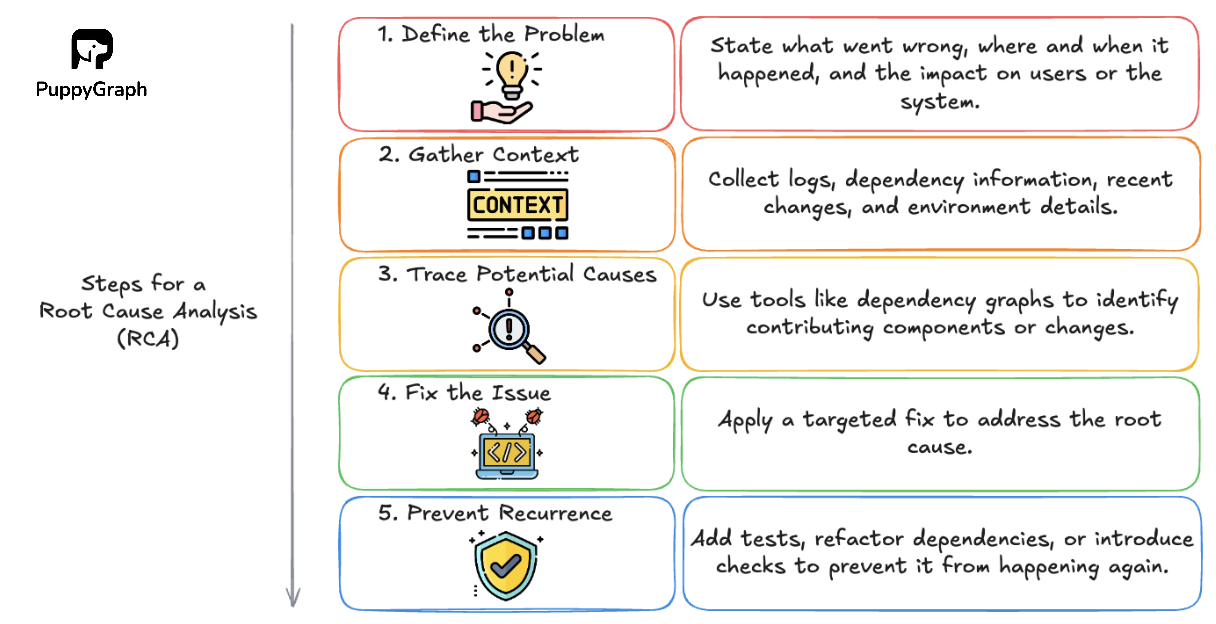
A practical RCA workflow usually looks like this:
1. Define the Problem
Write a clear problem statement, scope the impact, and align on what “fixed” means. The goals for RCA can include reduced recurrence of failure, improved quality, and faster resolution.
2. Gather Context
Collect the evidence: timelines, logs, metrics and traces, tickets, interviews, documentation, change history, defect reports, or customer feedback. Then analyze for patterns and inconsistencies.
3. Trace Potential Causes
Identify the underlying conditions that made the issue possible, not just the triggering event. Call out contributing factors separately so you don’t oversimplify. Dependency graphs can help connect components and changes.
4. Fix the Issue
Propose fixes that address both the immediate cause (corrective) and the conditions that allowed it (preventive). Apply the targeted fix to address the root cause.
5. Prevent Recurrence
Validate the outcome using the right signals (recurrence rate, defect rate, incident volume, customer satisfaction, SLOs). If the problem persists, loop back with new evidence.
Importance of RCA in Problem-Solving
Hot fixes restore things quickly, but they rarely stop the same failure from coming back. Here’s how RCA helps improve the way teams respond over time.
Prevent Repeat Incidents
Most teams can restore service or contain the damage. RCA improves what happens next. After the immediate fix, it helps you capture the cause with evidence and turn it into changes that reduce the chance of a repeat.
In practice, that follow-through looks different depending on the problem:
- Cybersecurity: Trace the entry point and the control gaps that allowed the breach to unfold, not just the compromised host.
- IT Operations: Identify the failure mode behind the outage and add guardrails that prevent it under load, deploys, and traffic spikes.
- Customer Service: Identify the upstream process gap behind repeat tickets and close it, such as unclear policies, weak handoffs, or missing guidance.
Repeat incidents are rarely identical. They often stem from the same weak spots, like brittle dependencies, missing validation, noisy alerts, overly broad permissions, or handoff gaps where context gets lost. RCA helps teams address those underlying conditions instead of repeatedly treating symptoms.
Faster Time to Resolution
RCA speeds up future problem-solving by turning each incident into reusable reference material. Instead of relying on memory or starting over, teams can look back at past cases to see the symptoms, the evidence that confirmed the cause, and which remediations actually held.
That history narrows the search quickly. It highlights what to check first, which patterns tend to repeat, and what fixes worked last time. The result is faster resolution and less time spent re-investigating the same failures.
Better Prioritization of Fixes
When a problem shows up, it’s tempting to apply the fastest workaround and move on. RCA helps teams prioritize fixes that reduce the chance of recurrence, not just fixes that address the most visible symptom. By documenting what actually caused the issue and how it created impact, RCA makes it easier to decide what to fix first.
Instead of trying to address everything at once, teams can choose the most effective intervention, such as improving a process step, tightening a control, changing a dependency, adding validation, or updating training and documentation.
Knowledge Capture and Onboarding
RCA helps teams uncover systemic weaknesses that surface-level fixes often miss, then preserves those insights so they are not lost after the incident fades from memory. Instead of only documenting what was done to recover, an RCA records what actually led to the problem and what changes reduced the risk going forward.
It also turns know-how that lives in people’s heads into something others can reuse. By capturing timelines, causal factors, and the rationale behind corrective and preventive actions, RCAs convert implicit experience into clear documentation. That makes it easier for new team members to ramp up, improves handoffs across teams, and helps organizations make consistent decisions even as people and systems change.
Top 7 Root Cause Analysis Tools & Techniques
RCA tools tend to fall into two broad camps:
- Knowledge-driven: Structured human reasoning to map cause and effect, guided by domain expertise and validated with evidence.
- Data-driven: Uses operational data (telemetry, logs, tickets, change history) to surface patterns and likely causes at scale, often with automation.
In practice, RCA is moving toward a hybrid approach: teams use structured reasoning to map possible causes, then use data to validate which paths actually happened.
5 Whys
The 5 Whys is a simple questioning method for moving past surface symptoms to uncover an underlying cause. You probably use a version of it in daily life, just without drawing it out. Start with a clear problem statement, then ask “why did this happen?” Each answer becomes the next “why” until you reach a cause that is actionable and supported by evidence.
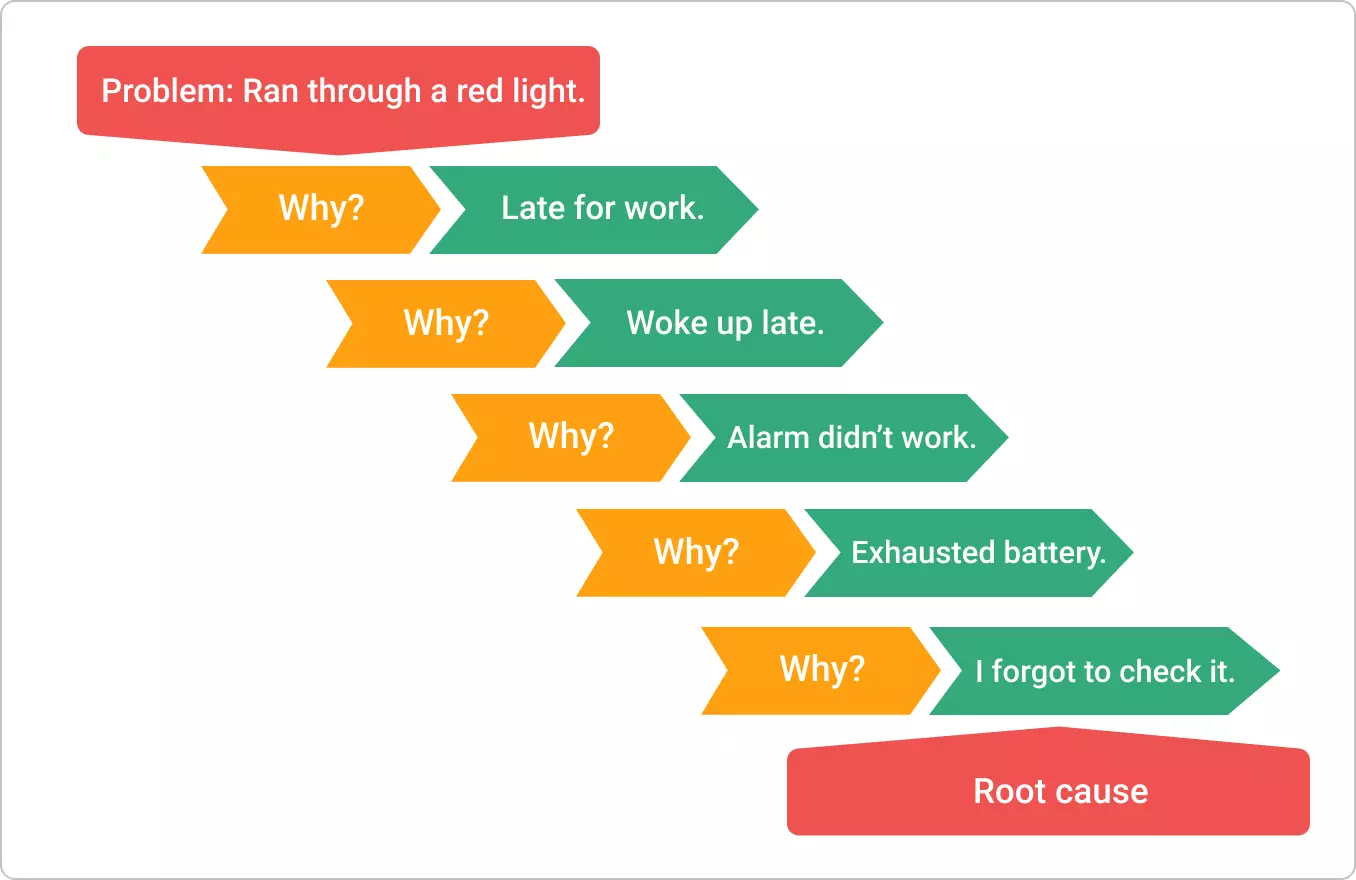
The “5” in the 5 Whys isn’t a strict number you have to hit. It’s a rule of thumb: in many cases, asking “why?” about five times is enough to move past the symptoms and reach an underlying cause you can actually address.
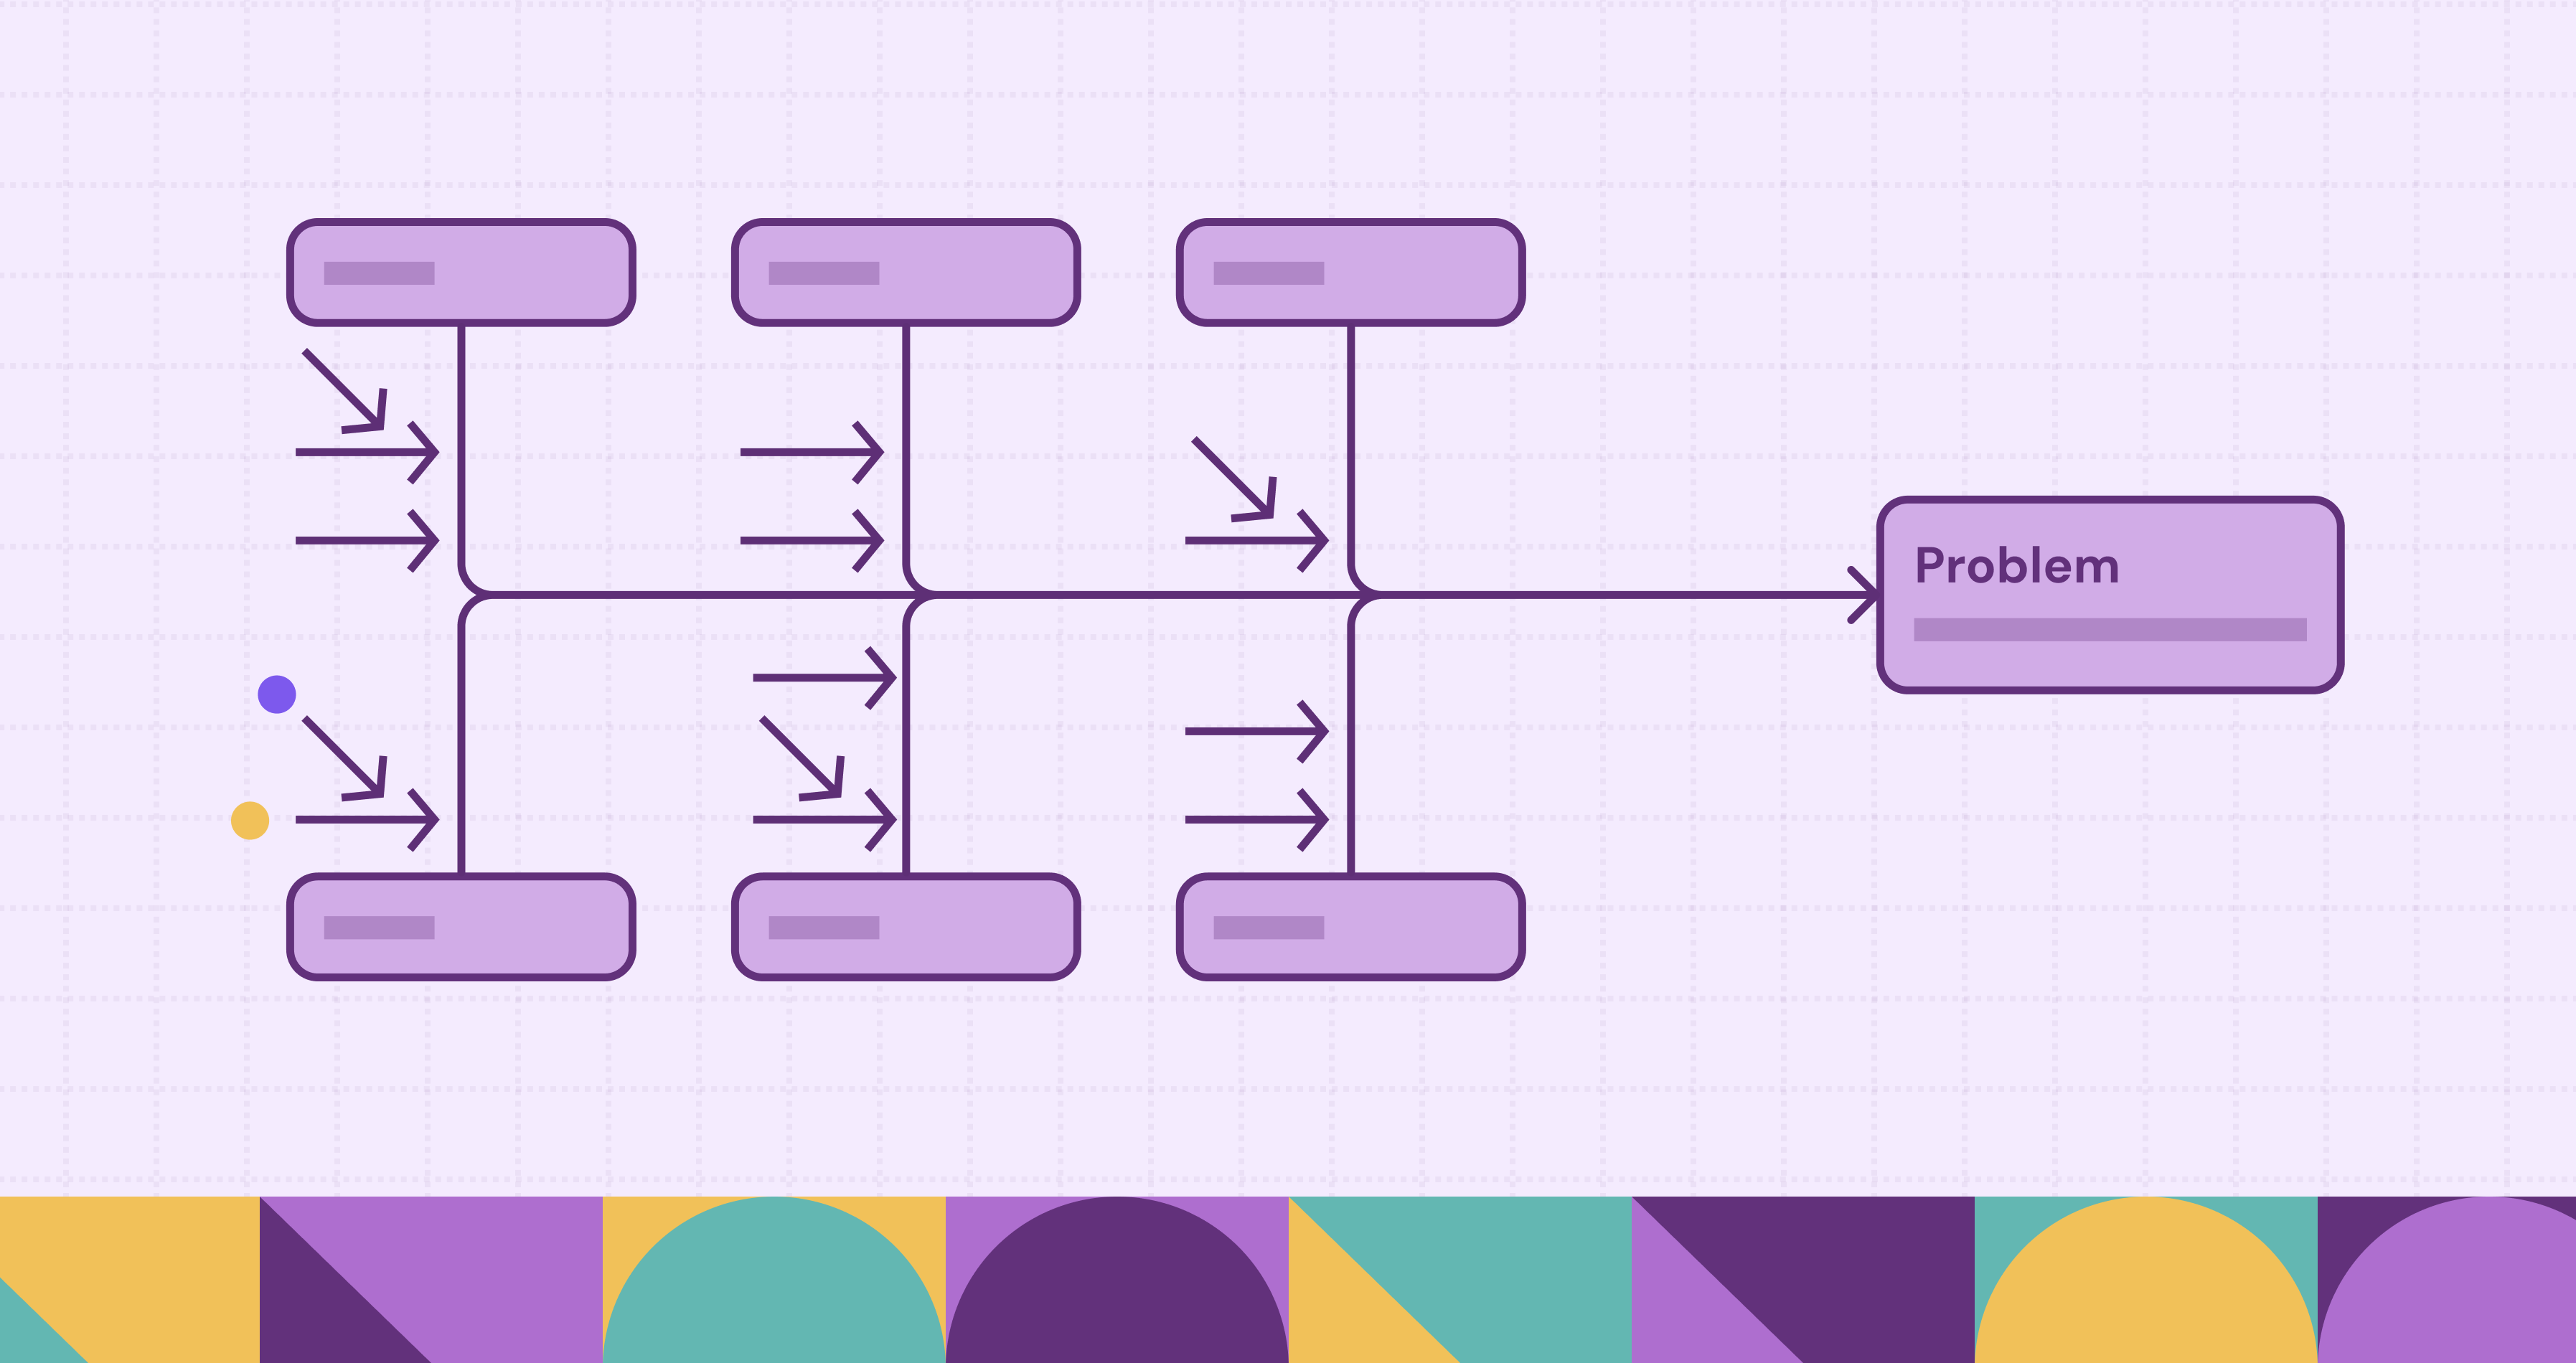
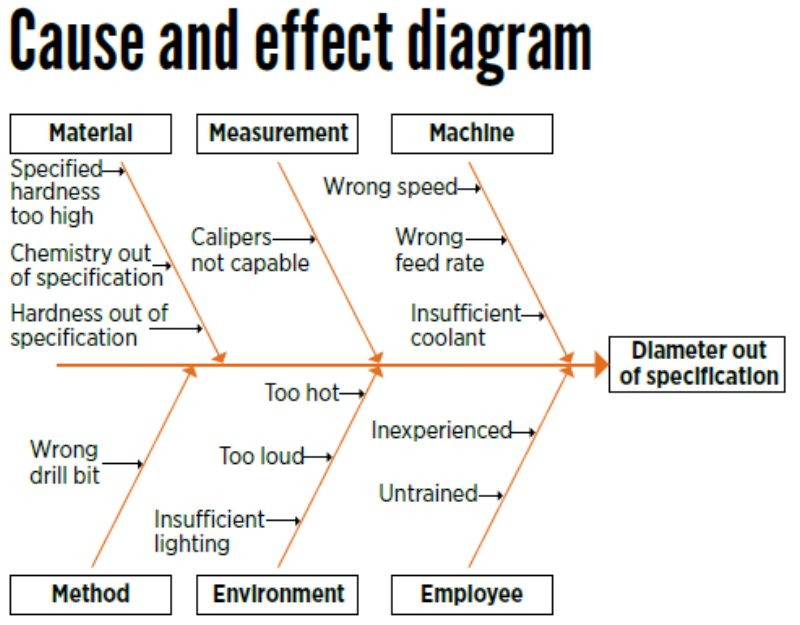
Fishbone (Ishikawa) Diagram
The Fishbone (Ishikawa) diagram, also called a cause-and-effect diagram, helps you organize possible causes before you settle on a root cause. You place the problem at the “head” of the fish, then draw branches for major cause categories such as Material, Measurement, Machine, Method, Environment, and People. Under each branch, you list the specific factors that might contribute, along with any observations you have so far. This structure makes it easier to scan for clusters, compare hypotheses across categories, and see what evidence you still need to confirm the real cause.
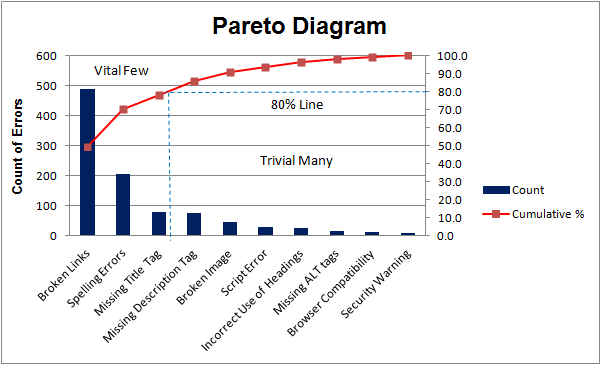
Pareto Analysis
Pareto analysis is a prioritization method based on the Pareto Principle (80/20 Rule): roughly 80% of outcomes come from 20% of causes. Teams start by grouping incidents, defects, or complaints into categories, then ranking them by frequency or impact to reveal which few causes drive most of the headaches. This is often visualized with a Pareto chart, where bars show each category and a cumulative line shows how quickly the impact adds up. The goal is to focus investigation and remediation on the highest-leverage causes first, rather than spreading effort evenly across everything.
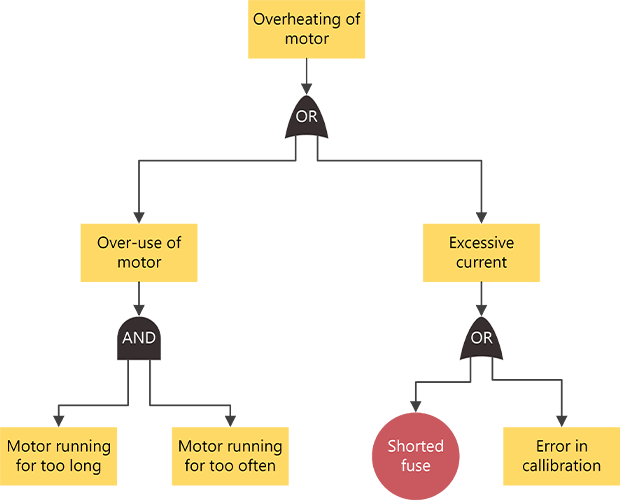
Fault Tree Analysis (FTA)
Fault tree analysis (FTA) models how failures combine to produce an unwanted outcome. You start with the top-level event and work backward, using AND/OR logic to map the conditions that could lead to it. The result is a clear causal structure that teams can test against evidence, measure, and refine over time. FTA is especially useful when the stakes are high and you need a rigorous, auditable explanation of what happened. In modern practice, it’s often hybrid: experts define the tree, then data is used to validate branches and quantify which combinations actually drive the failure.
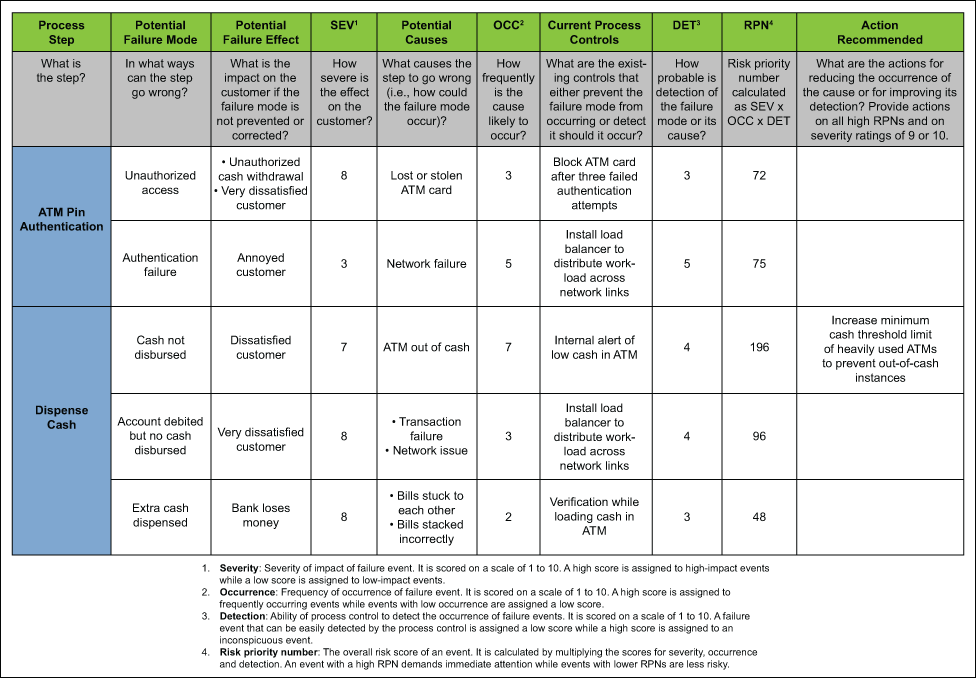
Failure Mode and Effects Analysis (FMEA)
Failure Mode and Effects Analysis (FMEA) is a preventive approach that asks “how could this fail?” before the failure happens:
- Failure: What goes wrong (a defect, breakdown, or missed requirement)
- Mode: The specific way it fails (the failure pattern)
- Effects: The impact it creates, including downstream consequences
- Analysis: The structured evaluation used to prioritize mitigations
Teams list potential failure modes in a product, process, or system, document their effects and likely causes, then assess risk, often by considering severity, likelihood, and detectability. The result is a prioritized set of actions to reduce the most important risks before they show up in production or in the field.
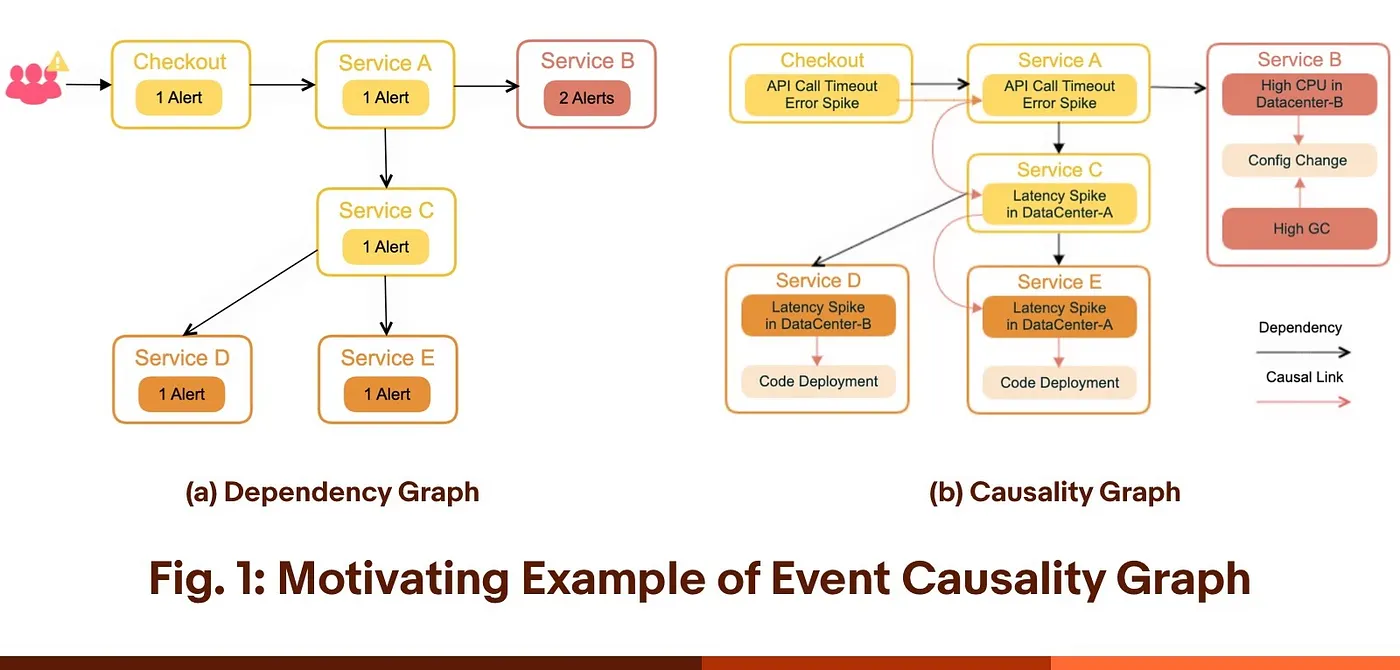
Graph-based RCA
Graph-based RCA models the problem space as a network of connected entities, then uses those relationships to investigate what led to an outcome. You build a graph that links relevant signals across your data, from operational telemetry and tickets to emails, knowledge base articles, and customer feedback. With those connections in place, you can ask questions like “what changed upstream?”, “what path connects these events?”, or “what else is affected?” and quickly pull the most relevant surrounding context.
Because the data is relationship-first, you can also match common failure patterns and narrow the investigation to a focused “subgraph” around the issue. That makes it easier to identify the most likely contributing components, processes, or actors, without needing to manually stitch context together across disconnected tools.
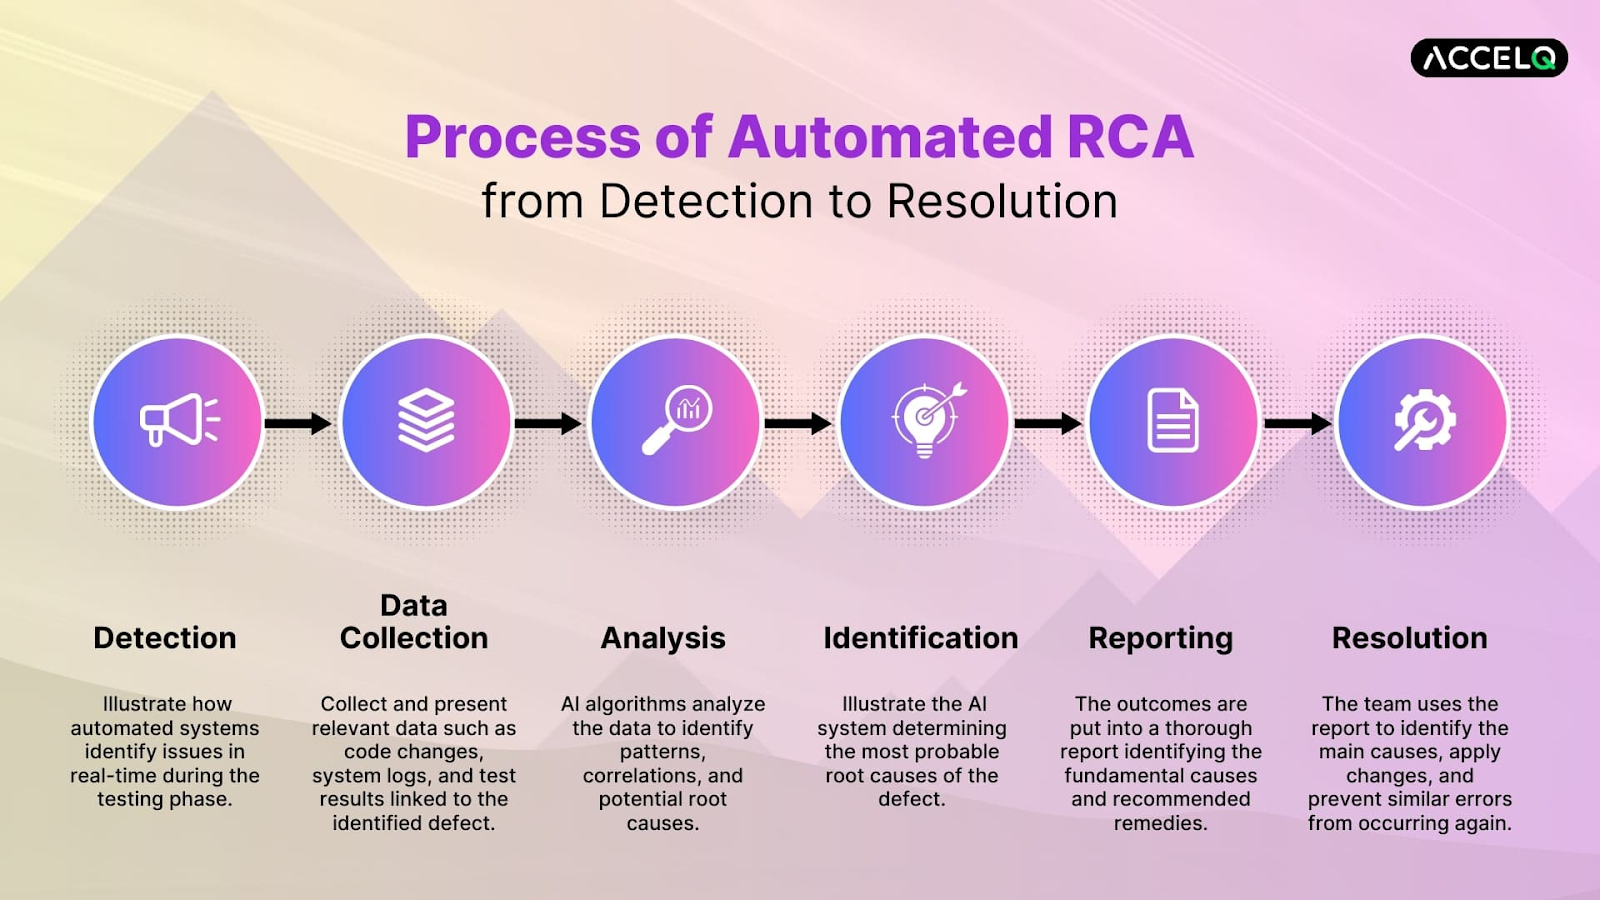
AI-powered RCA
AI-powered RCA is a newer form of automated RCA that spans everything from simple assistants to tool-using systems. Most tooling today falls into a few common patterns:
- Assistive: Summarizes incident notes, tickets, chats, and postmortems, and drafts timelines and RCA reports.
- Data-driven Analytics: Uses correlation, anomaly detection, and topology inference to surface likely causes from telemetry and events.
- Semi-agentic: Recommends a step-by-step investigation plan and can run a limited set of predefined checks or playbooks.
- Agentic: Gathers evidence across systems, runs queries, refines hypotheses, and produces a ranked causal chain.
In practice, automated RCA often combines these patterns, with the goal of speeding up the parts of RCA that are usually slow and manual. Many commercial tools focus on correlating signals across your stack, pulling in change and ticket context, and suggesting the next best checks so triage moves faster. Some also extend into prevention by learning recurring patterns and flagging risky changes early, often presenting the results as a concise “incident story” with a likely cause and supporting evidence. For complex environments, graph-based context can further ground these suggestions in real dependency and interaction data.
How to Choose the Right RCA Tool
These tools each have their own strengths, and they aren’t mutually exclusive. Teams often combine them: one to frame the problem, one to narrow focus, and one to validate the cause with evidence. The right mix depends on complexity, the data you have available, and how repeatable you need the process to be.
A Quick Way to Choose
- Need something fast and lightweight → 5 Whys or Fishbone
- Dealing with lots of repeats → Pareto Analysis
- Complex system or high stakes → FTA, Graph-based RCA, or AI-powered RCA
What Each Tool is Best For
- 5 Whys: fast, straightforward issues with a clear symptom
- Fishbone (Ishikawa): many plausible causes, cross-team brainstorming
- Pareto Analysis: recurring issues, prioritization
- FTA: high-stakes problems that need a defensible causal model
- FMEA: prevention work before rollout or process changes
- Graph-based RCA: complex environments where causes span dependencies
- AI-powered RCA: lots of signals and scattered context that make manual investigation slow
Comparison of the Top 7 RCA Tools
Root Cause Analysis Software
As organizations grow, RCA gets harder to run consistently. More systems, more teams, and more handoffs means the root cause often spans multiple owners and tools. Software helps RCA scale by making investigations easier to share, keeping evidence and decisions in one place, and turning outcomes into trackable follow-up work. In this section, we’ll take a brief look at the kinds of software that helps make RCA possible at scale, comparing their features.
Whiteboarding & Spreadsheets
Whiteboarding and spreadsheets are lightweight tools for running RCA sessions and capturing outcomes. They’re often used to document 5 Whys or fishbone diagrams, and to track incidents and action items without a formal system. Here are some popular software used by companies:
Dedicated RCA Tools
Dedicated RCA tools are purpose-built platforms that standardize how RCAs are run, documented, and reviewed. They lean heavily knowledge-driven, with built-in methods like 5 Whys and cause-and-effect diagrams, structured questions and root-cause guidance, plus evidence capture and action tracking so investigations stay consistent and auditable across teams. While non-exhaustive, here are some of the top dedicated RCA tools available on the market:
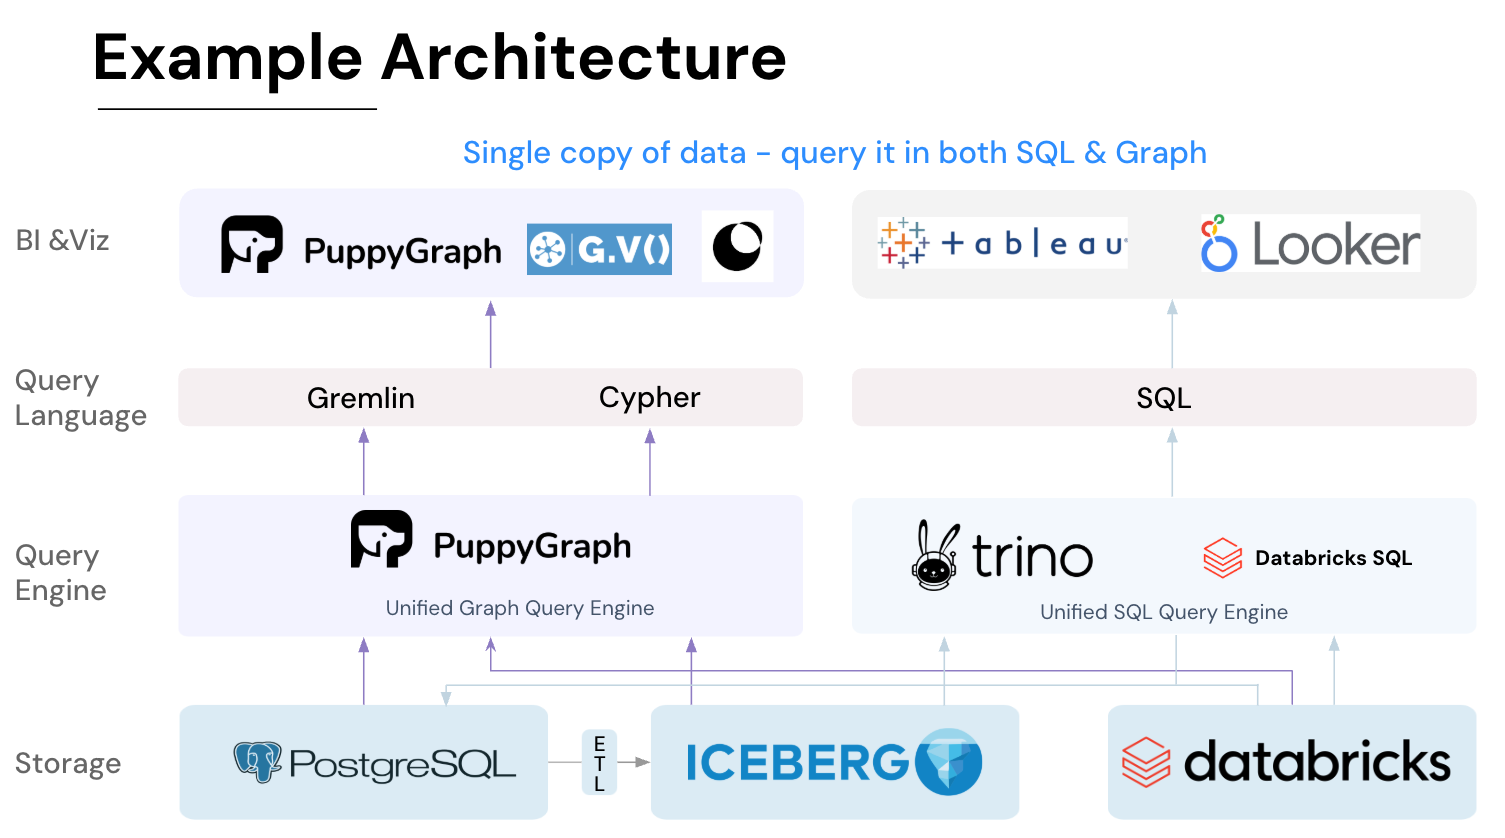
Graph Technologies
Graph technologies help when root causes span many connected entities, like services, dependencies, changes, people, assets, and tickets. Instead of stitching context together manually, you can query paths, neighborhoods, and recurring patterns directly on relationship data. For a more in-depth comparison on graph databases, check out our other blog here.
Automated RCA platforms
Automated RCA platforms are harder to rank head-to-head because “good” depends on the domain. Different industries watch for different signals and failure patterns, so the best fit often comes down to which data sources the platform understands best and how well it fits your incident workflow. For example, Datadog’s Watchdog RCA is built around observability signals, while tools like SentiSum focus on customer-facing signals like surveys, tickets, reviews, social posts, and CRM notes to surface recurring issues and drivers of churn.
How PuppyGraph Helps
RCA is increasingly hybrid: teams still need human judgment to frame the problem and test assumptions, but data is what confirms what actually happened. As organizations scale, evidence gets scattered across tools and teams, so investigating each dataset in isolation hides the interactions that drive failures. That’s also why “the” root cause can be misleading. Many incidents come from a chain of contributing conditions across systems and handoffs, and fixes that only address the visible symptom often fail to prevent a repeat.
Graph-based approaches help because they make those relationships explicit. They can support RCA at multiple points in the workflow:
- Gather context: Unify signals and connect entities across datasets
- Locate likely causes: Trace dependency paths and contributing factors across hops
- Learn from history: Match patterns to similar past incidents and see which actions actually worked
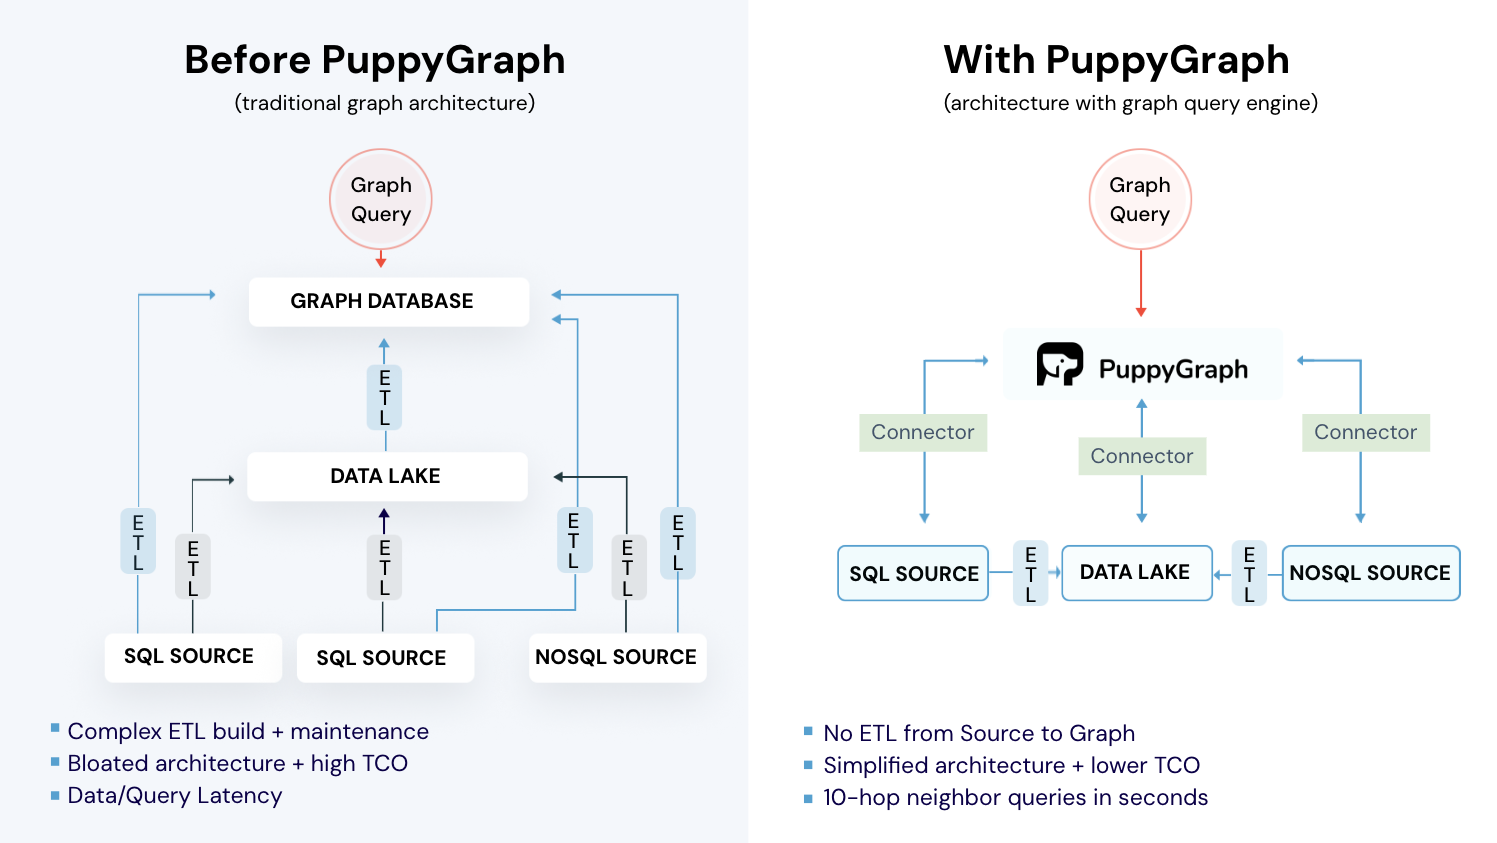
The catch is that most graph products on the market are graph databases. They typically require copying data into a separate store and maintaining ETL pipelines, which adds ongoing cost and operational overhead. That’s where PuppyGraph comes in.

PuppyGraph is the first and only real time, zero-ETL graph query engine in the market, empowering data teams to query existing relational data stores as a unified graph model that can be deployed in under 10 minutes, bypassing traditional graph databases' cost, latency, and maintenance hurdles.
It seamlessly integrates with data lakes like Apache Iceberg, Apache Hudi, and Delta Lake, as well as databases including MySQL, PostgreSQL, and DuckDB, so you can query across multiple sources simultaneously.

Key PuppyGraph capabilities include:
- Zero ETL: PuppyGraph runs as a query engine on your existing relational databases and lakes. Skip pipeline builds, reduce fragility, and start querying as a graph in minutes.
- No Data Duplication: Query your data in place, eliminating the need to copy large datasets into a separate graph database. This ensures data consistency and leverages existing data access controls.
- Real Time Analysis: By querying live source data, analyses reflect the current state of the environment, mitigating the problem of relying on static, potentially outdated graph snapshots. PuppyGraph users report 6-hop queries across billions of edges in less than 3 seconds.
- Scalable Performance: PuppyGraph’s distributed compute engine scales with your cluster size. Run petabyte-scale workloads and deep traversals like 10-hop neighbors, and get answers back in seconds. This exceptional query performance is achieved through the use of parallel processing and vectorized evaluation technology.
- Best of SQL and Graph: Because PuppyGraph queries your data in place, teams can use their existing SQL engines for tabular workloads and PuppyGraph for relationship-heavy analysis, all on the same source tables. No need to force every use case through a graph database or retrain teams on a new query language.
- Lower Total Cost of Ownership: Graph databases make you pay twice — once for pipelines, duplicated storage, and parallel governance, and again for the high-memory hardware needed to make them fast. PuppyGraph removes both costs by querying your lake directly with zero ETL and no second system to maintain. No massive RAM bills, no duplicated ACLs, and no extra infrastructure to secure.
- Flexible and Iterative Modeling: Using metadata driven schemas allows creating multiple graph views from the same underlying data. Models can be iterated upon quickly without rebuilding data pipelines, supporting agile analysis workflows.
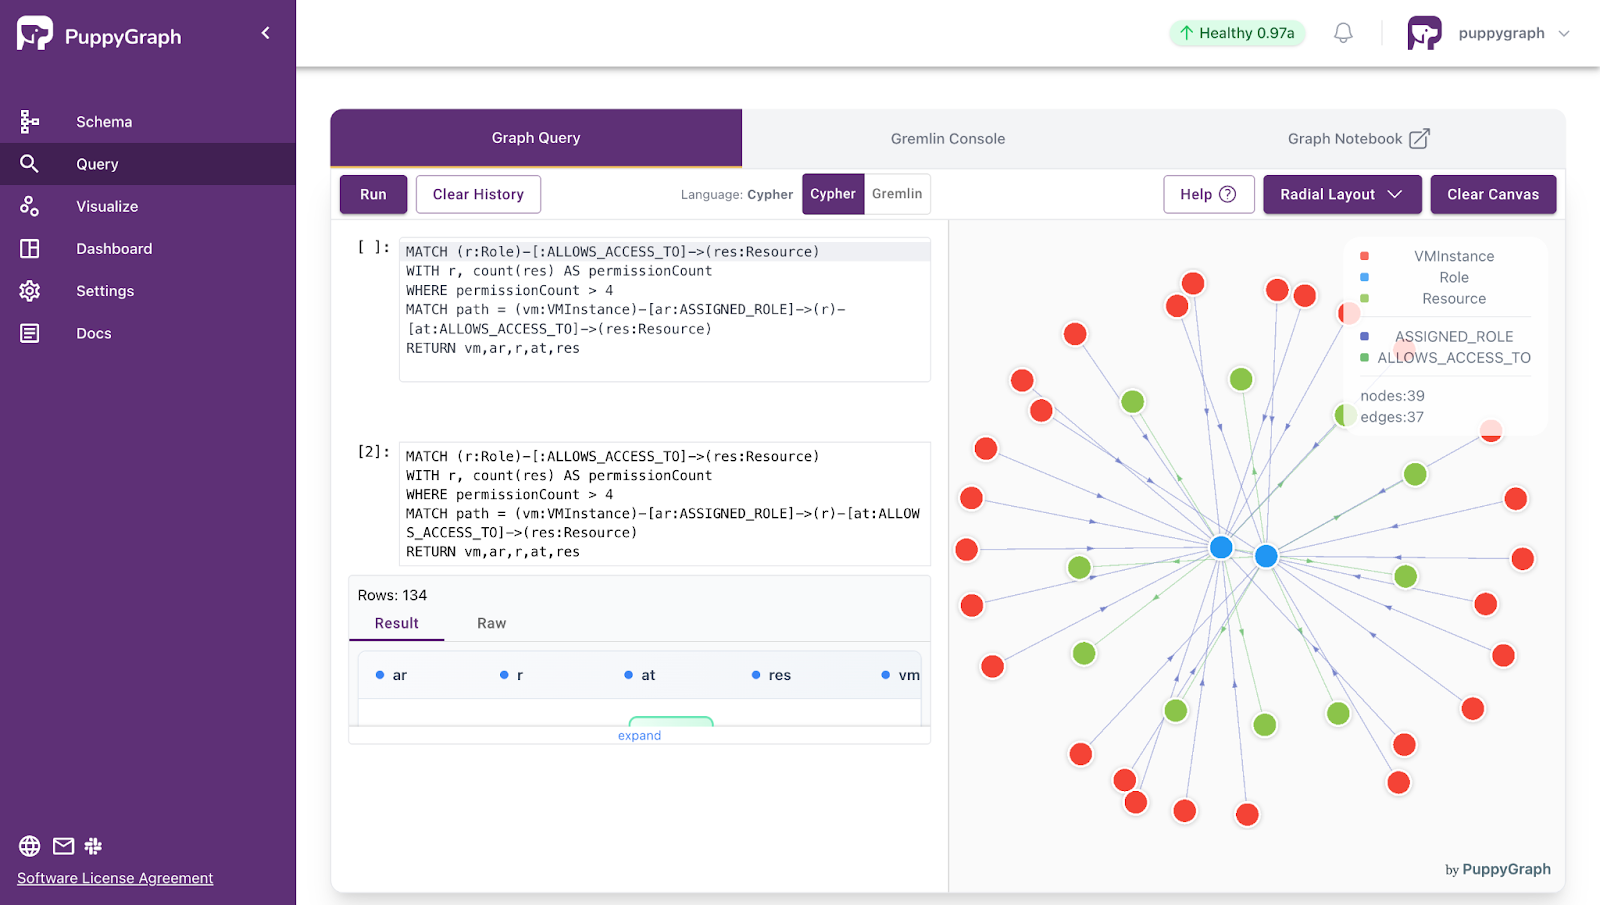
- Standard Querying and Visualization: Support for standard graph query languages (openCypher, Gremlin) and integrated visualization tools helps analysts explore relationships intuitively and effectively.
- Proven at Enterprise Scale: PuppyGraph is already used by half of the top 20 cybersecurity companies, as well as engineering-driven enterprises like AMD and Coinbase. Whether it’s multi-hop security reasoning, asset intelligence, or deep relationship queries across massive datasets, these teams trust PuppyGraph to replace slow ETL pipelines and complex graph stacks with a simpler, faster architecture.


As data grows more complex, the most valuable insights often lie in how entities relate. PuppyGraph brings those insights to the surface, whether you’re modeling organizational networks, social introductions, fraud and cybersecurity graphs, or GraphRAG pipelines that trace knowledge provenance.
Deployment is simple: download the free Docker image, connect PuppyGraph to your existing data stores, define graph schemas, and start querying. PuppyGraph can be deployed via Docker, AWS AMI, GCP Marketplace, or within a VPC or data center for full data control.
Conclusion
Root cause analysis works best when you combine knowledge-driven methods (structured reasoning like 5 Whys, fishbone, FTA, FMEA) with data-driven insights that validate what actually happened in the real system. That blend helps teams move past a cycle of hot fixes by separating symptoms from causes, documenting evidence, and turning findings into corrective and preventive actions that hold over time.
We also looked at how RCA software supports that shift, from lightweight tools like whiteboards and spreadsheets to dedicated RCA platforms, automated RCA tools, and graph technologies. Graphs matter because many failures are not isolated, they show up as chains across dependencies, owners, and signals. When you can query relationships and paths across connected data, you get the right insights to fix the right problem: connected insights.
Want to start graphing for root causes? Download PuppyGraph’s forever-free Developer Edition, or book a demo with the team to see it on your data.

Jaz Ku is a Solution Architect with a background in Computer Science and an interest in technical writing. She earned her Bachelor's degree from the University of San Francisco, where she did research involving Rust’s compiler infrastructure. Jaz enjoys the challenge of explaining complex ideas in a clear and straightforward way.

Get started with PuppyGraph!


Developer Edition
- Forever free
- Single noded
- Designed for proving your ideas
- Available via Docker install
Enterprise Edition
- 30-day free trial with full features
- Everything in developer edition & enterprise features
- Designed for production
- Available via AWS AMI & Docker install