

What Is Security Event Correlation?
A single security event almost never tells you what is happening. A failed login, a new process on a host, a large outbound transfer, an EDR alert: in isolation each is ambiguous, and a modern environment produces millions of them an hour across dozens of tools. The evidence of an attack rarely lives in any one event; it lives in the relationship between several, spread across different systems and separated in time. Security event correlation is the practice of finding those relationships, turning a flood of low-level events into a much smaller set of findings an analyst or an automated workflow can act on.
This post explains what security event correlation is, how it works end to end, the events and techniques it draws on, and several worked examples. It then weighs the benefits against the real challenges, and closes on how a knowledge-graph view of security data makes the relationship questions at the heart of correlation directly queryable.
What is security event correlation?
Security event correlation is the process of analyzing security events from many sources, finding meaningful relationships among them, and collapsing a large volume of low-level events into a smaller number of higher-level, actionable findings. The inputs are authentication logs, endpoint telemetry, network flows, cloud audit trails, or alerts from other security tools; the output is a finding or an incident that represents a pattern rather than a single data point: a brute-force attempt, a lateral-movement sequence, an account takeover in progress.
Correlation is more than two operations it is often confused with. Aggregation counts or groups similar events (how many failed logins in the last minute); deduplication collapses identical events into one. Correlation is the step beyond both, relating events that are not identical and often come from different sources, asserting that together they mean something no single event does.
In security operations this work is the analytical heart of a SIEM (security information and event management) platform. The SIEM stores the logs; the correlation engine is the component that reasons over them and flags the patterns. The lineage predates the SIEM, rooted in event correlation in network and systems management and in complex event processing, the discipline of detecting patterns across event streams in near real time. What the security context adds is intent: the patterns worth catching are the ones that indicate an adversary, and the cost of missing one is a breach rather than an outage.
How security event correlation works
Correlation runs as a continuous pipeline, tracing the path a security event takes from arrival to response. The engine that implements these stages has internals worth a separate discussion; here the focus is the security logic at each.
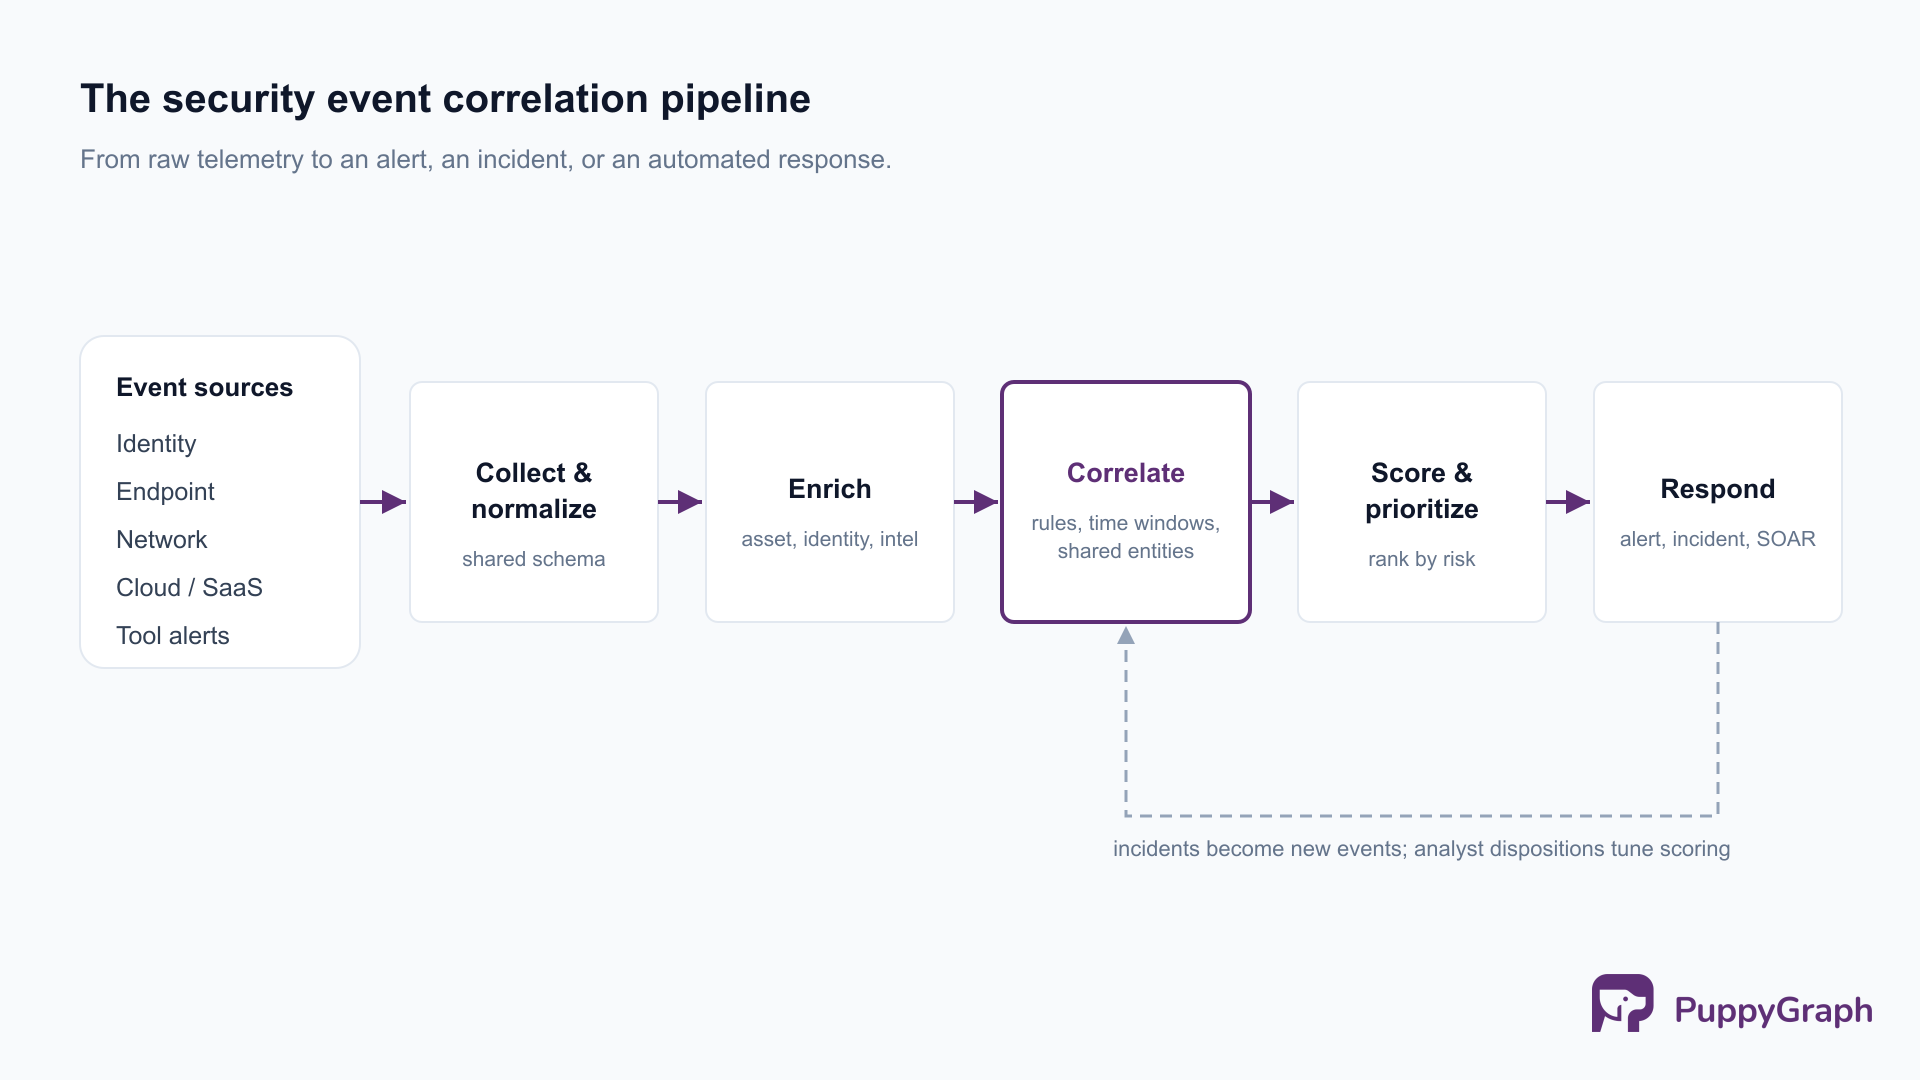
Collection and normalization come first. Events arrive from agents, log forwarders, and APIs in a sprawl of formats, and they cannot be compared until they share a schema. Normalization parses each into common fields (timestamp, source and destination, user, host, action, outcome) so a Windows security log, a firewall syslog message, and a cloud audit record become comparable. This step bounds everything downstream: correlation across sources is only possible once those sources speak the same field names.
Enrichment adds the context a raw event lacks, annotating it with asset criticality from a CMDB, user role from an identity provider, geolocation for an IP, or threat-intelligence reputation for a domain or hash, so later stages can judge whether it matters.
Correlation is the core. The engine evaluates incoming events against its logic, whether rules, a baseline, or a model. Because most meaningful security patterns are sequences rather than single events, this stage maintains state across a time window, testing whether a new arrival completes a pattern earlier events began, and it relates events by shared entities, joining everything that touches one user, host, or address into a single thread.
Scoring and prioritization rank what correlation surfaces by asset criticality, match confidence, and resemblance to known malicious behavior, so a SOC works the highest-risk findings first instead of a flat, undifferentiated queue.
Response closes the loop. A finding can raise an alert, open or update an incident, page a responder, or trigger an automated playbook in a SOAR (security orchestration, automation, and response) tool: isolating a host, disabling an account, or forcing a credential reset. The range of authorized automated responses is much of what separates passive monitoring from active defense.
Types of security events used in correlation
Correlation is only as good as the breadth of what it draws on; a relationship it cannot see across is one it cannot find.
Authentication and identity events (logins, privilege changes, MFA prompts, directory modifications) are the backbone of detecting credential abuse and the starting point for most account-takeover and insider-threat patterns.
Endpoint and process events from EDR agents and host logs (process creation, command-line arguments, file and registry changes) reveal what actually executed on a machine, where an intrusion becomes concrete after an initial foothold.
Network and flow data (firewall logs, NetFlow, DNS queries, proxy records) describe what is talking to what, central to detecting lateral movement, command-and-control traffic, and exfiltration, where the relationship between endpoints is itself the signal.
Cloud and SaaS audit logs track control-plane activity (API calls, role assignments, policy changes), indispensable for catching misconfiguration abuse and cloud-native attack paths as infrastructure moved off the host. Closer to the data, application and database logs add query patterns and transaction records that can expose injection attempts or abnormal access to sensitive records.
Alerts from other security tools are increasingly an input in their own right. EDR, IDS/IPS, DLP, and cloud-security tools each emit alerts, and a higher-level step relates those alerts to one another, a pattern often called alert correlation or, across detection layers, the job of XDR (extended detection and response).
Threat-intelligence indicators (known-malicious IPs, domains, file hashes, and adversary techniques mapped to MITRE ATT&CK) both enrich events and drive rules that fire when internal activity matches a known indicator.
The breadth is the point. A multi-stage attack touches a different tool at each step, so the event in any single source is only a fragment, and the more sources correlation can normalize and relate, the fewer cross-system patterns slip through the gaps between tools.
Security event correlation techniques
Correlation does not rely on a single technique. It combines several, each suited to a different kind of pattern.
Rule-based correlation encodes a pattern as an explicit rule, usually Boolean logic over fields plus a threshold and a time window. It is precise, transparent, and the backbone of SIEM detection, but it only catches what someone thought to write.
Temporal correlation relates events by ordering and timing, recognizing a sequence within a window. It is what lets correlation see an attack chain and separate an initial action from its downstream effects.
Spatial or topological correlation relates events by a shared entity or topology position: everything touching the same host, user, or credential. The relationships it depends on (which account owns which host, which host can reach which server) are exactly the context that flat event tables represent poorly.
Statistical and anomaly-based correlation baselines normal behavior and flags deviations rather than matching a predefined pattern. It catches novel behavior a rule would miss, but an anomaly is not a threat, so it needs careful tuning.
Machine-learning and behavioral correlation learns patterns from historical data; user and entity behavior analytics (UEBA) is the best-known security example, profiling normal behavior per user and host. It surfaces relationships no one specified in advance, at the price of less transparency and a dependence on representative training data.
No single technique is sufficient; a capable program layers them, rules for the known cases and statistical and ML methods for the unknown, with temporal and topological logic threading through both. The challenge is combining them so that each one’s failure mode does not flood the others’ output.
Security event correlation examples
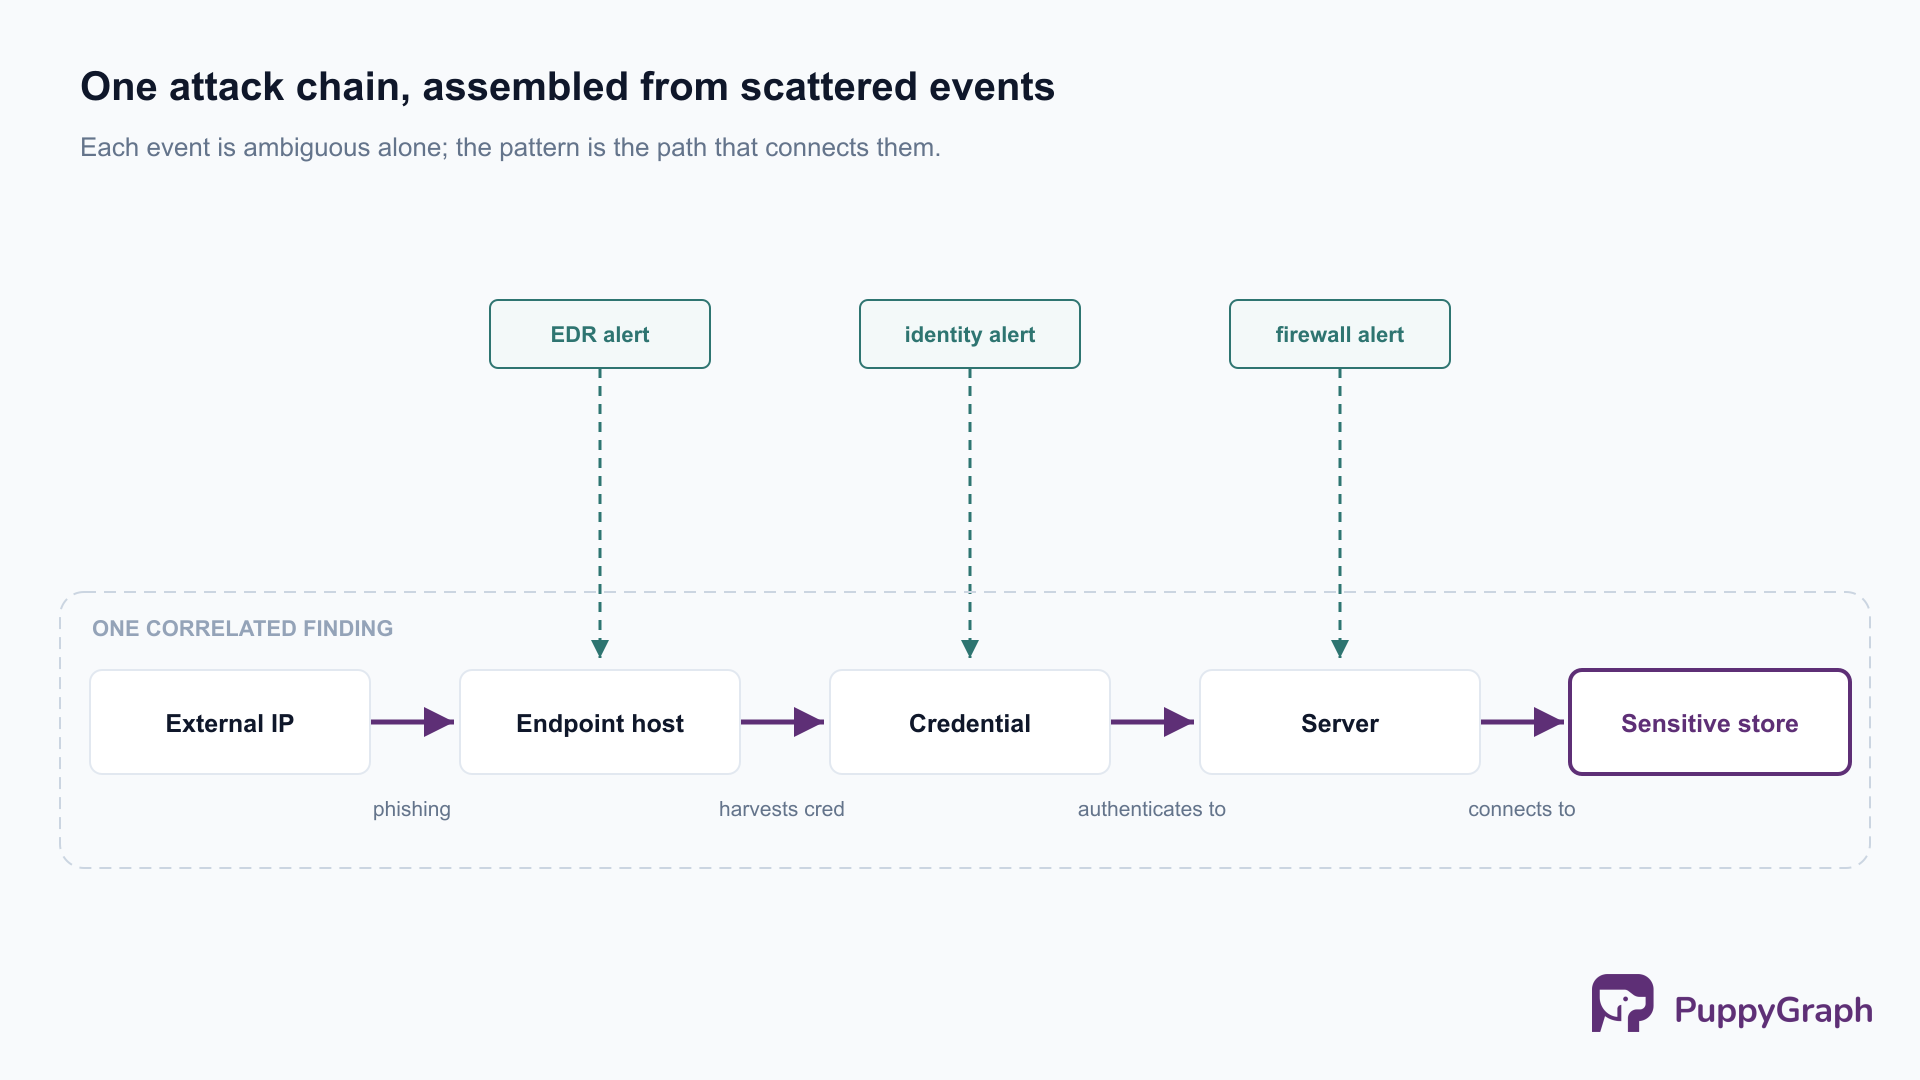
Each example below is built from events that are individually unremarkable and only become a finding once correlation relates them.
Account takeover from credential abuse. A handful of failed logins is routine noise, and a successful login right after them is normal too. But failed logins from an unfamiliar IP, then a success, then access to a sensitive file share, then a mailbox rule that forwards mail externally, is a sequence that correlation assembles into a single account-takeover finding. The temporal order and the shared user identity turn four mundane events into one alert worth paging on.
Lateral movement along an attack chain. A user clicks a phishing link, an endpoint spawns an unexpected PowerShell process, credentials are harvested, and minutes later that credential authenticates to a server it has never touched, which then connects to an internal database. Each step lives in a different tool (email security, EDR, identity, network) and looks benign on its own; correlated by the shared host and credential and their tight ordering, they describe an adversary moving toward data.
Impossible travel. A user signs in from one country and, twenty minutes later, from another thousands of miles away. Neither sign-in is suspicious alone, but correlating the two by user identity against geolocation and timestamps is a high-confidence indicator of compromised credentials, with almost no false-positive cost.
Data exfiltration after privilege escalation. A role change granting broad read access is legitimate, and a large outbound transfer is, in isolation, just traffic. But a privilege escalation followed shortly by an unusually large transfer to an external destination, from an account that does not normally move data, correlates into a probable exfiltration, joining an identity event, a volume anomaly, and a network flow. In every case the signal is in the relationship, not the event.
Benefits of security event correlation
Faster, higher-confidence detection. Relating events across sources in near real time surfaces a multi-stage attack while it is unfolding rather than after the fact. Long-running breaches are expensive precisely because no one joined the fragments early: in the IBM Cost of a Data Breach Report 2025, organizations took a mean of 241 days to identify and contain a breach. Correlation compresses that timeline, joining the fragments as they arrive.
Reduced alert fatigue. Alert fatigue is the state in which analysts face more alerts than they can investigate, so real threats get lost among false positives. It is well documented: in the SANS 2025 Detection and Response Survey, 73% of organizations listed false positives as their number one challenge in threat detection. Correlation fights this directly, because reducing many events to a few findings is the same operation as reducing many alerts to a few worth acting on. Deduplication collapses repeated alerts, aggregation assembles the alerts of one incident into a single object, and prioritization reorders what remains so the highest-risk findings rise to the top.
Attack-chain visibility and prioritization. Relating events by sequence and shared entity presents an incident as a connected story rather than a pile of disconnected alerts, which lets a responder understand scope. Findings enriched with asset criticality and identity context can then be ranked by real risk, the highest-confidence ones driving automated response through a SOAR playbook, and the correlated record becomes the audit trail compliance reporting depends on.
The honest caveat is that these benefits are properties of well-built correlation logic, not automatic consequences of having it. Poorly written rules and untuned anomaly detection are themselves major sources of false positives, so the same machinery can add to the noise it is meant to cut. The benefit is earned by the rules and the tuning, which is exactly where the challenges live.
Challenges of security event correlation
Data quality and normalization. Correlation across sources depends on those sources sharing a schema, and real telemetry is messy: inconsistent field names, missing values, and clock skew between systems. Every gap in normalization is a relationship the engine silently cannot see.
Rule sprawl and maintenance. Rule sets accumulate over years and rot: thresholds drift, the environment changes, and nobody is sure which rules still earn their keep. A stale rule is both a false-positive source and a coverage gap, and tuning to cut false positives risks suppressing real signal, so the balance is delicate and never finished.
Scale and performance. Large environments generate billions of events a day, and correlation has to evaluate patterns over that stream while holding enough state to catch sequences that unfold over hours, all without unbounded memory growth.
Tool silos. The events that matter are scattered across EDR, identity, network, and cloud tools, each with its own store and console, and the seams between them are where cross-system attacks hide.
Relationship questions on flat data. The deepest challenge is structural. Many of the most valuable correlation questions are about how entities connect rather than any single event: which assets a compromised account can reach, the blast radius of a host, or which seemingly unrelated alerts touch the same identity. These multi-hop questions are awkward and slow on a flat event store, where the relationships are implicit in shared identifiers scattered across tables rather than modeled as first-class links. This is what a graph view of security data is built to address.
How knowledge graphs improve security event correlation
A knowledge graph models data as entities and the relationships between them, both first-class. Instead of rows in separate tables joined by shared keys at query time, a user, a host, a credential, an IP, an alert, and a vulnerability are nodes, and the connections among them (this account owns this host, this alert references this credential) are edges traversed directly. The questions correlation cares about map onto this cleanly, because attack paths, identity reach, and asset dependencies are graphs in the first place.
The advantage is most visible on multi-hop questions. Asking which sensitive assets a single compromised credential could reach, across two or three hops of “can authenticate to” and “can connect to” relationships, is a single graph traversal, where on flat tables it is a chain of joins that gets slower with every hop and tends to be answered by hand rather than asked routinely. Blast-radius and attack-path questions become things an analyst can ask in seconds, and pulling back every alert and asset touching one identity is a traversal, not a cross-table search.
A graph layer over existing security data
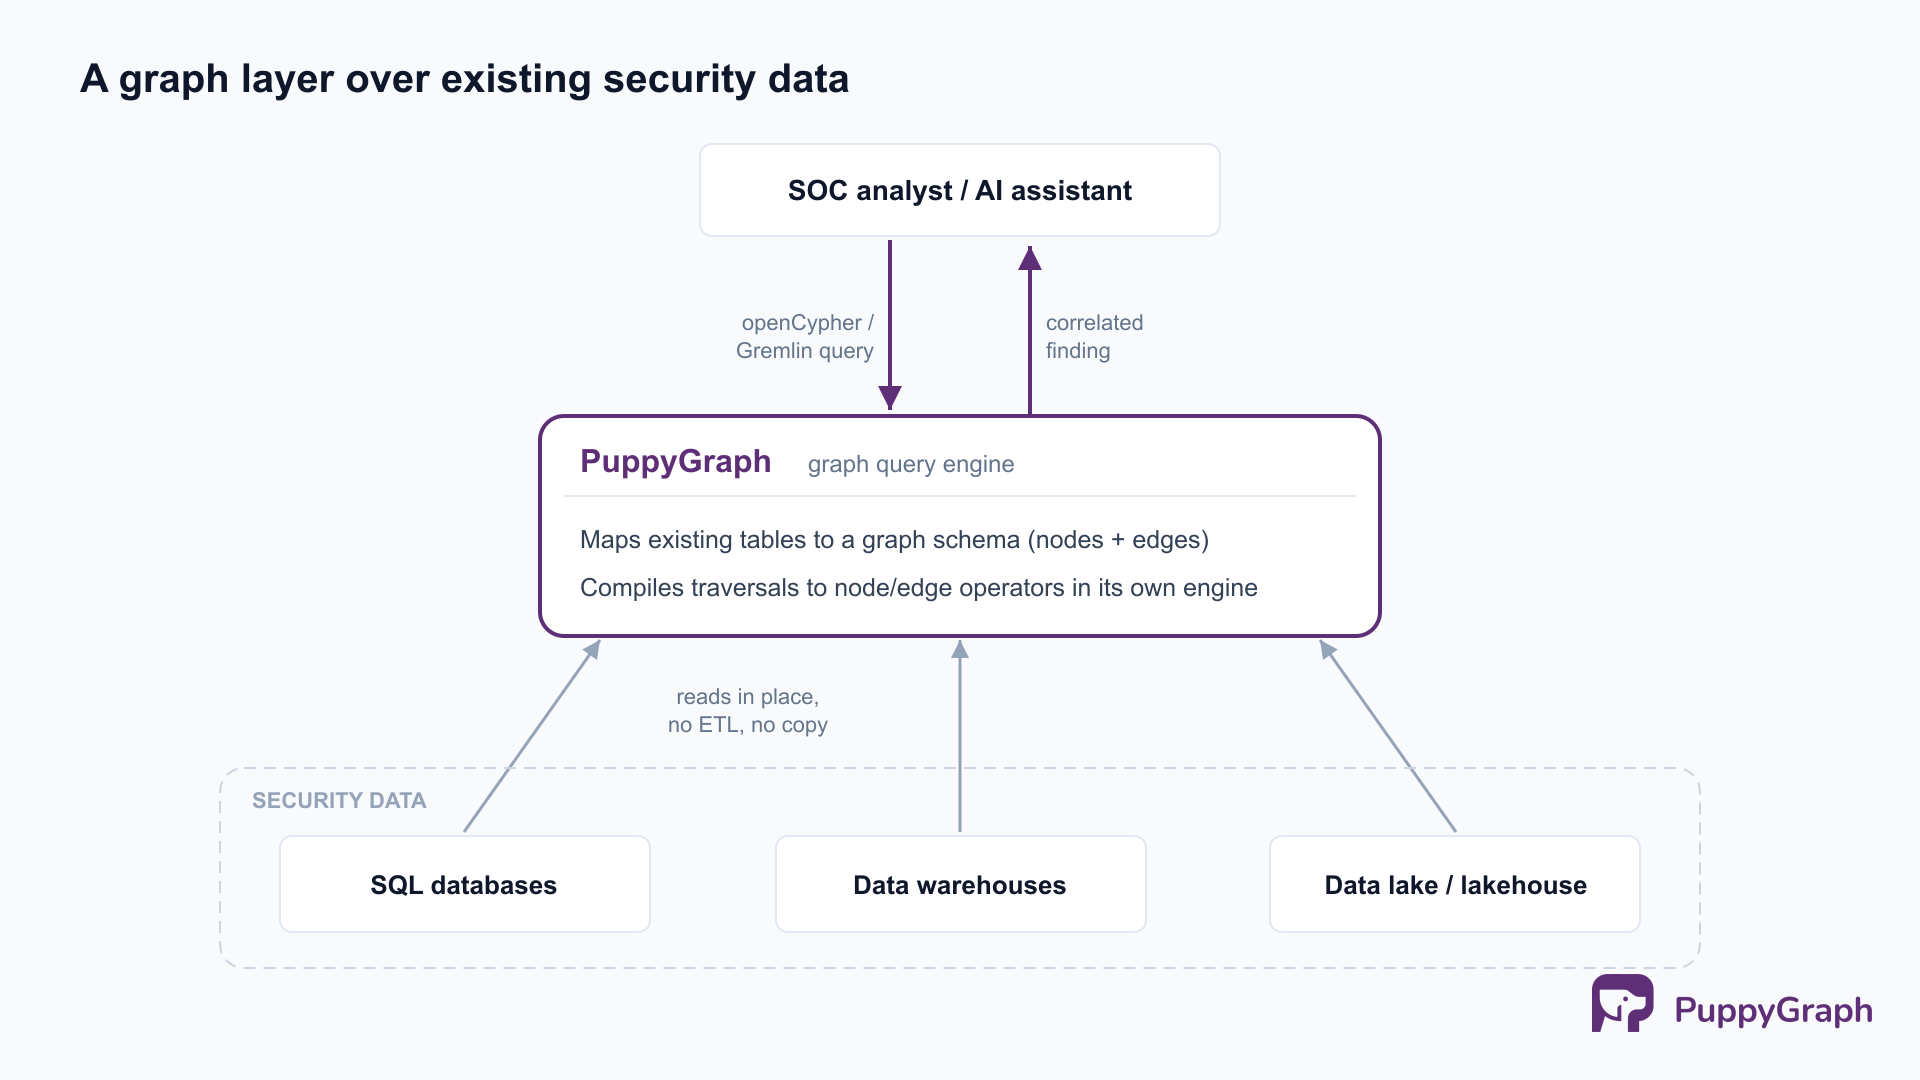
The traditional way to get a graph view was to export event and asset data into a separate graph database through an ETL pipeline, which adds latency, cost, and another system to secure. PuppyGraph takes a different path: it is a graph query engine that maps existing tables (assets, identities, events, alerts, vulnerabilities) to nodes and edges and runs multi-hop traversals over them where the data already lives, in a SQL database, a data warehouse, or a data lake using open table formats like Iceberg, with no copy into a separate database. Analysts query the graph with openCypher (Gremlin is also supported), asking what a compromised credential can reach or which paths lead to a sensitive asset, and get the correlated finding back rather than disconnected findings. Because it compiles a traversal into graph operators executed in its own engine, rather than translating the query into SQL and pushing it down to the source, deep multi-hop queries stay practical over data that was never modeled as a graph.
PuppyGraph is not a SIEM, an XDR, or a correlation engine. It does not ingest event streams or run detection rules, and it does not replace the tools that produce the events. It is a relationship layer that complements them, turning the entities those tools reference into a graph an analyst can traverse, so the relationship questions correlation raises but flat stores answer poorly become directly queryable. This kind of graph layer for security correlation, unified asset inventory, and exposure analysis is used by Palo Alto Networks, Datadog, Netskope, Trend Micro, Sola Security, and Blackpoint Cyber.
Conclusion
Security event correlation is the practice that turns a flood of individual security events into a small set of findings worth acting on. It normalizes telemetry from many sources, enriches it, relates events through rule-based, temporal, topological, statistical, and machine-learning techniques, scores what it finds, and drives a response. Its value is not in collecting more data, which every tool in the stack already does, but in the correlation step that no single tool performs on its own.
Two things decide whether that value is realized: how well the logic cuts alert fatigue rather than adding to it, and how much relationship context it can bring to each finding. Both come down to relationships, between events and between the entities those events touch. To see how a graph layer over existing event, asset, and identity data makes relationship questions like attack paths and blast radius queryable without standing up a separate database, try the forever-free PuppyGraph Developer Edition and book a demo with the team to see how openCypher and Gremlin queries run over warehouse and lakehouse tables, with no graph-specific ETL, alongside the SIEM and detection tools that produce the events.

Sa Wang is a Software Engineer with exceptional mathematical ability and strong coding skills. He holds a Bachelor's degree in Computer Science and a Master's degree in Philosophy from Fudan University, where he specialized in Mathematical Logic.

Get started with PuppyGraph!


Developer Edition
- Forever free
- Single noded
- Designed for proving your ideas
- Available via Docker install
Enterprise Edition
- 30-day free trial with full features
- Everything in developer edition & enterprise features
- Designed for production
- Available via AWS AMI & Docker install