

Taxonomy Graph: Structure, Benefits & Use Cases
In modern data ecosystems, organizations constantly struggle to organize growing volumes of content, entities, and concepts into meaningful structures. Traditional hierarchical taxonomies have long helped categorize information, but as datasets expand and relationships grow more complex, simple tree structures often fall short. A taxonomy graph extends classical classification by combining hierarchical organization with graph-based modeling, allowing systems to represent relationships, dependencies, and contextual meaning more effectively.
Unlike flat tagging systems or rigid classification trees, taxonomy graphs introduce a flexible way to manage conceptual hierarchies while maintaining rich links between categories. They are increasingly used in knowledge management, semantic search, AI training pipelines, recommendation systems, and enterprise data governance. By blending taxonomy logic with graph structures, organizations can preserve clear classifications while gaining deeper analytical and navigational capabilities.
This article explores what taxonomy graphs are, how they differ from ontologies and knowledge graphs, and how their underlying components work. It also examines practical benefits, challenges, and implementation strategies, along with real-world applications. Finally, it discusses how modern platforms like PuppyGraph can help build taxonomy-driven graph layers on top of existing data without complex migrations. Together, these perspectives provide a comprehensive understanding of taxonomy graphs and their role in modern data architectures.
What is a Taxonomy Graph
A taxonomy graph is a structured representation of categorized knowledge where entities and concepts are organized into hierarchical classes while also being connected through graph relationships. Traditional taxonomies usually resemble trees with strict parent-child structures. In contrast, a taxonomy graph introduces additional links between categories or concepts, enabling a richer and more flexible representation of knowledge. The result is a model that supports both classification and contextual exploration within a single structure.
The main purpose of a taxonomy graph is to organize information logically while supporting advanced semantic analysis. In practice, nodes represent categories, concepts, or entities and edges represent hierarchical or associative relationships. For example, a biology taxonomy may classify animals into categories such as Mammals or Birds, while also connecting species through shared traits like “can fly” or “lives in water.” These connections allow users and systems to explore data beyond strict hierarchical paths.
Another important characteristic of taxonomy graphs is their ability to evolve continuously: new nodes or relationships can be incrementally introduced as domains develop and knowledge is updated. This adaptability and expressiveness make taxonomy graphs particularly effective in rapidly changing fields such as healthcare, finance, and AI research.
Taxonomy graphs also serve as foundational layers for semantic search and related applications. By encoding hierarchical meaning alongside contextual relationships, they enable systems to interpret user queries more effectively. Search engines can expand queries to include related categories, and recommendation systems can identify patterns based on shared classification paths. This combination of hierarchy and connectivity distinguishes taxonomy graphs from both simple classification trees and fully open-ended graph models.
Taxonomy vs Ontology vs Knowledge Graph
Understanding the difference between taxonomies, ontologies, and knowledge graphs is crucial, as these terms are often used interchangeably but represent distinct layers of knowledge organization.
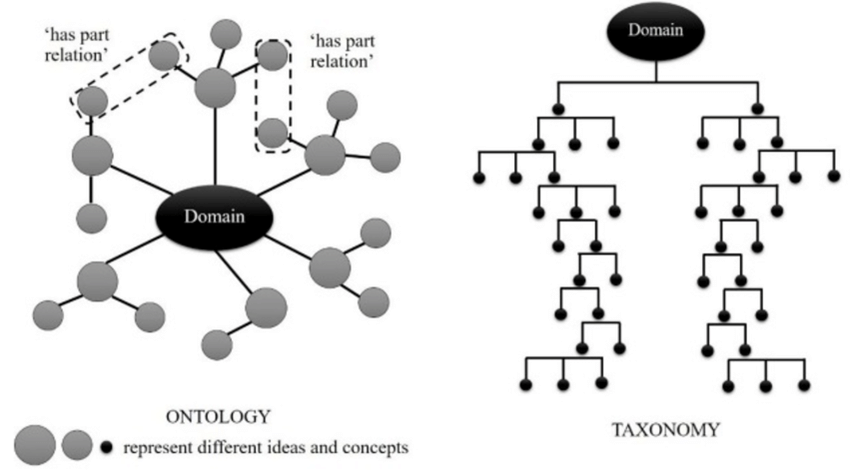
- Taxonomy: A taxonomy provides a hierarchical classification of concepts, organizing them into parent-child relationships. It is primarily used for categorization, navigation, and organizing information. Taxonomies answer questions like “What category does this belong to?” and “How is this concept classified?”
- Ontology: An ontology formally defines the types of entities, relationships, attributes, constraints, and rules that describe the structure and meaning of knowledge within a domain. It provides a conceptual framework for consistency, reasoning, and shared understanding. Essentially, ontologies answer “what does it mean?” rather than focusing on specific data instances.
- Knowledge Graph: A knowledge graph captures concrete entities and their relationships, representing instance-level facts and contextual information across domains. It enables complex queries, discovery, and operational insights. Unlike ontologies, which define semantics, knowledge graphs focus on real-world data and answer “what is happening?” Knowledge graphs often use ontologies as a semantic backbone to structure the data while remaining dynamic and scalable.
In practice, taxonomy graphs bridge the gap between structured classification and semantic modeling, combining hierarchical organization with relational context to support richer navigation and discovery.
How Taxonomy Graphs Work (Nodes, Edges, Hierarchy)
Taxonomy graphs operate primarily through two core structural elements: nodes and edges. Rather than functioning as rigid layered structures, they combine classification relationships with flexible connections that allow knowledge to be explored in multiple ways. Hierarchy remains an important conceptual aspect of taxonomy graphs, but it represents a type of relationship rather than a required structural layer.
Nodes represent concepts, categories, or entities within the taxonomy. These may include topics, product classes, organizational units, or any conceptual grouping relevant to a domain. Each node can contain metadata, labels, or attributes that describe its meaning and contextual role. In many systems, nodes also carry identifiers that allow integration with underlying data sources.
Edges define the relationships between nodes. The most common relationship expresses hierarchical meaning, often described as “is-a” or “belongs-to.” However, taxonomy graphs extend beyond strict classification by including associative links such as “related-to,” “used-with,” or “similar-category.” These additional edges enable non-linear navigation and provide contextual insight that improves discovery and analysis. Unlike simple trees, nodes in taxonomy graphs may have multiple parents or cross-links, reflecting real-world complexity more accurately.
Hierarchy in a taxonomy graph is best understood as an abstract organizational principle rather than a fixed structural layer. Many taxonomy graphs preserve parent-child relationships that help users interpret conceptual scope and specificity, but the structure does not need to follow rigid levels or predefined layers. Some implementations may emphasize hierarchical navigation, while others rely more heavily on associative connections. This flexibility allows taxonomy graphs to represent classification meaning while adapting to domains where concepts overlap, evolve, or exist in multiple contexts.
Benefits of Using a Taxonomy Graph
One clear benefit is multi-path discovery and navigation. In a traditional taxonomy, users can only move along predefined hierarchical paths, which limits exploration when concepts belong to multiple contexts. A taxonomy graph allows categories to be connected through associative relationships in addition to hierarchical ones. For example, a product category may belong to a functional hierarchy while also being linked to use-case or industry-based groupings. These additional connections allow systems and users to explore data through multiple conceptual perspectives rather than a single fixed structure.
Another important advantage is reduced ambiguity in classification. Traditional taxonomies often struggle when concepts overlap or evolve. Taxonomy graphs address this limitation by allowing multiple parents and non-hierarchical relationships. When new conceptual relationships emerge, teams can introduce new edges that describe contextual meaning directly. This allows classification models to evolve naturally while preserving conceptual clarity across overlapping domains. This approach preserves existing classification logic while providing more accurate representations of complex domains.
Finally, taxonomy graphs improve long-term maintainability of classification systems. In a graph-based model, organizations can extend the structure incrementally by adding nodes and relationships. This makes taxonomy graphs more resilient in domains where terminology evolves frequently, such as technology, healthcare, and digital commerce.
Taxonomy Graph Challenges
Despite their flexibility and analytical power, taxonomy graphs introduce a set of design, operational, and technical challenges that organizations must address to ensure long-term scalability and usability.
- Modeling Complexity: Taxonomy graphs require careful design. Decisions on relationship types, hierarchical levels, and naming conventions must be made thoughtfully to prevent redundancy or ambiguity. Poor planning can limit the graph’s scalability as new concepts or domains are added. Here, scalability refers to the ability to extend the taxonomy smoothly over time without creating inconsistencies or structural issues.
- System Integration: Mapping existing data sources, such as relational databases, data lakes, or document stores, into a taxonomy graph requires appropriate connectors, transformation logic, and sometimes semantic enrichment. Ensuring that updates in source systems propagate correctly to the graph layer is also essential.
- Performance Considerations: Performance challenges mirror those of knowledge graphs. Complex queries can involve multiple hops across hierarchical levels or cross-category relationships. As the number of nodes and edges grows, queries can become slow and resource-intensive. Optimizations such as indexing, caching, or partitioning may be necessary to maintain acceptable performance.
How Taxonomy Graphs Are Built
Building a taxonomy graph is typically an iterative process that combines conceptual design, structural modeling, technical implementation, and continuous refinement as the domain evolves.
- Domain Analysis and Conceptual Modeling
Building a taxonomy graph typically begins with domain analysis and conceptual modeling. Subject matter experts identify key entities, categories, and classification criteria relevant to the domain. This process often involves reviewing existing taxonomies, metadata schemas, or classification standards to ensure alignment with organizational goals. The result is an initial conceptual model that defines nodes, hierarchical layers, and relationship types. - Structuring the Taxonomy into a Graph Representation
The next phase involves structuring the taxonomy into a graph representation. Designers map categories into nodes and establish hierarchical edges reflecting parent-child relationships. They also introduce associative relationships that capture cross-category connections. During this stage, teams may use diagramming tools or modeling languages to validate structures visually before implementation. Iterative review helps ensure that the taxonomy remains intuitive and scalable. - Implementation in Data Platforms
Implementation typically occurs within graph databases or semantic data platforms. Data engineers connect underlying data sources to taxonomy nodes through identifiers or metadata mappings. Automation pipelines may be developed to update the taxonomy graph as new categories or entities appear in source systems. Validation processes ensure that new nodes conform to established governance rules and naming conventions. - Ongoing Maintenance and Evolution
Once deployed, ongoing maintenance becomes a core part of taxonomy graph management. Teams monitor usage patterns, update categories, and refine relationships based on user feedback or evolving business needs. Continuous improvement ensures that the taxonomy graph remains relevant and accurate. Over time, organizations may enrich taxonomy graphs with additional semantic layers, gradually transforming them into more comprehensive knowledge graph frameworks.
How PuppyGraph Helps with Taxonomy Graph
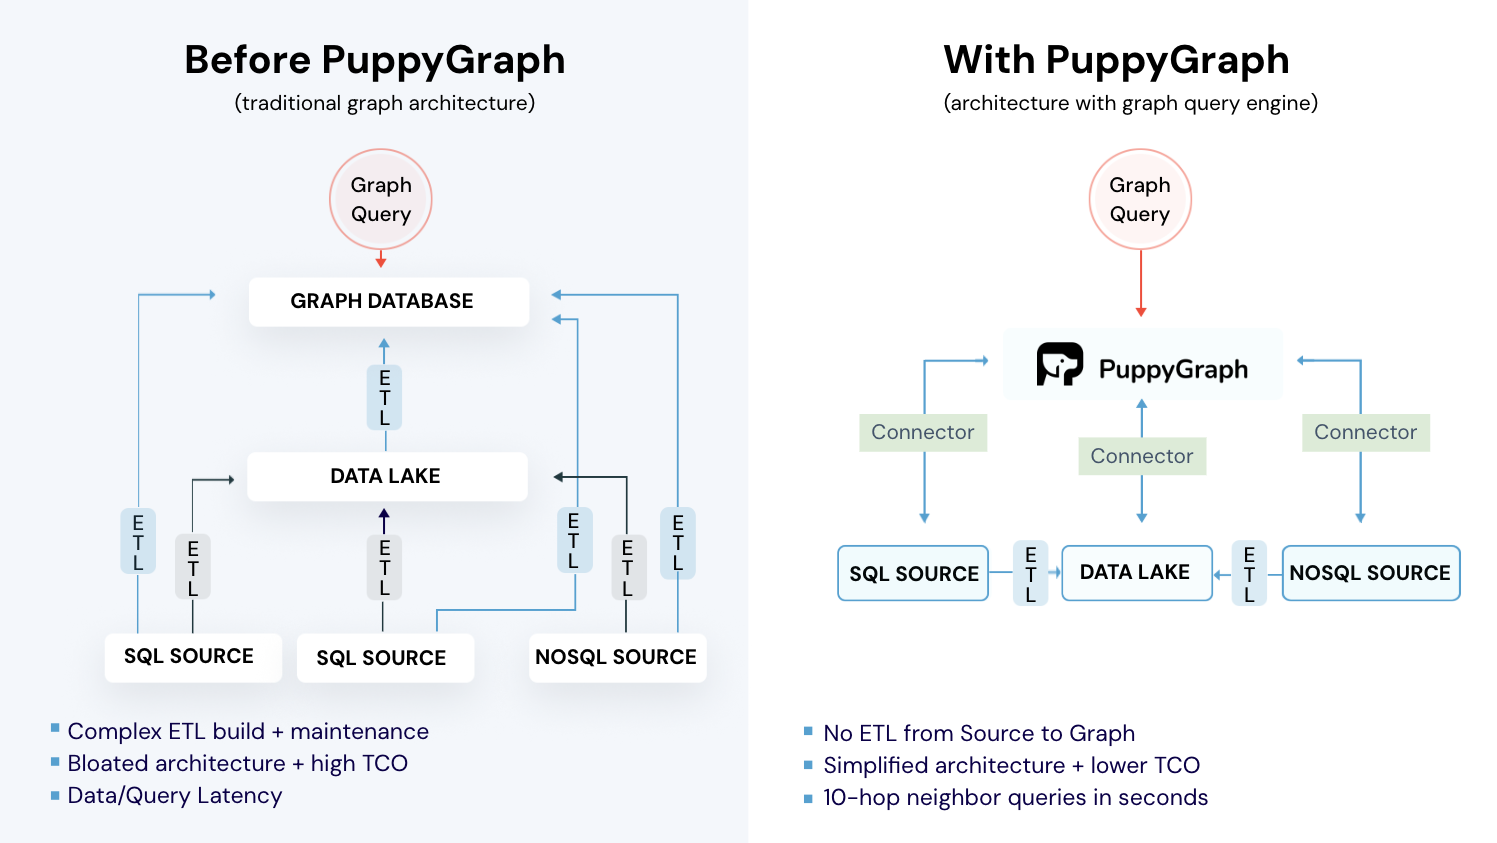
PuppyGraph provides a virtual graph layer that enables organizations to build taxonomy graphs directly on top of existing data sources without duplicating data. Instead of ingesting information into a separate graph database, PuppyGraph connects to relational databases, lakehouses, and analytical storage systems. This approach allows teams to create taxonomy-based graph views while maintaining data freshness and minimizing infrastructure overhead.
Key benefits include:
- Dynamic modeling of hierarchical and associative relationships: Organizations can define taxonomy nodes and edges using virtual schemas, enabling rapid experimentation and iteration.
- Flexible updates without migrations: Since the underlying data remains in its original systems, teams can update taxonomy structures without triggering complex migration or synchronization processes, which is valuable for evolving domains where classification schemes change frequently.
- Simplified query workflows: Analysts can explore taxonomy graphs using graph query languages and traversal queries, bridging the gap between structured analytics and graph-based exploration.
- Integration with modern data platforms and governance frameworks: PuppyGraph supports access controls, data lineage tracking, and performance monitoring while working with taxonomy graphs, allowing semantic graph layers to be introduced without disrupting existing infrastructure.
PuppyGraph is the first and only real time, zero-ETL graph query engine in the market, empowering data teams to query existing relational data stores as a unified graph model that can be deployed in under 10 minutes, bypassing traditional graph databases' cost, latency, and maintenance hurdles.
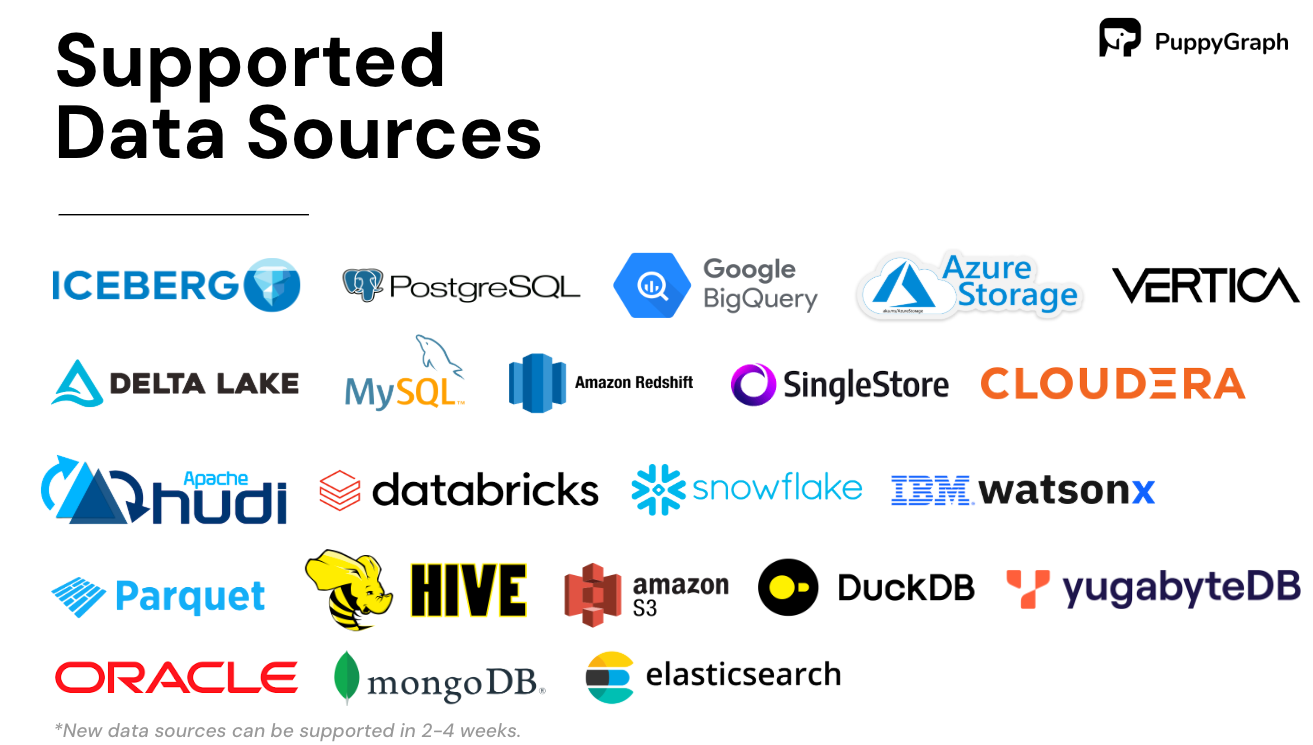
It seamlessly integrates with data lakes like Apache Iceberg, Apache Hudi, and Delta Lake, as well as databases including MySQL, PostgreSQL, and DuckDB, so you can query across multiple sources simultaneously.
Key PuppyGraph capabilities include:
- Zero ETL: PuppyGraph runs as a query engine on your existing relational databases and lakes. Skip pipeline builds, reduce fragility, and start querying as a graph in minutes.
- No Data Duplication: Query your data in place, eliminating the need to copy large datasets into a separate graph database. This ensures data consistency and leverages existing data access controls.
- Real Time Analysis: By querying live source data, analyses reflect the current state of the environment, mitigating the problem of relying on static, potentially outdated graph snapshots. PuppyGraph users report 6-hop queries across billions of edges in less than 3 seconds.
- Scalable Performance: PuppyGraph’s distributed compute engine scales with your cluster size. Run petabyte-scale workloads and deep traversals like 10-hop neighbors, and get answers back in seconds. This exceptional query performance is achieved through the use of parallel processing and vectorized evaluation technology.
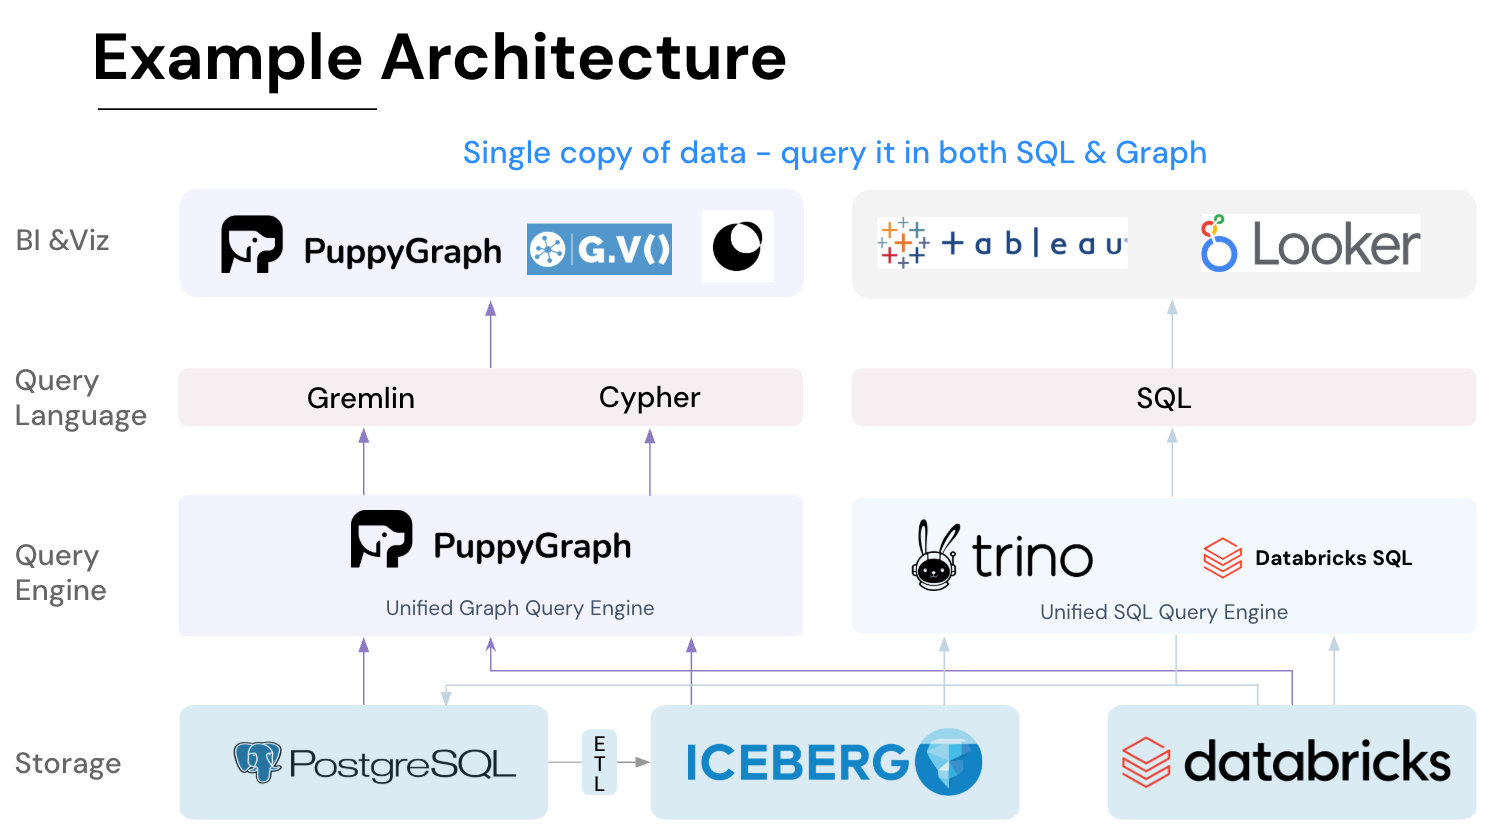
- Best of SQL and Graph: Because PuppyGraph queries your data in place, teams can use their existing SQL engines for tabular workloads and PuppyGraph for relationship-heavy analysis, all on the same source tables. No need to force every use case through a graph database or retrain teams on a new query language.
- Lower Total Cost of Ownership: Graph databases make you pay twice — once for pipelines, duplicated storage, and parallel governance, and again for the high-memory hardware needed to make them fast. PuppyGraph removes both costs by querying your lake directly with zero ETL and no second system to maintain. No massive RAM bills, no duplicated ACLs, and no extra infrastructure to secure.
- Flexible and Iterative Modeling: Using metadata driven schemas allows creating multiple graph views from the same underlying data. Models can be iterated upon quickly without rebuilding data pipelines, supporting agile analysis workflows.
- Standard Querying and Visualization: Support for standard graph query languages (openCypher, Gremlin) and integrated visualization tools helps analysts explore relationships intuitively and effectively.
- Proven at Enterprise Scale: PuppyGraph is already used by half of the top 20 cybersecurity companies, as well as engineering-driven enterprises like AMD and Coinbase. Whether it’s multi-hop security reasoning, asset intelligence, or deep relationship queries across massive datasets, these teams trust PuppyGraph to replace slow ETL pipelines and complex graph stacks with a simpler, faster architecture.
As data grows more complex, the most valuable insights often lie in how entities relate. PuppyGraph brings those insights to the surface, whether you’re modeling organizational networks, social introductions, fraud and cybersecurity graphs, or GraphRAG pipelines that trace knowledge provenance.

Deployment is simple: download the free Docker image, connect PuppyGraph to your existing data stores, define graph schemas, and start querying. PuppyGraph can be deployed via Docker, AWS AMI, GCP Marketplace, or within a VPC or data center for full data control.
Conclusion
Taxonomy graphs represent a powerful evolution of traditional classification systems, combining hierarchical structures with flexible, graph-based relationships. By enabling multi-path navigation, associative connections, and continuous evolution, they allow organizations to model complex domains more accurately, reduce ambiguity, and support advanced analytics and semantic exploration. Compared to ontologies or knowledge graphs, taxonomy graphs focus on bridging structured classification with contextual relationships, providing both clarity and adaptability.
PuppyGraph makes building and maintaining taxonomy graphs practical at scale. By creating virtual graph layers directly on existing data sources, organizations can achieve real-time insights, avoid data duplication, and iterate rapidly without complex ETL pipelines. This approach empowers teams to explore relationships across diverse datasets efficiently, supporting applications from semantic search to fraud detection, social networks, and enterprise knowledge management.
Explore the forever-free PuppyGraph Developer Edition, or book a demo to see it in action.

Hao Wu is a Software Engineer with a strong foundation in computer science and algorithms. He earned his Bachelor’s degree in Computer Science from Fudan University and a Master’s degree from George Washington University, where he focused on graph databases.

Get started with PuppyGraph!


Developer Edition
- Forever free
- Single noded
- Designed for proving your ideas
- Available via Docker install
Enterprise Edition
- 30-day free trial with full features
- Everything in developer edition & enterprise features
- Designed for production
- Available via AWS AMI & Docker install