

Telemetry Analysis: Understanding Data Collection & Insights
Telemetry analysis has become an indispensable part of how modern systems are monitored, diagnosed, and optimized. In a world where complex systems, from cloud applications to connected vehicles, generate mountains of data, being able to collect and interpret real-time telemetry allows engineers and decision-makers to act swiftly. By examining data streams from sensors, software logs, and network sources, organizations can understand performance patterns, detect anomalies, and prevent failures before they escalate. This article explores the core concepts of telemetry analysis, how it works, key applications, tools involved, benefits, challenges, and best practices for effective implementation.
What is Telemetry Analysis
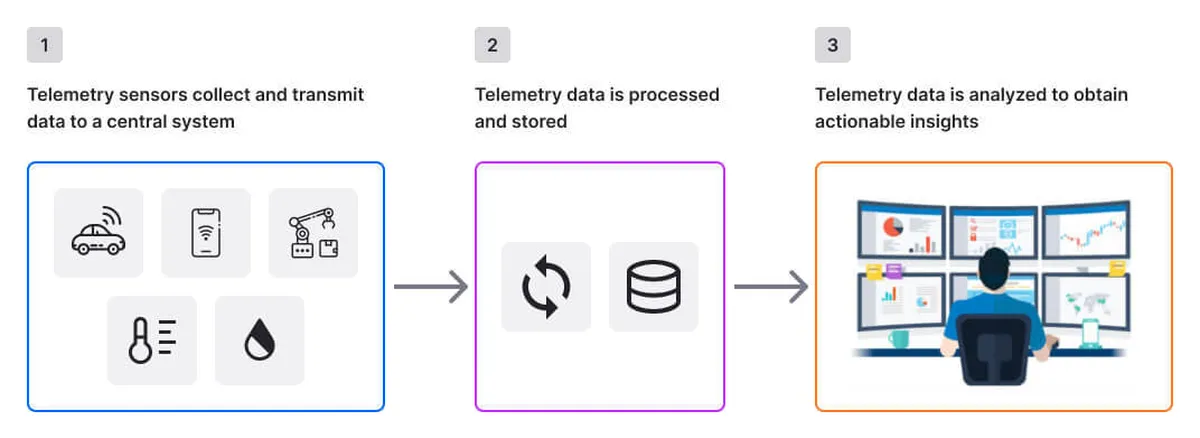
Telemetry analysis refers to the systematic collection, transmission, processing, and interpretation of remote data. At its core, it transforms raw signals from distant or distributed sources into actionable insights. Initially used in aerospace and engineering fields, telemetry now spans software systems, telecommunications, industrial IoT, and even healthcare devices. The process begins with sensors or software agents capturing measurements such as CPU utilization, memory usage, temperature, speed, or error rates. These streams are then transmitted, often over networks or satellite links, to centralized platforms that aggregate and prepare the data for analysis. Telemetry analysis empowers teams to observe systems without direct physical access.
In its analytics phase, telemetry data is filtered, normalized, and correlated to reveal trends, anomalies, and patterns that human operators would otherwise overlook. For example, a sudden spike in network latency across distributed microservices might indicate an upstream dependency issue. In contrast, gradual increases in storage I/O could signal impending capacity problems. Traditional monitoring contrasts with telemetry analysis in that the latter is proactive, predictive, and insight-driven rather than reactive. Modern telemetry platforms incorporate machine learning to detect subtle patterns and automate alerting mechanisms. Ultimately, telemetry analysis serves as the eyes and ears for complex systems.
How Telemetry Works
Telemetry involves a pipeline of activities that start with data generation and end with insight delivery. At the source are sensors or software probes embedded into systems that measure specific metrics. These can be physical sensors in industrial equipment or internal instrumentation in software applications. Once data is captured, it is packaged into a format suitable for transport. This packaging ensures that contextual information, such as timestamps, identifiers, and measurement units, travel with the raw values. Telemetry data is typically transmitted using standard protocols like HTTP, MQTT, or proprietary communication mechanisms tailored for bandwidth efficiency.
After transmission, the data lands in ingestion endpoints, often hosted on cloud platforms or on-premise servers. Here, it enters a processing layer where it can be batched, parsed, and enriched with metadata. Enrichment could include mapping sensor IDs to device locations or associating application traces with user sessions. Following processing, storage systems like time-series databases or data lakes archive the telemetry for retrieval. Analysts and automated systems then query the stored data to generate dashboards, alerts, and reports. The visualization layer presents insights through graphs and interactive interfaces, making patterns easier to comprehend for stakeholders.
As telemetry systems scale beyond simple data collection and storage, architectural decisions become increasingly important. Many modern telemetry pipelines incorporate edge computing, where data is filtered, aggregated, or partially analyzed close to the source before being transmitted. This reduces network bandwidth usage and minimizes latency for time-sensitive use cases. In parallel, stream-processing frameworks enable continuous, event-driven analysis of telemetry data, allowing organizations to respond to anomalies in seconds rather than minutes. Together, edge processing and streaming analytics help maintain responsiveness and cost efficiency as telemetry volumes grow.
The entire workflow must be resilient to interruptions, network latency, and data loss. Techniques like buffering, edge processing, and compression ensure that even when networks are unstable, telemetry data eventually reaches its destination. The end goal of telemetry is to offer an end-to-end feedback loop: from data capture to strategic decision-making, enhancing operational visibility and response times.
Key Applications of Telemetry Analysis
Telemetry in Software Infrastructure and Cloud-Native Systems
Telemetry analysis plays a foundational role in modern software infrastructure, particularly within cloud-native and distributed systems. In environments built on microservices, containers, and dynamic orchestration platforms, telemetry data, such as logs, metrics, and traces, forms the backbone of observability. By continuously collecting performance indicators including latency, throughput, error rates, and resource utilization, telemetry enables engineers to gain real-time visibility into system behavior across complex service topologies.
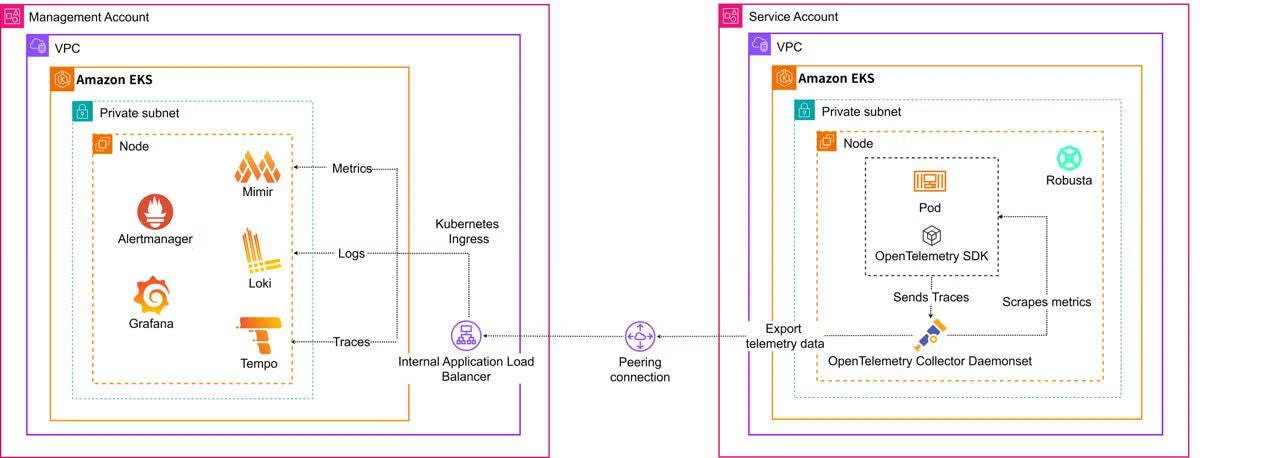
As shown in the figure, application services and infrastructure components are instrumented to emit telemetry signals at runtime. These signals are collected by telemetry agents or OpenTelemetry-compatible collectors, which perform aggregation, filtering, and transformation before exporting the data to centralized backend systems. Metrics are typically stored in time-series databases, logs in centralized logging systems, and traces in distributed tracing backends. Visualization and alerting tools consume this unified telemetry data to provide dashboards, real-time monitoring, and automated alerts, enabling operators to correlate events across multiple services and infrastructure layers.
Building on this architecture, observability platforms leverage telemetry analysis to monitor service-level objectives (SLOs), detect anomalies, and identify performance bottlenecks during traffic spikes or failure scenarios. Distributed tracing allows teams to follow individual requests as they propagate through multiple services, helping pinpoint root causes of latency or failures. Metrics-driven alerting supports proactive incident response, while historical telemetry data is used for capacity planning and cost optimization. As software infrastructure becomes increasingly dynamic and automated, telemetry analysis is essential for maintaining reliability, scalability, and user experience.
Telemetry in IoT Systems
Telemetry analysis is also widely applied in Internet of Things (IoT) environments, where large volumes of sensor-generated data are continuously transmitted for monitoring and control purposes. Among these applications, healthcare stands out as a particularly impactful and well-developed use case.
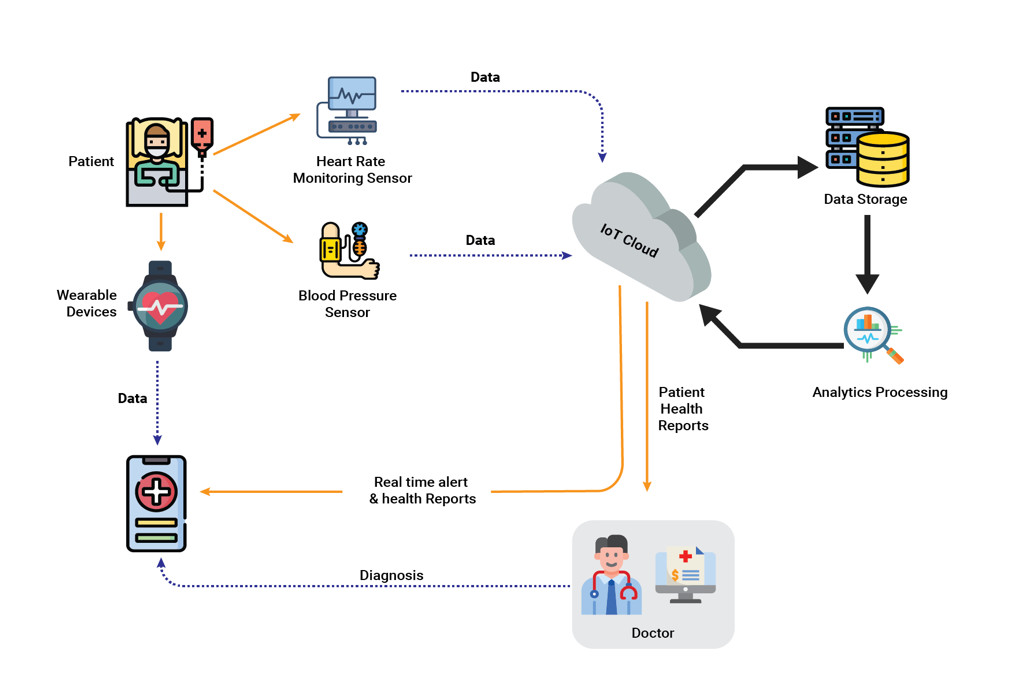
In IoT-driven healthcare systems, wearable devices and biomedical sensors collect vital signs such as heart rate, blood pressure, oxygen saturation, and activity levels. This telemetry data is transmitted through IoT gateways and cloud platforms, where real-time analysis enables anomaly detection, automated alerts, and trend analysis. Clinicians can monitor patients remotely, identify early warning signs of health deterioration, and make data-driven decisions without requiring frequent in-person visits. This approach supports proactive and preventive care models, improves patient outcomes, and reduces the burden on healthcare facilities. Telemetry-based remote patient monitoring is especially valuable for managing chronic diseases and supporting telehealth services.
Beyond healthcare, telemetry analysis is broadly used across other IoT scenarios. In industrial IoT, sensor telemetry enables predictive maintenance by identifying abnormal vibration or temperature patterns in machinery. In transportation and connected vehicles, telemetry supports fleet tracking, route optimization, and fuel efficiency analysis. Smart cities rely on telemetry from traffic systems, energy grids, and environmental sensors to optimize urban infrastructure and resource usage. Although these domains differ in scale and regulatory requirements, they all rely on telemetry analysis to transform continuous data streams into actionable insights.
Telemetry Data Sources and Tools
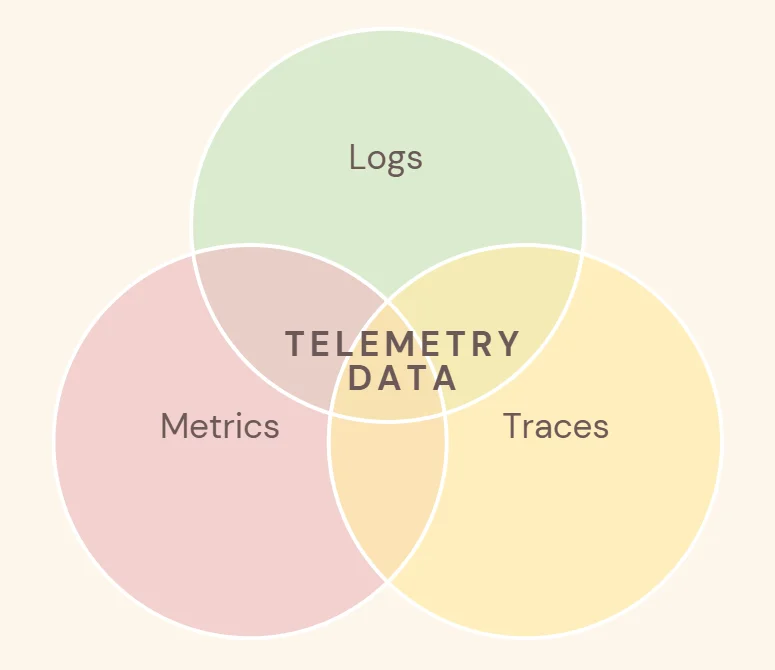
Telemetry data originates from an array of sources, each suited to capture particular dimensions of system behavior. For software systems, logs, traces, and metrics constitute primary telemetry sources. Logs provide detailed records of events within applications; traces follow the execution path of requests through distributed systems; metrics quantify numerical measurements like throughput or error rates. Physical systems, on the other hand, rely on sensors that measure environmental or mechanical conditions such as vibration, temperature, or pressure. These hardware devices often connect via edge gateways that preprocess data before forwarding it for analysis.
A variety of tools and platforms support telemetry collection and processing. Open-source technologies like Prometheus specialize in time-series metric collection and alerting for cloud-native applications. Grafana complements this with rich visualization dashboards. For distributed tracing, tools like Jaeger and Zipkin help visualize request flows across microservices. In addition to open-source tools, commercial observability platforms such as Datadog provide unified collection and analysis of logs, metrics, and traces through managed, cloud-based services. On the commercial side, observability suites from major cloud providers consolidate logs, metrics, and traces in unified dashboards. IoT platforms often include built-in telemetry pipelines that manage millions of devices and scale elastically with demand.
Data storage plays a crucial role too. Time-series databases such as InfluxDB or TimescaleDB retain high-resolution telemetry for analytical queries. Meanwhile, big data lakes based on Hadoop or cloud object storage hold vast amounts of raw and enriched telemetry for long-term trend analysis. Integration with analytics and machine learning frameworks allows teams to uncover deeper insights, such as predicting future system load based on historical patterns. The right combination of sources and tools depends on industry needs, volume of data, and real-time versus historical analysis priorities.
Benefits of Telemetry Analysis
One of the most significant benefits of telemetry analysis is enhanced visibility into system performance. Without telemetry, identifying the root cause of an outage or performance degradation could take hours or days. With real-time data streaming, engineers can pinpoint issues within minutes. This faster resolution directly translates to improved service reliability and customer satisfaction. Furthermore, telemetry data enables proactive maintenance. By recognizing early warning signs of equipment failure, organizations can schedule repairs before breakdowns occur, reducing unplanned downtime and maintenance costs.
Telemetry analysis also fuels optimization efforts. When teams understand how systems behave under different loads, they can tune configurations to improve efficiency. Whether adjusting server autoscaling thresholds or refining network routing policies, data-driven optimization fosters better resource utilization. In addition, telemetry supports business insights. For example, usage patterns captured through telemetry can inform product development decisions or highlight features that drive user engagement. Marketing and strategy teams can leverage this information to prioritize enhancements that align with real user behavior.
Another benefit is risk mitigation. Telemetry helps detect security anomalies such as unusual access patterns or data exfiltration attempts. Security teams can integrate telemetry feeds into threat detection systems, enabling faster responses to potential breaches. For compliance-heavy industries, telemetry also assists with audit trails and accountability by maintaining detailed records of system activity. Overall, telemetry analysis enhances operational intelligence, bridges communication across teams, and supports continuous improvement within organizations.
Challenges in Telemetry Analysis
Despite its advantages, implementing telemetry analysis is not without challenges. One of the primary hurdles is managing the sheer volume of data generated by modern systems. High-frequency metrics, verbose logs, and high-cardinality traces can quickly overwhelm storage and processing pipelines. Without careful planning and data lifecycle policies, telemetry systems can become costly and difficult to scale. Furthermore, ensuring data quality and consistency across disparate sources poses a persistent challenge. Missing timestamps, inconsistent naming conventions, or incomplete records can degrade the accuracy of analytical insights.
Real-time processing presents another significant difficulty. Many telemetry applications require near-instantaneous analysis to trigger alerts or automated responses. Building a responsive processing pipeline demands robust infrastructure and efficient stream processing technologies. Organizations must also consider the latency added by data transmission and enrichment steps. Moreover, integrating telemetry from legacy systems or across hybrid environments (on-premise and cloud) often involves reconciling incompatible formats and protocols.
Privacy and security concerns further complicate telemetry efforts. Sensitive data captured during telemetry collection must be protected both in transit and at rest to comply with regulations such as GDPR or HIPAA. Teams must implement encryption, access controls, and anonymization techniques to safeguard personal information.
Operational and organizational factors can also limit the effectiveness of telemetry. Effective analysis often requires collaboration across multiple teams, including engineering, operations, security, and business units. Disparate priorities and knowledge gaps can hinder the adoption of standardized practices or instrumentation. Additionally, the maintenance of telemetry infrastructure itself can become a resource-intensive task. Monitoring pipelines, updating agents, and tuning alert rules demand ongoing attention, which can divert focus from strategic analysis. Without a culture that values data-driven decision-making, telemetry efforts may be underutilized or misinterpreted, reducing the return on investment. Ensuring that teams are trained, processes are clearly defined, and responsibilities are assigned is therefore crucial to realizing the full potential of telemetry insights.
Lastly, interpreting telemetry data requires expertise. Without trained analysts or intuitive tools, organizations may struggle to extract meaningful insights from raw data streams, limiting the potential value of telemetry investments.
How to Do Effective Telemetry Analysis
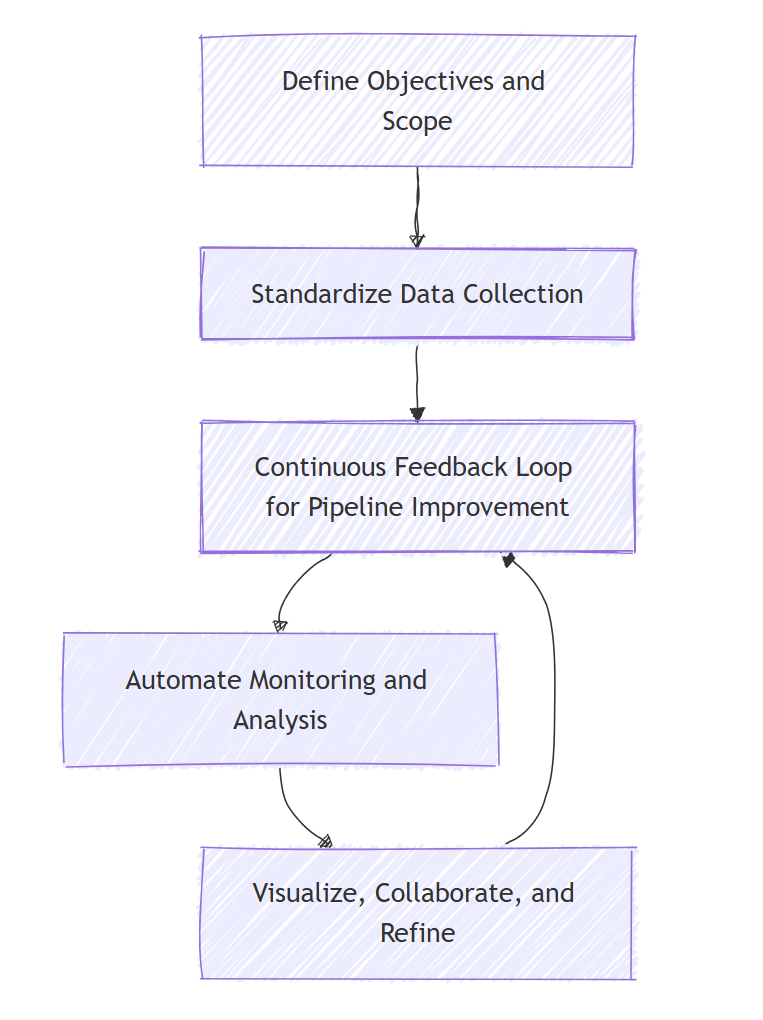
To gain actionable insights from telemetry data, organizations should follow a structured approach. The five steps below outline how to collect, process, and analyze telemetry effectively:
Step1: Define Objectives and Scope
Clearly identify what questions telemetry should answer, such as detecting anomalies, optimizing performance, or supporting predictive maintenance. This guides which data sources, metrics, and tools to use. Early objective definition ensures telemetry aligns with business and technical goals and prevents collecting unnecessary data.
Step2: Standardize Data Collection
Implement consistent data models, naming conventions, and instrumentation practices across teams. Early integration of telemetry into system design avoids retrofitting later and ensures data can be meaningfully compared, correlated, and analyzed across different subsystems.
Step3: Build a Robust Telemetry Pipeline
Design a pipeline that handles ingestion, storage, and retrieval efficiently. Use scalable cloud services or distributed frameworks to manage high-volume spikes. Apply retention policies to balance analytical needs and cost, archiving older telemetry in lower-cost storage when appropriate.
Step4: Automate Monitoring and Analysis
Incorporate automated alerting, anomaly detection, and analytical rules to proactively surface issues. Automation reduces manual monitoring, improves responsiveness, and allows teams to focus on interpreting insights rather than just collecting data.
Step5: Visualize, Collaborate, and Refine
Create custom dashboards to highlight key performance indicators and enable stakeholders to assess system health at a glance. Review telemetry collaboratively across teams, contextualize trends with historical comparisons, and continuously refine telemetry strategies as systems evolve.
Telemetry Analysis with PuppyGraph for relationship-driven insights
As telemetry analysis practices mature, many organizations become highly proficient at collecting, storing, and visualizing vast amounts of metrics, logs, and traces. However, as system scale and complexity continue to grow, a new limitation often emerges: the most critical insights no longer reside in individual data points, but in the relationships between entities.
For example, a performance incident may not originate from a single service, but from a multi-hop dependency chain involving configuration drift, permission changes, or resource contention. Likewise, the root cause of a security incident may span users, hosts, network flows, and cloud resources across several layers of interaction.
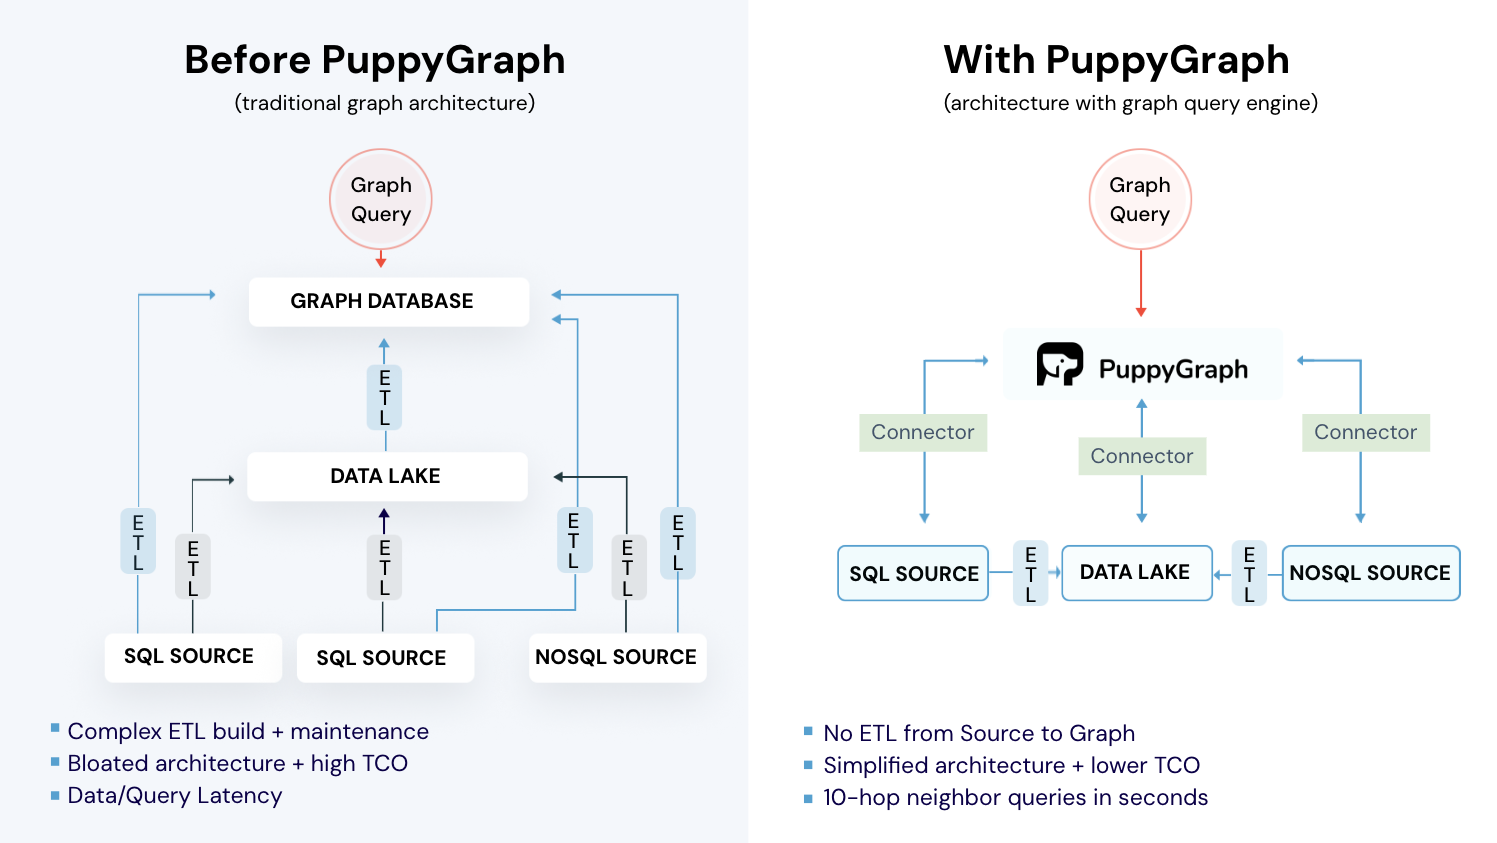
Traditional telemetry and observability tools excel at time-series analysis and alerting, but they often struggle with cross-source correlation, multi-hop relationship modeling, and real-time graph-style analysis. To overcome this, teams frequently resort to building complex ETL pipelines that copy telemetry and operational data into dedicated graph databases. This approach introduces additional latency, increases operational overhead, and undermines the real-time nature that telemetry analysis is meant to provide.
In this context, there is a growing need for a solution that can perform real-time, relationship-centric analysis directly on existing telemetry and operational data, without data duplication or pipeline complexity. This is where PuppyGraph comes into play.
A Telemetry Use Case: Graph-Based Service Dependency Analysis
In a microservices environment, distributed tracing data already captures how requests flow between services, including source service, destination service, latency, and error status. As systems increasingly incorporate AI agents, execution paths become more dynamic and data-dependent: a single request may trigger different sequences of model calls, tool invocations, or even other agents at runtime, forming a continuously evolving execution graph rather than a fixed call topology. Graph-based analysis on the data lake with PuppyGraph is especially suited to capture these evolving dependencies.
More specifically, consider each service as a Service vertex, while each trace span that records an inter-service call is mapped to a CALLS edge between services, carrying attributes such as avg_latency_ms, error_rate, and request_count. This graph model is defined declaratively through PuppyGraph’s schema file, allowing teams to turn raw trace tables into a continuously updated service dependency graph that reflects real runtime behavior.
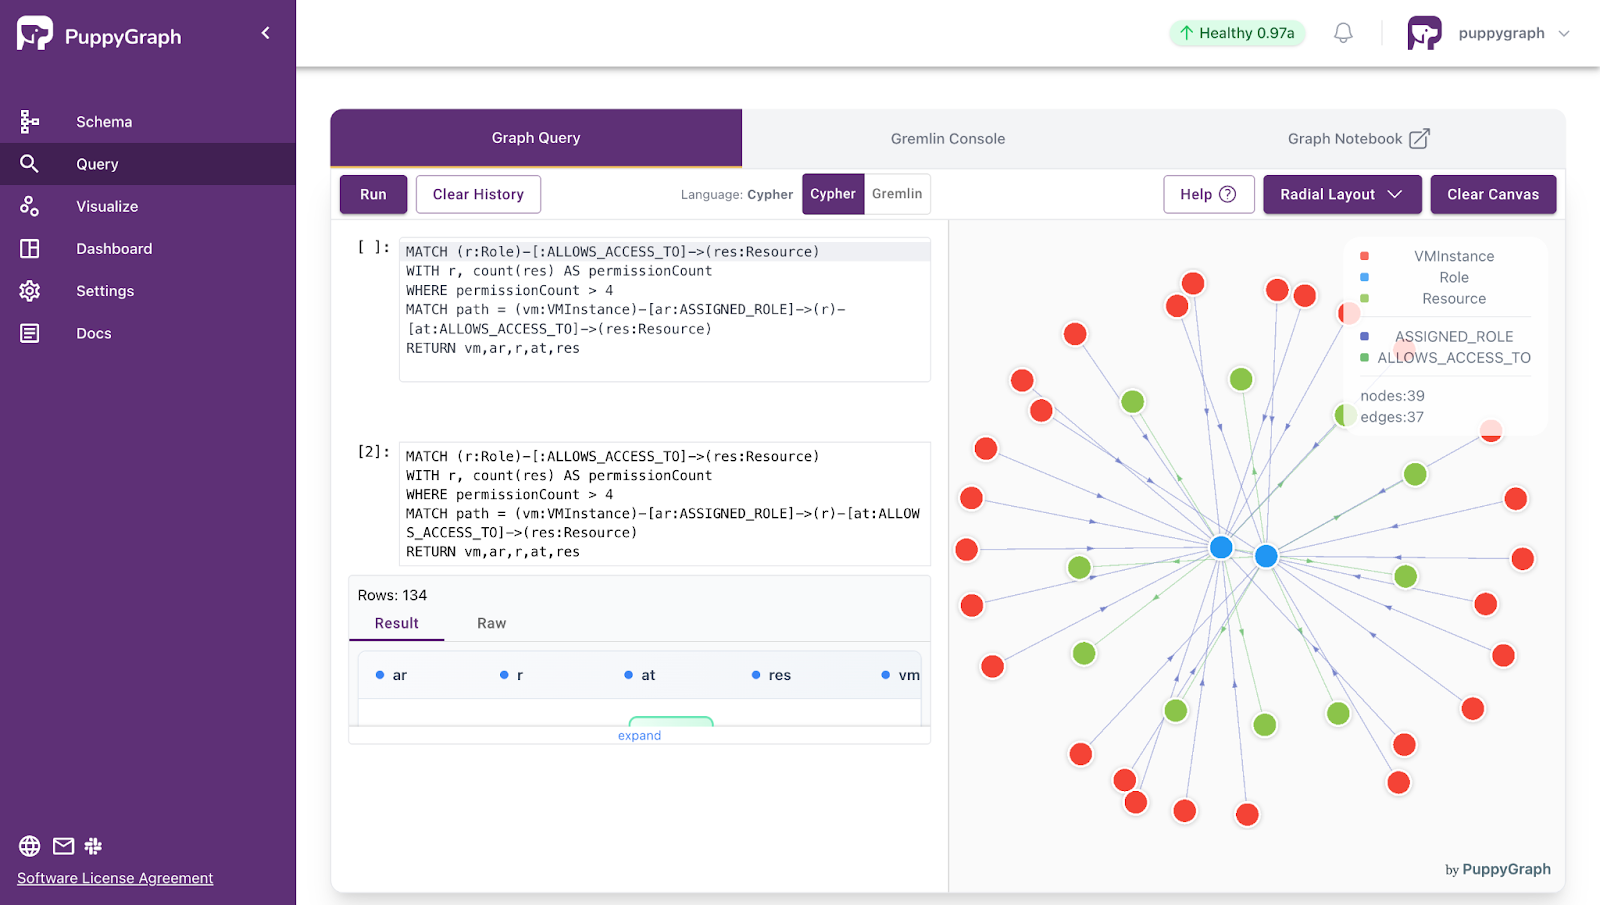
Once the graph is in place, engineers can run relationship-centric queries to analyze performance issues that span multiple services. For example, when a downstream API shows elevated latency, the following Cypher query identifies all upstream services at any distance whose calls consistently exceed a latency threshold:
MATCH path = (upstream:Service)-[:CALLS*]->(target:Service {name: "checkout-api"})
WHERE ALL(r IN relationships(path) WHERE r.avg_latency_ms > 200)
RETURN upstream.name AS service,
       max(r.avg_latency_ms) AS max_latency
ORDER BY max_latency DESC
This type of unbounded, multi-hop traversal is difficult to express with traditional telemetry tools, especially when execution paths are dynamic. With PuppyGraph, the query executes in seconds, enabling fast root cause analysis by exposing how latency propagates through real, runtime-derived service dependencies rather than examining metrics in isolation.
What is PuppyGraph

PuppyGraph is the first and only real time, zero-ETL graph query engine in the market, empowering data teams to query existing relational data stores as a unified graph model that can be deployed in under 10 minutes, bypassing traditional graph databases' cost, latency, and maintenance hurdles.
It seamlessly integrates with data lakes like Apache Iceberg, Apache Hudi, and Delta Lake, as well as databases including MySQL, PostgreSQL, and DuckDB, so you can query across multiple sources simultaneously.

Key PuppyGraph capabilities include:
- Zero ETL: PuppyGraph runs as a query engine on your existing relational databases and lakes. Skip pipeline builds, reduce fragility, and start querying as a graph in minutes.
- No Data Duplication: Query your data in place, eliminating the need to copy large datasets into a separate graph database. This ensures data consistency and leverages existing data access controls.
- Real Time Analysis: By querying live source data, analyses reflect the current state of the environment, mitigating the problem of relying on static, potentially outdated graph snapshots. PuppyGraph users report 6-hop queries across billions of edges in less than 3 seconds.
- Scalable Performance: PuppyGraph’s distributed compute engine scales with your cluster size. Run petabyte-scale workloads and deep traversals like 10-hop neighbors, and get answers back in seconds. This exceptional query performance is achieved through the use of parallel processing and vectorized evaluation technology.
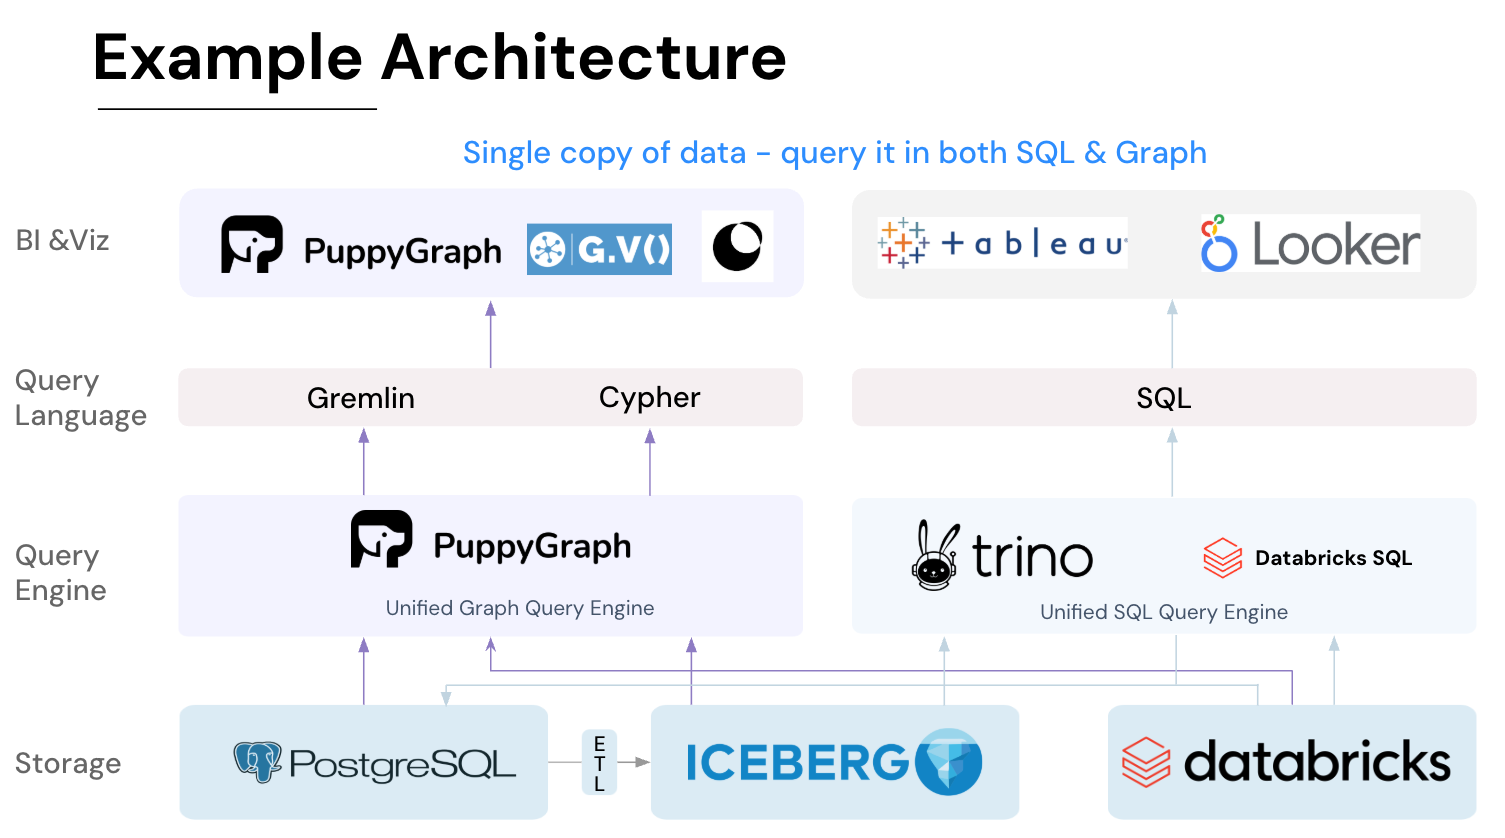
- Best of SQL and Graph: Because PuppyGraph queries your data in place, teams can use their existing SQL engines for tabular workloads and PuppyGraph for relationship-heavy analysis, all on the same source tables. No need to force every use case through a graph database or retrain teams on a new query language.
- Lower Total Cost of Ownership: Graph databases make you pay twice — once for pipelines, duplicated storage, and parallel governance, and again for the high-memory hardware needed to make them fast. PuppyGraph removes both costs by querying your lake directly with zero ETL and no second system to maintain. No massive RAM bills, no duplicated ACLs, and no extra infrastructure to secure.
- Flexible and Iterative Modeling: Using metadata driven schemas allows creating multiple graph views from the same underlying data. Models can be iterated upon quickly without rebuilding data pipelines, supporting agile analysis workflows.
- Standard Querying and Visualization: Support for standard graph query languages (openCypher, Gremlin) and integrated visualization tools helps analysts explore relationships intuitively and effectively.
- Proven at Enterprise Scale: PuppyGraph is already used by half of the top 20 cybersecurity companies, as well as engineering-driven enterprises like AMD and Coinbase. Whether it’s multi-hop security reasoning, asset intelligence, or deep relationship queries across massive datasets, these teams trust PuppyGraph to replace slow ETL pipelines and complex graph stacks with a simpler, faster architecture.


As data grows more complex, the most valuable insights often lie in how entities relate. PuppyGraph brings those insights to the surface, whether you’re modeling organizational networks, social introductions, fraud and cybersecurity graphs, or GraphRAG pipelines that trace knowledge provenance.
Deployment is simple: download the free Docker image, connect PuppyGraph to your existing data stores, define graph schemas, and start querying. PuppyGraph can be deployed via Docker, AWS AMI, GCP Marketplace, or within a VPC or data center for full data control.
Conclusion
Telemetry analysis has become essential for understanding and managing complex systems, from cloud-native applications to IoT networks. By systematically collecting, processing, and interpreting real-time data, organizations gain actionable insights that improve performance, detect anomalies, and prevent failures. Modern telemetry extends beyond traditional monitoring by enabling predictive, proactive, and relationship-driven analysis, providing visibility across services, devices, and networks.
PuppyGraph takes telemetry a step further by allowing real-time, multi-hop, graph-based analysis directly on existing data sources without ETL or duplication. This approach uncovers hidden dependencies, accelerates root-cause analysis, and supports scalable, enterprise-grade insights. By combining real-time observability with relationship-centric querying, organizations can optimize operations, enhance reliability, and make informed decisions faster, unlocking the full potential of their telemetry data.
Explore the forever-free PuppyGraph Developer Edition, or book a demo to see it in action.

Hao Wu is a Software Engineer with a strong foundation in computer science and algorithms. He earned his Bachelor’s degree in Computer Science from Fudan University and a Master’s degree from George Washington University, where he focused on graph databases.

Get started with PuppyGraph!


Developer Edition
- Forever free
- Single noded
- Designed for proving your ideas
- Available via Docker install
Enterprise Edition
- 30-day free trial with full features
- Everything in developer edition & enterprise features
- Designed for production
- Available via AWS AMI & Docker install