


What Is Link Analysis?
A fraud analyst pulling up a suspicious account sees a single row: a name, a balance, an open date, nothing that looks wrong. The account only becomes interesting once it sits next to the eleven others that share its device fingerprint and opened within the same ten-minute window, and a row-by-row review has no way to surface that. The finding was never a property of any one account. It was a property of the connections between them, and those connections do not show up in a table scan.
Link analysis is the practice built around exactly that gap: mapping and querying the connections between entities so that a pattern spread across many records becomes visible as a single structure. This post covers what link analysis is and where it came from, how entities and relationships get modeled, what link visualization adds, how the process runs end to end, its core techniques, why it matters, and the benefits and limits of working this way.
What is link analysis?
Link analysis is a data-analysis technique that examines the relationships, or links, between entities such as people, accounts, devices, organizations, and transactions, to surface patterns and anomalies not visible when each entity is examined on its own. The unit of analysis is the connection rather than the record: not what an account looks like, but who or what it is tied to, through what kind of link, and how strongly.
The term carries a specific, investigative connotation that sets it apart from graph analytics or network science more broadly, which tend to study a network's structure as a whole, its density, its clusters, its typical path length. Link analysis usually starts from a question about a specific entity or event: who is connected to this account, this phone number, this compromised host, and does that connection reach somewhere it should not. Graph theory supplies the structures, nodes, edges, paths, and link analysis is the discipline of using them to answer a concrete investigative question.
It is also distinct from a database join, which returns rows sharing a key once, for the query that asked. Link analysis is concerned with what emerges when connections are followed repeatedly, the chains and shared attributes that appear only after several hops, which is why the practice took hold first in criminal investigation and intelligence analysis, where following a network of associations by hand was already routine.
The evolution of link analysis
Link analysis predates the term graph database by decades, and its early history is investigative rather than computational. Law-enforcement agencies were formally evaluating link-analysis procedures for organized-crime investigations by the mid-1970s: a 1975 paper in Human Factors documents procedures for portraying relationships among suspected criminals from investigation reports, informant tips, and financial records, to determine an organization's structure. The output was a hand-drawn link chart: names as nodes, lines standing in for calls, meetings, or shared property.
Academic social-network analysis formalized what those charts did intuitively. Malcolm Sparrow's 1991 paper in Social Networks argued that centrality measures could identify the individuals whose removal would most disrupt a criminal network, while naming the problems that make criminal networks hard to analyze this way: they are large, incompletely observed, fuzzy at the edges, and constantly changing.
Commercial tooling followed. i2 Limited, founded in Cambridge in 1990, built Analyst's Notebook around an entity-link-property model that became a law-enforcement, defense, and corporate-fraud standard; IBM acquired the company in 2011, and the product line was divested to N. Harris Computer in 2022. After the September 11 attacks, financial-intelligence units scaled the same techniques up to trace terrorist financing and cross-border money flows.
The discipline's biggest public demonstration came from journalism. The Panama Papers investigation loaded 11.5 million leaked records into a graph database so reporters across dozens of countries could query the connections between people and offshore entities directly, rather than reading source documents one at a time.
What has changed since is less the underlying idea, connections as first-class data, than where the graph lives: from a wall of string and index cards, to desktop software fed by manual data extracts, to a graph database loaded through its own pipeline, and now to a graph query engine that builds the link view directly from the warehouse or lake tables the records already sit in.
Understanding entities and relationships
Every link-analysis model reduces to two building blocks. Entities are the nodes: people, organizations, accounts, devices, IP addresses, phone numbers, transactions, documents, whatever the investigation is about. Links are the edges connecting them, and in investigative work they come in two flavors that are easy to blur together.
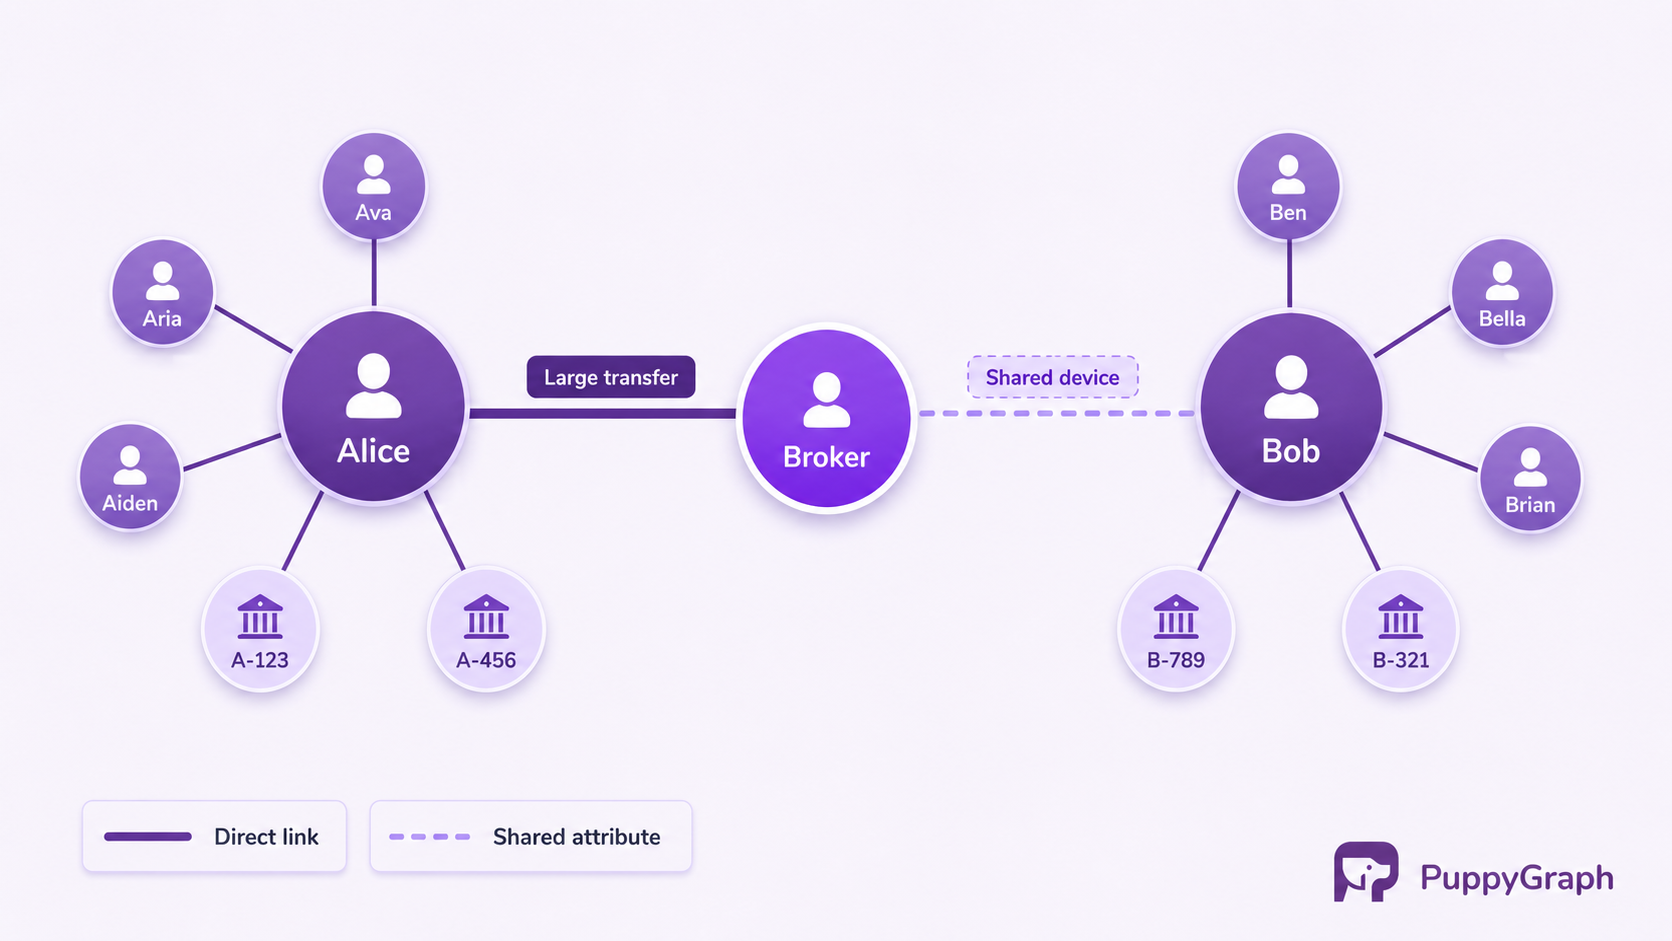
A direct link records an observed interaction: a call between two numbers, a transfer between two accounts, a login from a device to an account. A shared-attribute link is inferred rather than observed: two accounts never transact with each other, but both were opened from the same device fingerprint, or list the same mailing address. Neither account did anything to the other; the link exists because an attribute connects them, and shared-attribute links surface more rings than direct ones do, because coordinated actors go out of their way to avoid direct contact.
Links carry properties of their own: a timestamp, a direction, an amount. Because the underlying data is often incomplete or secondhand, investigative link charts frequently grade a link's evidentiary weight, a convention with real history: NATO's Admiralty Code scores source reliability from A to F and information credibility from 1 to 6, and the same instinct shows up in modern fraud scoring as a numeric link weight rather than a letter grade.
What is link visualization?
Link visualization is the rendering of a link-analysis model as a diagram, typically a node-link diagram in which entities are drawn as shapes and links as lines between them. It is worth keeping distinct from link analysis itself: the analysis is the querying and reasoning over connection data, the visualization is one way, often the most useful way, to present what that analysis found.
The convention that made link charts legible before graph databases existed is still the one modern tools follow. Node size or color typically encodes something computed about the entity, its centrality, its risk score, whether it is under active investigation. Edge thickness or color typically encodes the strength or type of a link, a thick line for a large transaction, a thin one for a single shared address. A well-drawn link chart lets a reader who has never seen the underlying data pick out the hub entity, the tight cluster, and the outlier at a glance, which is the point: the chart is meant to be read by a supervisor, a prosecutor, or a compliance officer who was never going to query the raw tables themselves.
Tooling for this ranges from general-purpose graph visualization libraries to purpose-built investigative platforms such as Analyst's Notebook, Palantir Gotham, and Maltego, each layering case-management and collaboration features on top of the same node-link primitive.
How link analysis works
Link analysis runs as a pipeline from raw records to an answer, whether the output is a chart, a query result, or an alert.
Data collection gathers the records that might contain a connection: transaction logs, call detail records, KYC and onboarding data, communication metadata, authentication logs, external registries and watchlists. A link between two systems can only be found if both were collected.
Entity resolution decides whether the rest of the analysis is trustworthy. The same person, company, or device appears across sources under different identifiers, and treating variants as separate entities hides a ring exactly as effectively as merging two genuinely different entities invents a false one.
Modeling turns resolved records into a graph: entities become nodes, direct and shared-attribute relationships become typed, directed, weighted edges.
Querying and traversal answers the analyst's actual question: every account within three hops of a known-fraudulent one, the shortest path between two persons of interest, every cluster of five or more accounts sharing one device. Questions like these are a single traversal on a graph, where on a relational schema they are a join per hop with the depth fixed in advance.
Visualization and action renders the result as a link chart for a human reviewer, or feeds it directly into a case, an alert, or a block list.

Getting from records to a queryable graph has traditionally meant an ETL step: exporting entities and links into a dedicated graph database. PuppyGraph skips the export: it maps existing tables in a warehouse, lakehouse, or open table format such as Apache Iceberg to nodes and edges through a user-defined schema, then runs openCypher and Gremlin traversals over them in place, with no separate copy of the data to keep in sync. Analysts working fraud and investigative caseloads at companies including Coinbase, Dawn Capital, and Prevalent AI use this kind of graph layer to query the entities and links already sitting in their warehouse tables.
Link analysis techniques
Once data is modeled as entities and links, a family of techniques turns the graph into findings.
Path analysis finds the routes between two entities of interest: the shortest path, whether one is reachable from another, every path under a given number of hops. A two-hop path through a shared address reads very differently from a direct transfer, and establishing which one connects two persons of interest is often the first question an investigation needs answered.
Centrality analysis ranks entities by position rather than attributes. A degree-based measure counts direct connections; betweenness measures how often an entity sits on the shortest path between others, which is how a link chart identifies a broker moving money or information between two otherwise-separate clusters, the kind of entity Sparrow's 1991 paper argued was worth targeting to disrupt a network.
Link weighting and guilt-by-association scoring propagate risk along edges: an entity directly linked to a known-bad one inherits elevated risk that decays with distance and link strength. It is a blunt technique on its own, prone to false positives, which is why mature programs use it to prioritize review rather than to decide a case automatically.
Temporal link analysis orders links by time rather than treating the graph as a static snapshot, establishing sequence: which account was funded before it made a suspicious transfer, which device logged in before a credential was used elsewhere.
Community and cluster detection groups entities that are more densely connected internally than to the rest of the graph, without being told in advance how many groups to expect, which is how a fraud ring or a coordinated account cluster surfaces from the connection structure rather than from a rule someone wrote in advance.
A real investigation typically composes these: path analysis to confirm a connection exists, centrality and clustering to understand what surrounds it, temporal analysis to establish what happened in what order.
Why link analysis is important
The patterns link analysis exists to find are, almost by definition, invisible to methods that examine one record at a time. Fraud rings, money-laundering networks, coordinated account takeover, and insider threats are defined by their connection structure, not by any single transaction or login looking wrong in isolation. The scale of what gets missed is not small: the United Nations Office on Drugs and Crime estimated in 2011 that criminals laundered around $1.6 trillion in 2009 alone, about 2.7 percent of that year's global GDP, and the ACFE's 2024 Report to the Nations, based on 1,921 cases across 138 countries, found that tips, not automated controls, remain the largest single way occupational fraud gets detected. Both figures point at the same gap: illicit activity is structured to look unremarkable at the record level, and closing that gap takes looking at the structure instead.
The same logic extends past financial crime. Cybersecurity investigations trace an intrusion through the accounts, hosts, and privileges an attacker touched in sequence. Supply-chain risk analysis traces which vendors a disruption actually reaches. Due-diligence work traces beneficial ownership through shell companies. In each case, the record that matters is not the one being reviewed, but the one it is connected to.
Benefits of link visualization
Visualizing a link-analysis result earns its place for reasons distinct from the analysis underneath it. A query answers the question that was asked; a chart lets a reader who did not know to ask it recognize a hub, a cluster, or an outlier at a glance, which matters because the person who needs to act on a finding, a supervisor, a prosecutor, a compliance officer, is frequently not the person who ran the query.
It also speeds the investigation itself. An analyst exploring an unfamiliar network benefits from seeing what surrounds an entity before deciding which traversal to run next, so a visual overview narrows the next query rather than replacing it. And a link chart doubles as a record of the investigation's reasoning, useful in a courtroom or a suspicious-activity report in a way a list of query results is not: it shows how the analyst got from a starting entity to a conclusion.
The limits are the flip side of the strength. A chart is a snapshot of one query's result, not the network itself, and a chart drawn to make one pattern legible can bury a different one in the same data.
Challenges of link analysis
The discipline's oldest problem is still its hardest: entity resolution. Get it wrong and the rest of the analysis inherits the error; a shared device recorded three different ways hides a ring, and two unrelated people sharing a common name get merged into a network neither belongs to.
Scale is the second problem. A link chart legible at twenty nodes becomes an unreadable hairball at a few thousand, and the manual, ETL-fed workflow the discipline grew up on struggles to keep a chart current once the underlying data keeps changing after the chart was drawn. A chart built from last week's export answers a question about a network that no longer exists.
Guilt-by-association carries its own risk: a link is evidence of proximity, not of wrongdoing, and treating every connection to a flagged entity as equally suspicious produces false positives at a rate that erodes trust in the program, the same alert-fatigue failure mode security teams already know from over-broad detection rules.
There is also a governance dimension: because link analysis often infers connections a subject never disclosed, from shared attributes rather than declared relationships, programs that use it, particularly in law enforcement and intelligence, carry a responsibility to bound what gets inferred and who can see it.
Conclusion
Link analysis reframes investigation around the connection rather than the record, an idea that predates graph databases by decades but has only gotten more valuable as the entities worth investigating spread across more systems. The lineage runs from hand-drawn charts assembled from investigation reports, to purpose-built desktop software, to today's graph databases and query engines, but the underlying question has not changed: not what does this record look like, but what is it connected to, and does that connection matter.
Getting an answer still depends on the unglamorous work underneath the chart: resolving entities correctly, modeling links with the right type and weight, and keeping the graph current as the source data changes. Done well, it turns connections that were always present in the data into something an analyst can actually query and see.
Try the forever-free PuppyGraph Developer Edition and book a demo with the team to see how openCypher and Gremlin queries run over warehouse and lakehouse tables, with no graph-specific ETL, so link-analysis findings stay traceable back to the account, transaction, and log data they were built from.

Hao Wu is a Software Engineer with a strong foundation in computer science and algorithms. He earned his Bachelor’s degree in Computer Science from Fudan University and a Master’s degree from George Washington University, where he focused on graph databases.

Get started with PuppyGraph!


Developer Edition
- Forever free
- Single noded
- Designed for proving your ideas
- Available via Docker install
Enterprise Edition
- 30-day free trial with full features
- Everything in developer edition & enterprise features
- Designed for production
- Available via AWS AMI & Docker install