

Threat Intelligence Correlation: What is it?
.png)
Most security teams do not suffer from a shortage of threat intelligence. Feeds, vendor reports, ISAC bulletins, and open-source trackers deliver a steady stream of indicators, technique write-ups, and actor profiles, and in the SANS 2025 CTI Survey, 90% of organizations reported collecting external threat data. What teams suffer from is disconnection: the indicator sits in one feed, the campaign report that explains it sits in a PDF, the actor profile sits in a vendor portal, and the alert it should have contextualized sits in the SIEM. The intelligence exists; the picture does not.
Threat intelligence correlation is the practice that assembles that picture. This post explains what it is, why raw intelligence falls short without it, the types of intelligence and the artifacts it connects, how the correlation process works end to end, the role context plays in making a match meaningful, and where AI is changing the work.
What is threat intelligence correlation?
Threat intelligence correlation is the process of connecting individual pieces of threat intelligence with each other and with an organization’s own security telemetry, so that fragments which mean little alone resolve into findings worth acting on. A malicious IP from one feed, a malware hash from another, and a phishing domain from a third are three data points; correlated, they may be one campaign’s infrastructure. A registry-persistence technique described in a vendor report is background reading; correlated with an EDR detection from last Tuesday, it is evidence that the actor the report describes has already arrived.
The definition has two directions built into it. Intelligence-to-intelligence correlation relates external artifacts to each other: recognizing that indicators from different feeds share infrastructure, that two vendors’ differently named actor profiles describe the same group, that a fresh campaign reuses tooling from an older one. Intelligence-to-telemetry correlation relates external knowledge to internal evidence: matching indicators against DNS logs and proxy records, matching reported techniques against endpoint detections, matching actively exploited vulnerabilities against the asset inventory. Mature programs do both, because each direction multiplies the value of the other.
It helps to place the term among its neighbors. Enrichment annotates a single event or indicator with context (geolocation, reputation, whois) but asserts no relationship between separate artifacts. Security event correlation relates internal events to one another, turning a flood of logs into a smaller set of findings. Threat intelligence correlation sits alongside both: it works on knowledge about adversaries, connecting that knowledge internally and then anchoring it to the environment the defenders actually run.
Why raw threat intelligence isn’t enough
A subscription to good feeds is not a threat intelligence capability, for reasons that compound as volume grows.
Volume without structure. Feeds deliver large indicator sets, and the same indicator often arrives from several sources with different confidence scores, different first-seen dates, and no shared identifier. Uncorrelated, that volume is a deduplication problem, not an intelligence advantage.
Indicators decay. The lifespan of a technical indicator is short by design: attackers rotate IPs and domains cheaply, and recompiling malware changes its hash for free. David Bianco’s Pyramid of Pain formalized the point: the artifacts easiest to collect (hashes, IPs, domains) are the ones adversaries can change with the least effort, while the behaviors hardest for adversaries to abandon (their TTPs) are the hardest to reduce to a feed entry. A program that only matches raw indicators is matching the layer of the pyramid where the adversary feels no pain.
No relevance signal. A feed does not know your environment. An indicator tied to an actor that targets a different sector, exploiting software you do not run, deserves different handling than one tied to a group with a history in your industry, and nothing in the raw artifact tells you which is which.
False positives at machine scale. Blocking or alerting on every feed entry produces the same alert-fatigue spiral as untuned detection rules: benign CDN addresses and parked domains land in feeds regularly, and every stale entry that fires is analyst time spent disproving a claim nobody vetted.
The pattern across all four problems is the same. Raw intelligence is a list; usable intelligence is a structure, in which indicators attach to campaigns, campaigns to actors, actors to techniques, and all of it to the environment being defended. Correlation is the work of building that structure, which is why it, and not collection, is where an intelligence program’s value is decided.
Understanding the different types of threat intelligence
Threat intelligence can be sorted by audience and altitude: strategic, tactical, operational, and technical. The boundaries blur in practice (tactical and technical in particular are often merged), but the taxonomy is useful because each type answers a different question and ages at a different rate.
Strategic intelligence addresses leadership: which threat actors target the organization’s sector and geography, what motivates them, how the risk landscape is shifting. It is the slowest-moving type and shapes investment and policy rather than daily operations.
Tactical intelligence describes how adversaries operate: their tactics, techniques, and procedures. This is the layer where MITRE ATT&CK serves as the shared vocabulary; the SANS 2025 CTI Survey found 86% of CTI teams use ATT&CK. Detection engineers and threat hunters consume tactical intelligence to decide what behavior to look for, and it stays relevant for as long as the adversary keeps the behavior.
Operational intelligence covers specific campaigns and imminent activity: the infrastructure an actor is staging, the sector it is currently phishing, the vulnerability it began exploiting this week. It is time-sensitive and feeds SOC prioritization directly.
Technical intelligence is the machine-readable layer: IP addresses, domains, file hashes, URLs, mutex names. It integrates most easily into tooling and expires fastest.
Correlation is what connects the layers. A file hash (technical) matters more when it is tied to a campaign (operational) attributed to an actor known to target your sector (strategic) whose techniques you can hunt for (tactical). Each type answers questions the others cannot, and a program that keeps them in separate silos has four partial pictures instead of one.
What can be correlated in cyber threat intelligence?
The raw material of correlation is a small set of artifact types that recur across every intelligence program.
Indicators of compromise. IPs, domains, URLs, file hashes, TLS certificate fingerprints, email addresses. Correlation works across feeds (the same indicator reported twice, two indicators resolving to the same infrastructure) and against telemetry (the domain a feed flagged yesterday appearing in today’s DNS logs).
TTPs. Techniques mapped to ATT&CK identifiers can be correlated between reports (two campaigns sharing an unusual persistence technique) and against detections (an EDR alert whose mapped technique matches a tracked actor’s known chain).
Threat actors and campaigns. Actor intelligence correlates through aliases (the same group carries different names across vendor naming schemes), through infrastructure overlap, and through tooling reuse. Campaign correlation clusters individually reported incidents into one operation.
Vulnerabilities and exposures. A CVE gains urgency when correlated with exploitation reporting, such as an entry in the CISA Known Exploited Vulnerabilities catalog, and gains relevance when correlated with the asset inventory: which hosts run the affected version, and which of those are reachable from the internet.
Internal telemetry. Alerts, authentication logs, DNS queries, proxy records, and EDR events are the sightings that anchor external intelligence to the environment. Without them, correlation produces a better-organized library; with them, it produces findings.
It is worth noticing what shape this material takes. STIX 2.1, the OASIS standard for exchanging threat intelligence, models it as typed objects (indicator, malware, threat actor, campaign, attack pattern, vulnerability) joined by typed relationships: an indicator indicates a malware family, the malware is used by an actor, a campaign is attributed to that actor, and the campaign targets a sector. Threat intelligence is graph-shaped by design; the entities and relationships are the data model, whether or not the tooling that stores them treats them that way.
The threat intelligence correlation process
In practice correlation runs as a pipeline, most of it hosted in a threat intelligence platform (TIP); in the SANS 2025 CTI Survey, TIP and SOAR tooling account for more than 70% of CTI integration into detection and response systems. The stages parallel the event-correlation pipeline, with intelligence-specific work at each step.
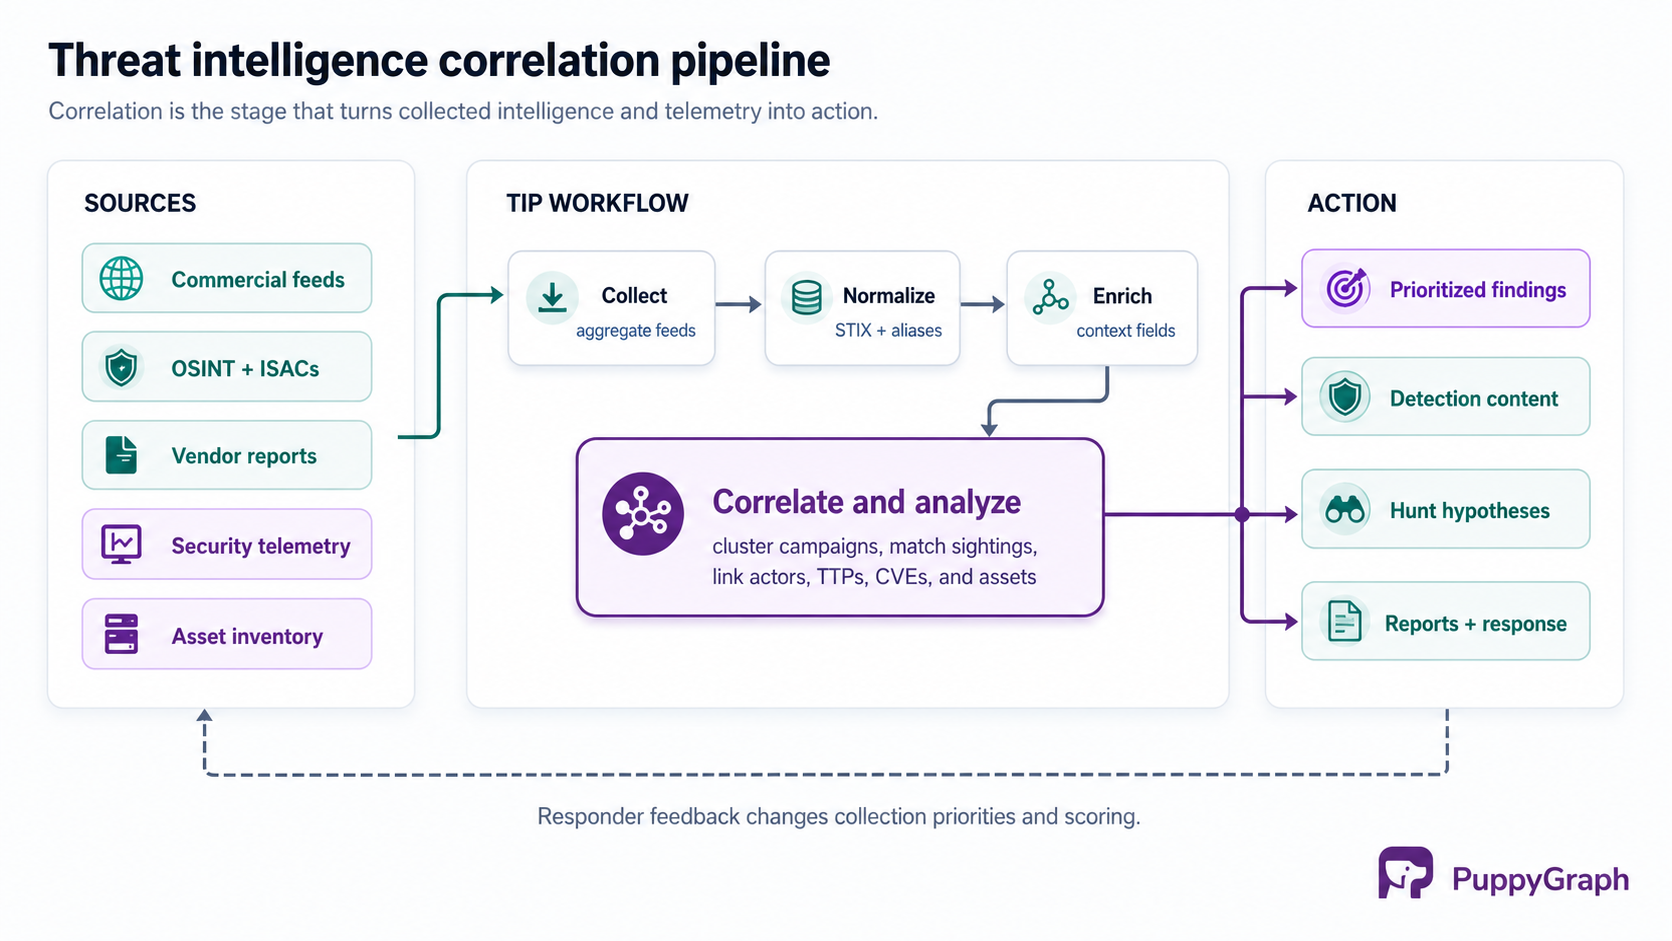
Collection and aggregation pulls from commercial feeds, open-source feeds, ISACs and CERTs, dark-web monitoring, vendor reports, and the organization’s own incident history. Breadth matters here for the same reason it does in event correlation: a relationship between two artifacts can only be found if both were collected.
Normalization and deduplication converts everything to a common model, typically STIX, and collapses duplicates. This stage also handles the quieter problem of alias resolution, recognizing that entries from different vendors reference the same actor or malware family under different names.
Enrichment adds per-artifact context: whois and passive DNS for infrastructure, sandbox detonation results for samples, geolocation, reputation history. Enrichment does not relate artifacts to each other, but it supplies the attributes correlation will pivot on.
Correlation and analysis is the core. Intel-to-intel work clusters indicators into campaigns by shared infrastructure and tooling, maps campaigns to actors, and links techniques across reports. Intel-to-telemetry work matches the resulting structure against the environment: indicator sightings in logs, technique matches in detections, exploited CVEs in the asset inventory.
Prioritization scores what correlation surfaces by confidence, severity, and relevance: whether the actor targets your sector, whether the exposed asset matters, whether the sighting is on a crown-jewel system or a lab box.
Dissemination and action pushes the results to where they change behavior: blocklists and detection content (correlation rules keyed on high-confidence indicators), hunt hypotheses for techniques the environment cannot yet detect, and reports for the humans making decisions. What responders learn feeds back into collection priorities, closing the loop.
The pipeline framing makes correlation look like one stage among six, but the other five exist to serve it. Collection, normalization, and enrichment prepare the material; prioritization and dissemination distribute what correlation found. A program that runs the whole pipeline but correlates shallowly has automated the storage of intelligence, not the use of it.
How context improves threat intelligence correlation
A correlation without context is a match. An indicator appeared in the proxy logs; a hash matched a sample; a CVE exists on a host. Whether the match matters depends on questions the match itself cannot answer: what asset was involved and what can it reach, what privileges does the affected account hold, does the actor behind the indicator target organizations like this one, is the vulnerable service exposed or buried three network segments deep. Context is what separates the sighting that justifies paging someone from the one that justifies a ticket.
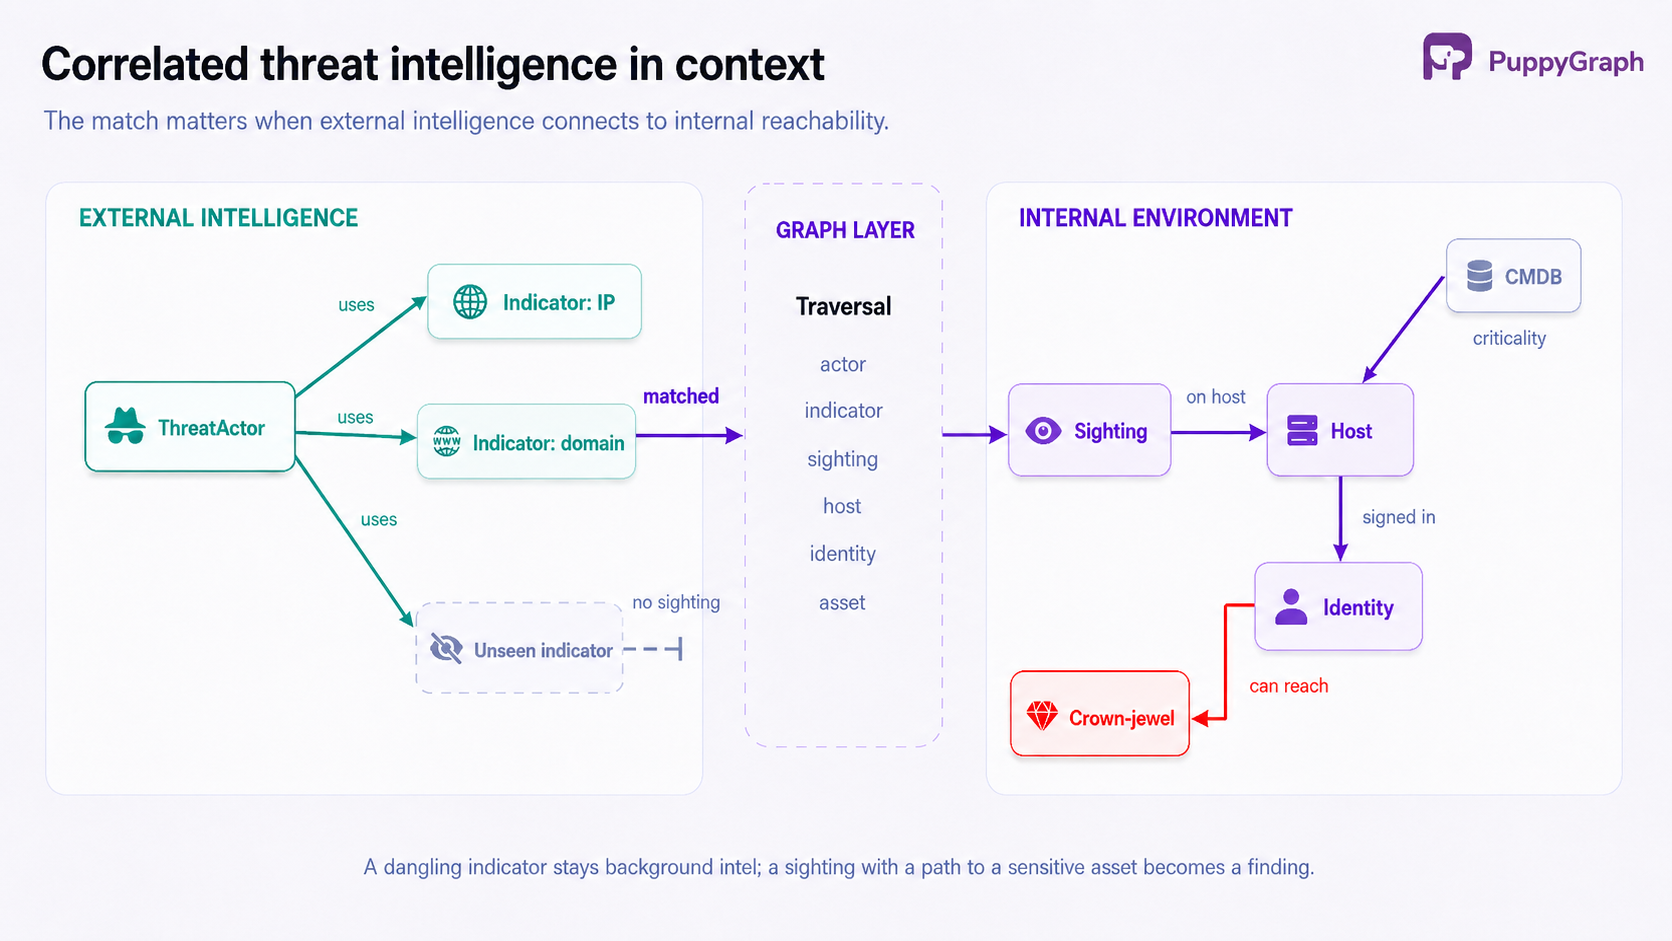
The observation that matters for tooling is that nearly all of this context is relational. The severity of an indicator sighting is a property of the path around it: the host that resolved the flagged domain, the account signed in on that host, the systems that account can reach, the actor the domain is attributed to, the sector that actor targets. Answering “which of today’s intel matches touch anything that can reach sensitive data” means walking from an indicator through a sighting through a host through an identity to an asset, across data that lives in a TIP, a SIEM, a CMDB, and an identity provider. On flat tables each hop is another join, and the questions tend to be answered by hand during an incident rather than asked routinely.
This is where the graph shape of the material stops being a modeling observation and starts being an operational one. If indicators, actors, campaigns, techniques, alerts, hosts, identities, and assets are nodes, and attributed to, sighted on, signed in from, and can reach are edges, the context questions become traversals:
MATCH (actor:ThreatActor {name: $actor})-[:USES]->(i:Indicator)
      <-[:MATCHED]-(s:Sighting)-[:ON_HOST]->(h:Host)
      -[:CAN_REACH*1..3]->(a:Asset {tier: "crown-jewel"})
RETURN i.value, h.name, a.name
One query answers what would otherwise be an afternoon of pivoting between consoles: every sighting of this actor’s infrastructure that sits within three hops of an asset worth protecting.
Getting that graph view has traditionally meant exporting intelligence and telemetry into a separate graph database through an ETL pipeline, which adds latency, cost, and another system to secure. PuppyGraph takes a different path: it is a graph query engine that maps the tables this data already lives in (indicators and sightings, alerts, assets, identities, vulnerabilities) to nodes and edges and runs multi-hop traversals over them in place, in SQL databases, data warehouses, or data lakes, including direct reads of open table formats like Iceberg, with no copy into a separate database. Analysts query with openCypher (Gremlin is also supported), asking which sightings connect to which actors and what those sightings can reach. PuppyGraph is not a TIP or a SIEM: it does not ingest feeds, deduplicate indicators, or run detection content. It is a relationship layer that complements them, turning the entities they reference into a graph the context questions can be asked against. This kind of graph layer for security correlation, unified asset inventory, and exposure analysis is used by Palo Alto Networks, Datadog, Netskope, Trend Micro, Sola Security, and Blackpoint Cyber. The practical point is that context becomes much more useful when it can be traversed where the underlying evidence already lives, instead of reconstructed during each investigation.
Automating threat intelligence correlation with AI
Correlation has always been automation-hungry, because the artifact volume outgrew manual analysis years ago, and AI adoption in the discipline is now measurable: the SANS 2025 CTI Survey found more than a third of organizations using AI somewhere in their CTI program, with data gathering, processing, and prioritization cited as the high-impact areas.
The automation lands at three levels. Extraction is the most established: most intelligence still arrives as prose (vendor reports, advisories, blog posts), and NLP models, increasingly LLMs, extract the entities and relationships that prose describes, turning an unstructured report into structured objects a platform can correlate. Clustering and scoring applies machine learning to the correlation itself: grouping indicators into campaigns by infrastructure similarity, resolving actor aliases, and scoring relevance against the organization’s profile, at a scale no analyst team can match by hand. Investigation is the newest layer: LLM-based assistants and agents that take a natural-language question (“have we seen anything connected to this campaign?”), decompose it, and assemble an answer across intelligence and telemetry.
The failure mode of that newest layer is well known: language models generate plausible output whether or not it is true, and correlation output feeds decisions (blocking, paging, escalation) that are expensive when wrong. The mitigation is grounding, giving the model a defined data model to operate against and validating what it generates before execution. An agent that queries a graph of intelligence and telemetry through an enforced schema cannot silently hallucinate an entity or a relationship that does not exist; the invalid query is rejected with structured feedback the agent can use to correct itself. This is the same graph layer described in the previous section doing double duty: PuppyGraph validates every generated query against the graph schema before execution, so an assistant answering questions over intelligence and telemetry stays anchored to entities and relationships that actually exist in the data.
AI changes where analysts spend their time rather than removing them from the loop. Extraction and clustering move effort away from assembling the picture; investigation agents move effort toward judging it. Both are only trustworthy to the degree the automation is grounded in the data it claims to describe, which makes the structure underneath, not the model on top, the load-bearing choice.
Conclusion
Threat intelligence correlation is the step that turns collected intelligence into usable intelligence: connecting indicators, techniques, actors, campaigns, and vulnerabilities to each other, and anchoring the result to the telemetry and assets of the environment being defended. Raw feeds age quickly and carry no relevance signal; the durable value lives in the structure correlation builds, and in the context that structure makes queryable when a match finally lands.
The through-line is relationships. Intelligence is graph-shaped by design, environments are graph-shaped in fact, and the questions that matter most (what is this connected to, what can it reach, who is behind it) are traversals across both. Try the forever-free PuppyGraph Developer Edition and book a demo with the team to see how openCypher and Gremlin queries run over warehouse and lakehouse tables, with no graph-specific ETL, alongside the TIP and SIEM that produce the indicators and alerts.

Hao Wu is a Software Engineer with a strong foundation in computer science and algorithms. He earned his Bachelor’s degree in Computer Science from Fudan University and a Master’s degree from George Washington University, where he focused on graph databases.


