

What is Compliance Analytics? Benefits and Challenges
Every company needs compliance. Some requirements apply broadly, like GDPR for any business that processes personal data. Others are industry-specific, like HIPAA for patient data or PCI DSS for organizations that store, process, or transmit cardholder data. Compliance management keeps a business aligned with laws, regulations, and standards, supporting secure practices and building customer confidence.
As companies scale, that job gets harder. More systems, more vendors, more data, more controls, and more change making it difficult to track everything manually. Compliance analytics helps fill in those gaps, allowing teams to monitor compliance with data and automation, so they can spot gaps early, prove adherence faster, and focus effort where it matters. In this blog, we’ll cover what compliance analytics is, how it works, the key benefits and challenges, the main analytics types, and how to choose the right approach for your use case.
What is Compliance Analytics?
Compliance analytics applies data analytics to compliance. It shifts teams from periodic, manual checks to continuous visibility, so they can catch gaps earlier and prioritize fixes based on risk.
That visibility is hard to get when compliance evidence is scattered across systems and formats, including structured data (transactions, access logs, asset inventories) and unstructured data (emails, documents, messages). Compliance analytics helps unify this evidence, measure adherence over time, and produce audit-ready reporting.
Driven by frameworks like ISO 27001 and regulations such as GDPR, HIPAA, and CCPA, compliance has become more than a checklist. When controls fail, the consequences can be real: security exposure, audit failures, and loss of customer trust.
How Compliance Analytics Processes Work
Compliance analytics sits under the broader umbrella of compliance management. It provides a structured, data-backed way to track adherence, prioritize gaps by risk, and produce audit-ready evidence.
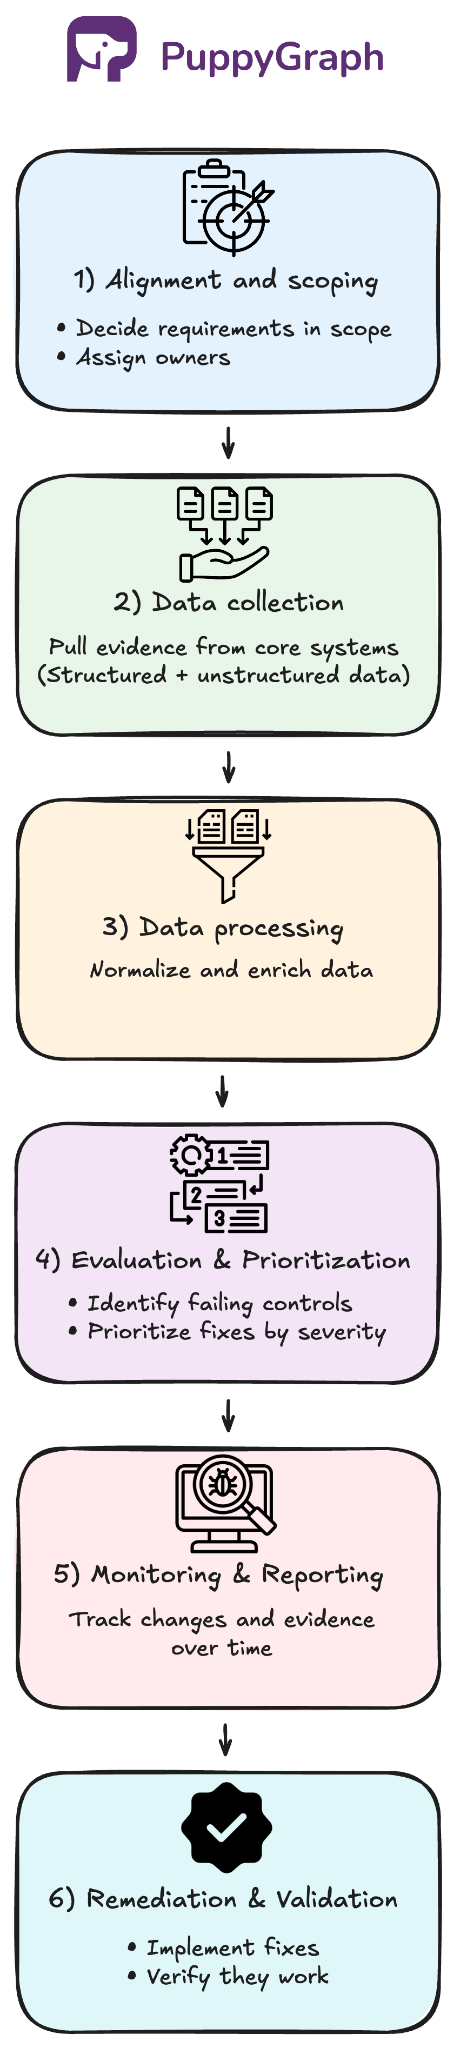
A typical workflow looks like this:
- Alignment and Scoping: Choose frameworks and regulations, define what’s in scope, map requirements to controls and evidence, assign owners.
- Data Collection: Pull evidence from core systems (transactions, cloud logs, IAM, tickets, and vendor compliance reports).
- Data Processing: Normalize and enrich data (owners, environment, sensitivity) and connect records so evidence maps to the right controls and assets.
- Control Evaluation and Risk Prioritization: Run checks mapped to requirements, flag failures or missing evidence, and rank findings by severity (control criticality, data sensitivity, exposure, scope) so teams fix the highest-risk gaps first.
- Monitoring and Reporting: Dashboards, alerts, and evidence packages that show what was checked and what changed over time.
- Remediation and Validation: Route to owners, track corrective actions, and re-check to confirm closure.
Why Compliance Analytics Matters Today
Regulators increasingly expect compliance programs to be backed by evidence, not just exist on paper. In the DOJ’s Evaluation of Corporate Compliance Programs (updated September 2024), prosecutors are explicitly prompted to ask: “More generally, what testing of controls, collection and analysis of compliance data, and interviews of employees and third parties does the company undertake?”
Before we discuss the benefits of compliance analytics, it’s worth looking at why many compliance programs still struggle to produce consistent, defensible evidence at scale.
Scaling Without Visibility
As organizations grow, evidence spreads across dozens of platforms: cloud controls in AWS, HR systems like Workday, tickets in Jira, plus spreadsheets, emails, and vendor reports. Teams end up reconciling mismatched numbers and chasing missing context. A unified, data-backed view reduces inconsistency and lowers the chance of incomplete findings or audit surprises.
Change Without Traceability
Requirements and systems evolve, and risk shifts with new vendors, products, and architectures. When compliance is managed manually, it’s hard to trace how updated requirements impact current controls and evidence. The result is often costly rework, or audit failures caused by gaps teams didn’t know they had.
Periodic Checks and Stale Evidence
Many programs still run on quarterly check-ins and manual rollups. Evidence quickly becomes outdated, gaps sit unnoticed, and status reporting eats time that should go to remediation. Continuous monitoring keeps compliance closer to reality between audits.
Key Advantages of Using Compliance Analytics
As requirements change and systems multiply, control gaps can get buried in logs and tickets, reports get messy, and response times slow down. Compliance analytics addresses those pain points in a few concrete ways.
Earlier Detection of Compliance Gaps
Compliance analytics shortens time to discovery by running recurring control checks and monitoring for drift. When a control fails, access expands unexpectedly, or required evidence stops appearing, teams can catch the gap closer to when it happens, while the context is still fresh. This reduces the window of exposure and helps keep small cracks from turning into audit findings or real security risk.
For example, an IAM policy change that unintentionally grants broad access to a system-critical database can be flagged soon after it’s deployed.
Risk-based Scoring and Prioritization
Not every finding deserves the same urgency, and treating them equally is how teams burn time on low-impact fixes. Compliance analytics helps teams score and rank issues so remediation lines up with business priorities, like protecting system-critical assets and regulated data first.
Common severity signals include:
- Impact: what’s at stake if the gap is real (critical systems, sensitive data, business disruption)
- Likelihood: how likely it is to lead to noncompliance or misuse
- Exposure: how reachable the asset is (internet-facing, broad permissions, privileged access)
- Scope: the potential blast radius of the issue (isolated vs organization-wide)
This turns a long list of findings into a prioritized queue, where the first fixes are the ones that matter most to the organization.
Audit-Ready Reporting
Audit readiness comes down to whether you can produce consistent, reviewable evidence on demand. Compliance analytics helps by keeping an evidence trail that ties each requirement to the relevant control checks, time window, and supporting artifacts. That makes it easier to answer auditor questions quickly and consistently: what was tested, what passed or failed, what changed, and when.
Improved Operational Efficiency
Day-to-day, compliance work often turns into manual coordination: exports, screenshots, status updates, and repeated evidence requests across teams. Compliance analytics reduces that workload by automating checks and tracking status continuously. It also makes change easier to handle. When a policy or requirement updates, teams can quickly identify which controls and assets are affected so they focus effort on the right updates instead of rechecking everything.
Different Types of Analytics in Compliance
Most compliance analytics programs use a mix of techniques because different stages of the compliance pipeline require different kinds of answers, from turning raw evidence into usable signals to validating controls, tracking change, and prioritizing risk. The right mix depends on what you’re trying to prove and where the evidence lives. Let’s explore some of the most common types of compliance analytics.
Rule-based Monitoring
Rule-based monitoring uses deterministic checks to continuously evaluate controls against specific requirements. When the evidence matches the rule, it’s marked as passing. When it doesn’t, it’s flagged as a gap. This is a strong fit for controls with clear conditions, like configuration baselines, access requirements, retention windows, or whether required evidence exists at all.
Examples include verifying MFA for privileged accounts, ensuring encryption is enabled on regulated data stores, or confirming access reviews were completed on schedule. Because the logic is explicit, results are straightforward to explain, easy to automate, and well-suited for ongoing compliance monitoring.
Text Analytics (NLP)
Many compliance signals live in text: policies, exception requests, tickets, contracts, emails, documents, and vendor reports. Text analytics (NLP) often sits in the data processing and cleaning stage, where unstructured evidence is converted into structured fields teams can search, track, and evaluate consistently. For example, it can map a document to a control, flag missing clauses, extract key attributes (system name, owner, dates, scope), or classify whether evidence meets the requirement. Once you have consistent signals in a structured form, you can start measuring changes over time.
Statistical Analytics
Statistical analytics takes rule-based monitoring one step further. Instead of treating every question as a simple pass or fail, it helps teams summarize compliance posture over time and across systems. This makes it easier to see trends, compare groups, and understand where risk concentrates, including when metrics spike above expected thresholds.
In practice, this can include flagging unusual spikes in failed login attempts or frequent privilege changes, which may signal access controls aren’t operating as expected. Teams can also track control pass rates week over week and use distributions to spot weak points, like systems that consistently land in the bottom tier for compliance performance. Because the results are interpretable, statistical analytics is also a strong fit for regulatory and audit reporting, where teams need to clearly explain what changed, why it matters, and how they responded.
ML and Predictive Analytics
ML and predictive analytics builds on statistical analytics by combining many signals and learning patterns over time. Instead of only describing what changed, it helps teams estimate what’s most likely to become a problem next, and where to focus first.
This often shows up in risk scoring and forecasting. Models can prioritize findings using signals like control history, change frequency, exposure, data sensitivity, and past remediation outcomes. For example, if two systems both flag compliance gaps, a model might rank an internet-facing application that serves regulated data higher than an internal staging system with limited access and non-sensitive data. The exposed system has higher potential impact and is more likely to escalate into a reportable incident.
Graph Analytics
Graph analytics focuses on relationships: who accessed what, which assets are in scope, how vendors connect to systems, and where evidence is missing along a chain of requirements and controls. Graphs are a natural fit because compliance is relationship-first. Requirements map to controls, controls apply to assets, identities access those assets, and evidence shows whether the control operated.
When answers aren’t obvious, like who can reach a regulated dataset through inherited permissions, graphs help because you can trace access paths across connected systems instead of piecing it together manually.
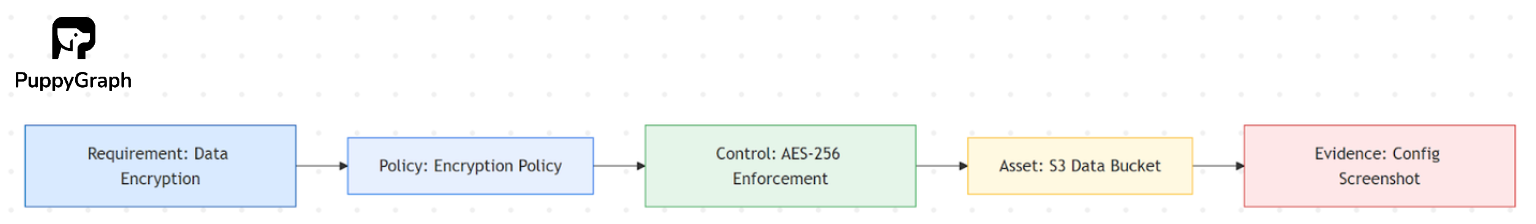
Teams often model this as a compliance graph, where nodes represent requirements, policies, controls, and assets, and edges represent how they connect. Conceptually, it links two chains:
- Intent chain: Requirement → Policy → Control (what should exist)
- Implementation chain: Control → Assets/Identities → Evidence (what does exist)
Comparing the two highlights coverage gaps, weak points, and where remediation should focus.

How to Choose A Compliance Analytics Solution
A practical way to choose a solution is to match it to the questions you need to answer today, and the complexity you expect as you scale.
For most teams, rule-based monitoring and statistical analytics are the foundation. Rule-based checks give clear pass/fail answers for controls with explicit requirements. Statistical analytics adds trends and distributions, helping you spot drift, compare systems and teams, and understand where compliance issues concentrate over time.
As organizations grow, questions become less clear-cut. That’s where ML and predictive analytics and graph analytics start to shine. ML helps when the problem is triage at scale, scoring findings and forecasting which gaps are most likely to escalate. Graph analytics helps when the problem is scope and relationships, like tracing access paths, understanding inherited permissions, or mapping requirements to controls and evidence across many systems.
If a large portion of your evidence is unstructured, text analytics (NLP) is also worth prioritizing early. Converting documents, tickets, emails, and vendor reports into structured signals improves the quality of everything downstream, from rule-based checks and statistical tracking to risk scoring and relationship analysis.
You can run a quick sanity-check by matching your questions to the technique:
- Rule-based Monitoring: pass/fail controls, required evidence checks
- Statistical Analytics: trends, comparisons across environments, recurring weak points
- ML + Predictive Analytics: risk scoring, prioritization, forecasting escalation
- Graph Analytics: access paths, inherited permissions, scope and blast radius
- Text Analytics (NLP): classify/map documents to controls, extract key fields from text
Getting Started with Compliance Graphs
If you’re considering graph analytics for compliance, a compliance graph is the natural next step. It connects requirements, controls, assets, identities, and evidence into one view, making it easier to trace coverage, answer relationship-heavy questions, and spot gaps quickly.
A compliance graph is especially useful for:
- End-to-end Traceability: Follow the chain from requirement → policy → control → asset/identity → evidence.
- Coverage and Gap Detection: See which in-scope assets lack a required control or have missing evidence for a given time window.
- Change Impact Analysis: Understand what controls and evidence are affected when systems, permissions, vendors, or requirements change.
- Shared-control Prioritization: Identify controls that protect many critical assets, so fixes deliver the biggest risk reduction.
- Continuous Assurance: Move from point-in-time audit prep to ongoing verification as data and systems change.
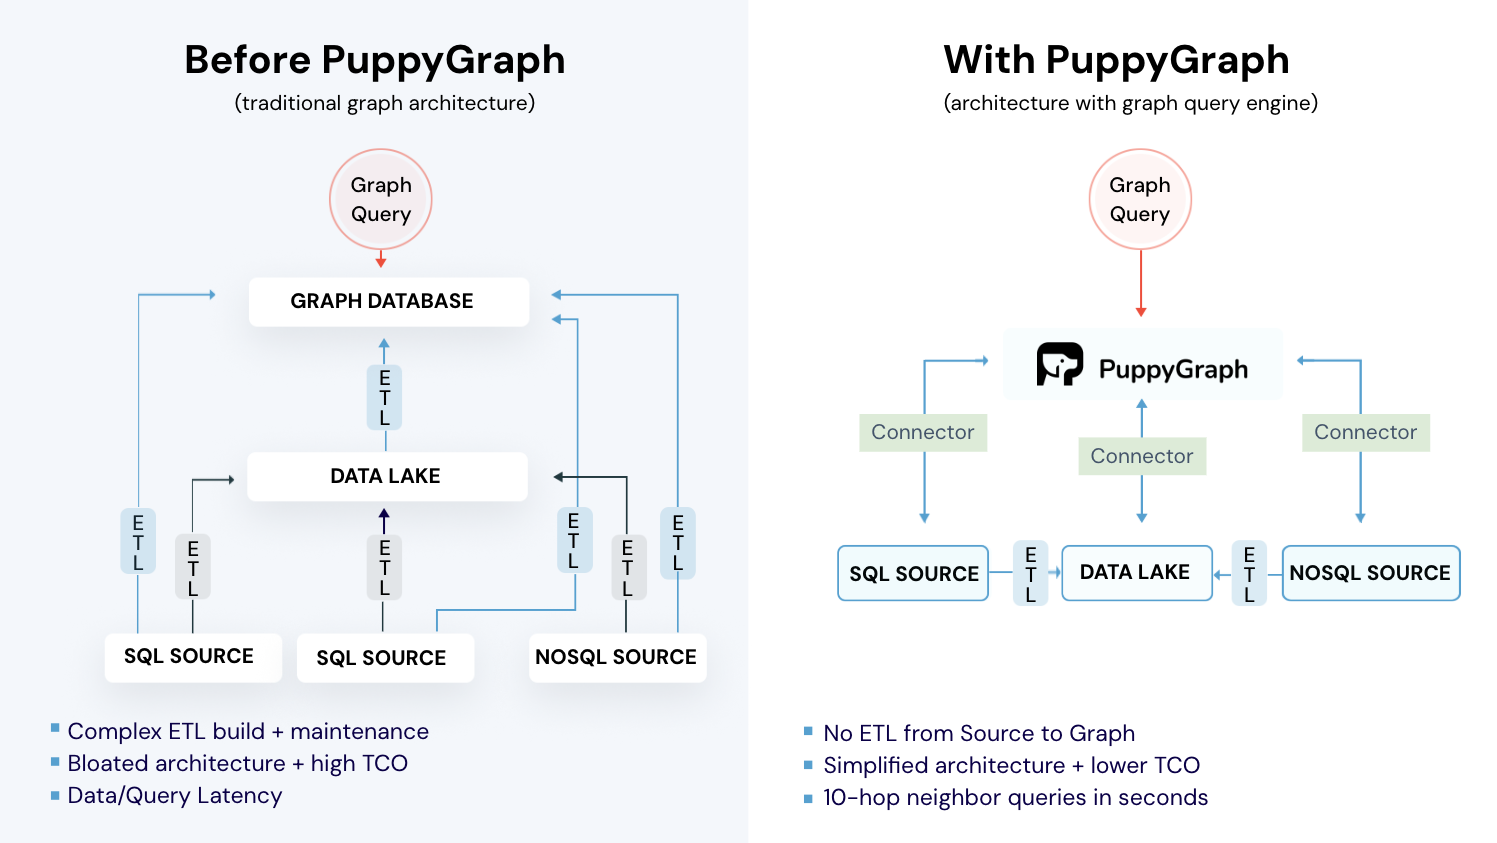
Historically, building a compliance graph has been expensive and operationally heavy. Teams often had to stand up a separate graph database, then move sensitive compliance data into it through ongoing ETL pipelines. That adds cost, latency, and another system to secure and maintain. That’s where PuppyGraph fits.
How PuppyGraph Helps

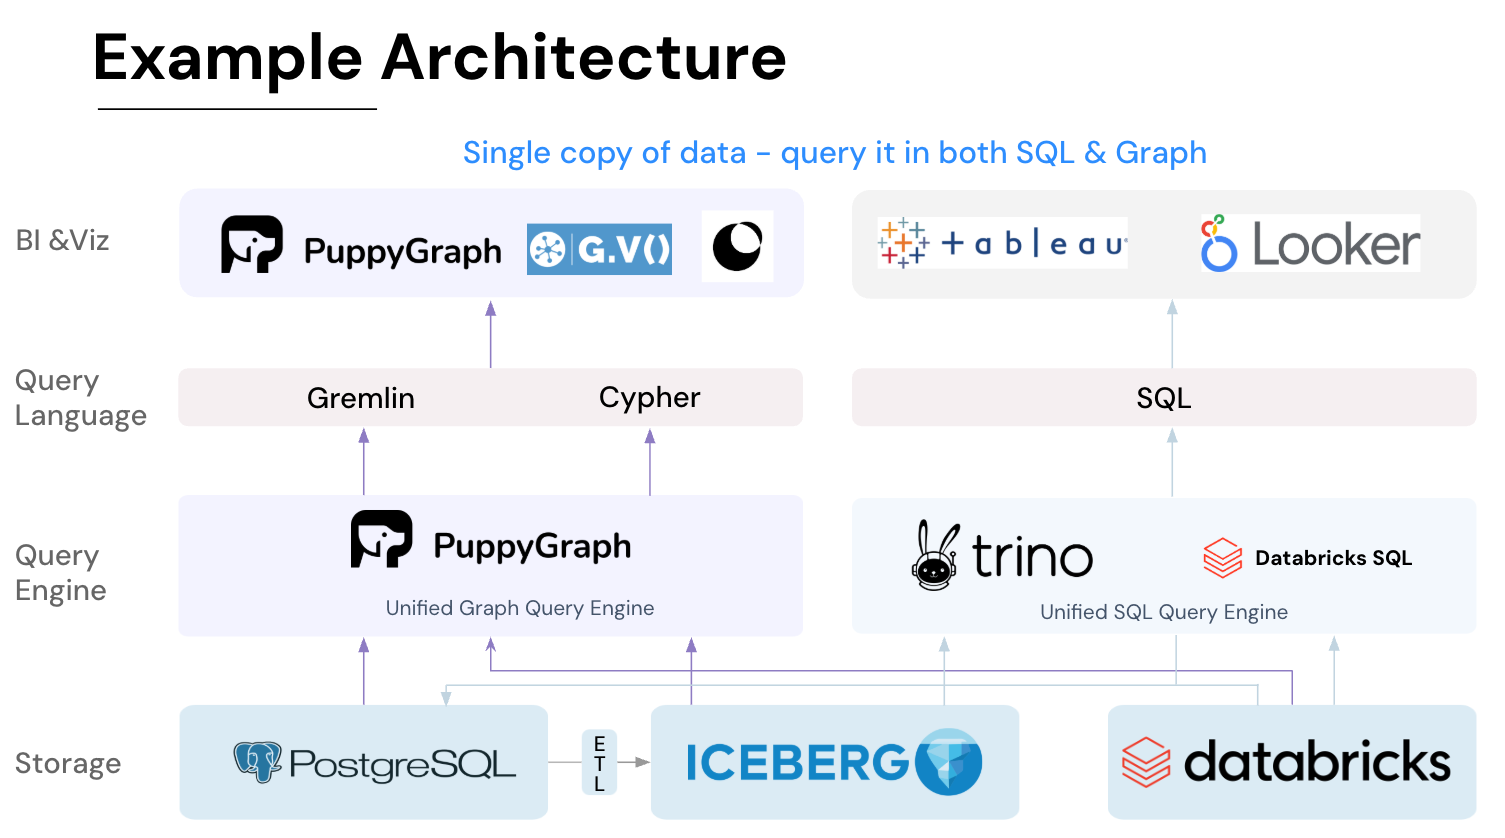
PuppyGraph is the first and only real time, zero-ETL graph query engine in the market, empowering data teams to query existing relational data stores as a unified graph model that can be deployed in under 10 minutes, bypassing traditional graph databases' cost, latency, and maintenance hurdles.
It seamlessly integrates with data lakes like Apache Iceberg, Apache Hudi, and Delta Lake, as well as databases including MySQL, PostgreSQL, and DuckDB, so you can query across multiple sources simultaneously.

Key PuppyGraph capabilities include:
- Zero ETL: PuppyGraph runs as a query engine on your existing relational databases and lakes. Skip pipeline builds, reduce fragility, and start querying as a graph in minutes.
- No Data Duplication: Query your data in place, eliminating the need to copy large datasets into a separate graph database. This ensures data consistency and leverages existing data access controls.
- Real Time Analysis: By querying live source data, analyses reflect the current state of the environment, mitigating the problem of relying on static, potentially outdated graph snapshots. PuppyGraph users report 6-hop queries across billions of edges in less than 3 seconds.
- Scalable Performance: PuppyGraph’s distributed compute engine scales with your cluster size. Run petabyte-scale workloads and deep traversals like 10-hop neighbors, and get answers back in seconds. This exceptional query performance is achieved through the use of parallel processing and vectorized evaluation technology.
- Best of SQL and Graph: Because PuppyGraph queries your data in place, teams can use their existing SQL engines for tabular workloads and PuppyGraph for relationship-heavy analysis, all on the same source tables. No need to force every use case through a graph database or retrain teams on a new query language.
- Lower Total Cost of Ownership: Graph databases make you pay twice — once for pipelines, duplicated storage, and parallel governance, and again for the high-memory hardware needed to make them fast. PuppyGraph removes both costs by querying your lake directly with zero ETL and no second system to maintain. No massive RAM bills, no duplicated ACLs, and no extra infrastructure to secure.
- Flexible and Iterative Modeling: Using metadata driven schemas allows creating multiple graph views from the same underlying data. Models can be iterated upon quickly without rebuilding data pipelines, supporting agile analysis workflows.
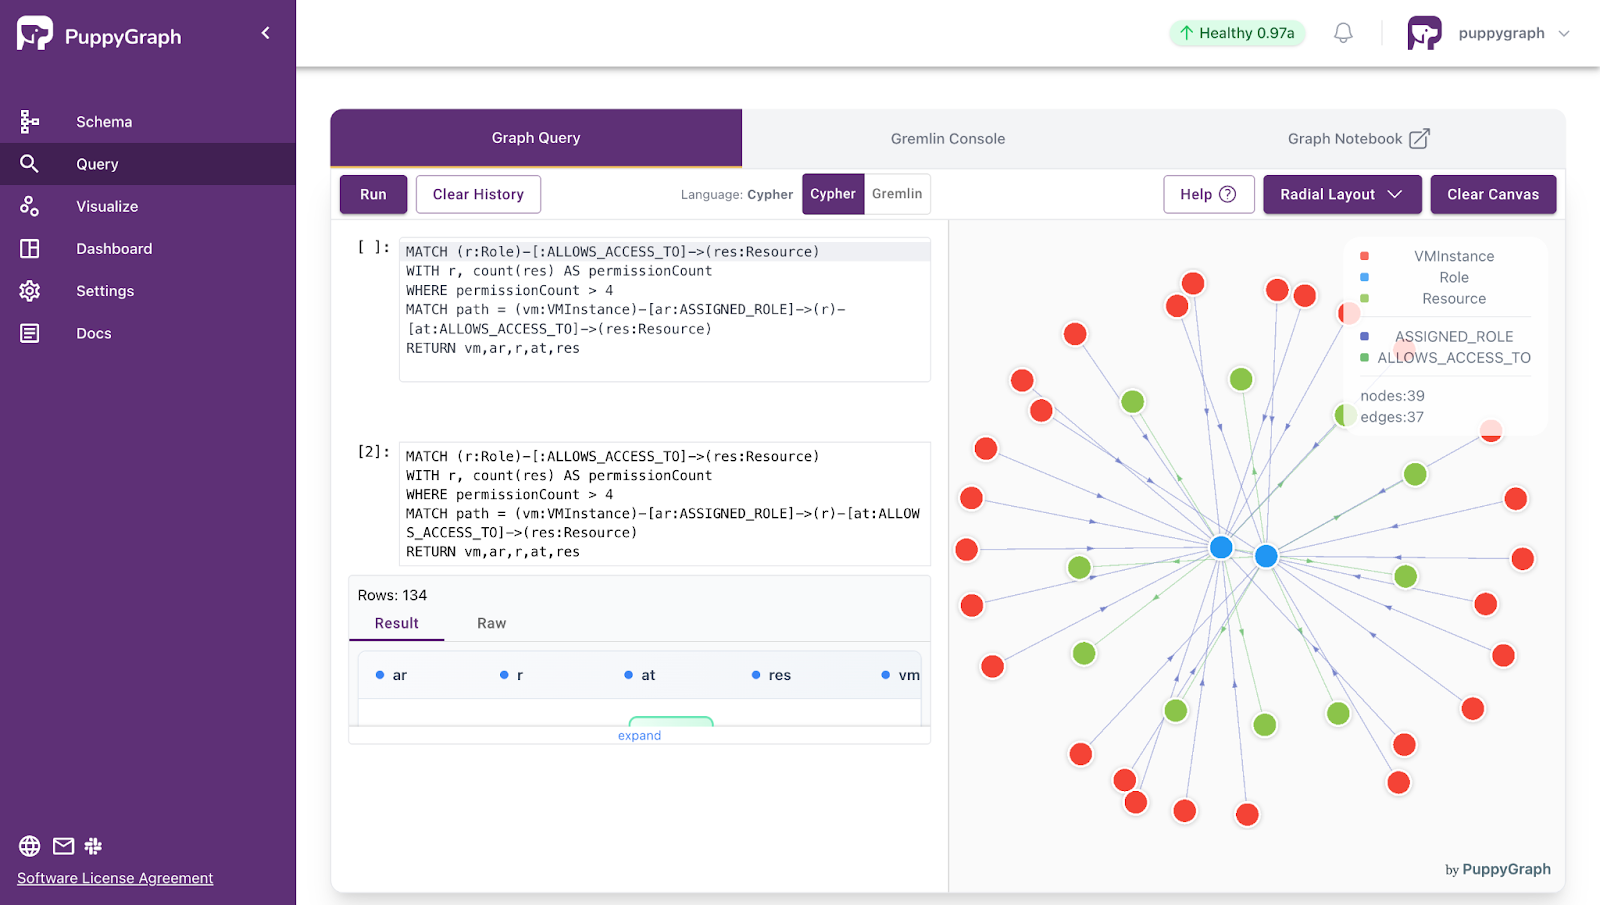
- Standard Querying and Visualization: Support for standard graph query languages (openCypher, Gremlin) and integrated visualization tools helps analysts explore relationships intuitively and effectively.
- Proven at Enterprise Scale: PuppyGraph is already used by half of the top 20 cybersecurity companies, as well as engineering-driven enterprises like AMD and Coinbase. Whether it’s multi-hop security reasoning, asset intelligence, or deep relationship queries across massive datasets, these teams trust PuppyGraph to replace slow ETL pipelines and complex graph stacks with a simpler, faster architecture.


As data grows more complex, the most valuable insights often lie in how entities relate. PuppyGraph brings those insights to the surface, whether you’re modeling organizational networks, social introductions, fraud and cybersecurity graphs, or GraphRAG pipelines that trace knowledge provenance.
Deployment is simple: download the free Docker image, connect PuppyGraph to your existing data stores, define graph schemas, and start querying. PuppyGraph can be deployed via Docker, AWS AMI, GCP Marketplace, or within a VPC or data center for full data control.
Conclusion
Compliance programs are only as strong as the evidence behind them. As organizations add more systems, vendors, and data, that evidence gets scattered across tools and formats, which makes it harder to understand what’s in scope, what’s covered, and what’s missing. Compliance analytics helps teams regain control by making compliance more measurable and easier to prove as the organization changes.
A lot of compliance questions are relationship-heavy by nature: how requirements map to controls, how controls apply to assets, who can reach regulated data, and what evidence supports each claim. That’s why compliance graphs are such a natural fit. They connect requirements, controls, assets, identities, and evidence into a single view, making it easier to trace coverage, find gaps, and understand impact when things change.
Want to prototype a compliance graph quickly? Download our forever-free Developer Edition, or book a demo with our expert graph team to walk through your use case.

Jaz Ku is a Solution Architect with a background in Computer Science and an interest in technical writing. She earned her Bachelor's degree from the University of San Francisco, where she did research involving Rust’s compiler infrastructure. Jaz enjoys the challenge of explaining complex ideas in a clear and straightforward way.

Get started with PuppyGraph!


Developer Edition
- Forever free
- Single noded
- Designed for proving your ideas
- Available via Docker install
Enterprise Edition
- 30-day free trial with full features
- Everything in developer edition & enterprise features
- Designed for production
- Available via AWS AMI & Docker install