

What is Graph Analytics?
Real-world data is deeply interconnected. Customers interact with products, devices communicate with services, and financial transactions link individuals and institutions in complex networks. Traditional relational databases store data efficiently in tables, but they often struggle to capture the rich relationships that exist between entities. Graph analytics addresses this limitation by modeling data as networks of nodes and relationships and applying algorithms that uncover patterns within those networks.
Graph analytics has become increasingly important in domains such as fraud detection, recommendation systems, cybersecurity, and knowledge discovery. By analyzing the structure and connectivity of data, organizations can uncover insights that would remain hidden in conventional analytical approaches. With the rise of large-scale data systems and graph-native technologies, graph analytics is now a fundamental tool for understanding complex systems. This article explains what graph analytics is, why it matters, the algorithms behind it, and how platforms like PuppyGraph make graph analytics easier to implement.
What is Graph Analytics
Graph analytics refers to the process of analyzing data represented as a graph in order to uncover relationships, patterns, and structures within connected datasets. In a graph model, entities are represented as nodes, while the relationships between them are represented as edges. These connections allow analysts to examine how different entities interact and influence one another.
Unlike traditional analytics that focus primarily on attributes stored in rows and columns, graph analytics emphasizes connections. This means the focus shifts from simply asking “what properties does this object have?” to questions such as “how is this object connected to others?” and “what role does it play in the broader network?”
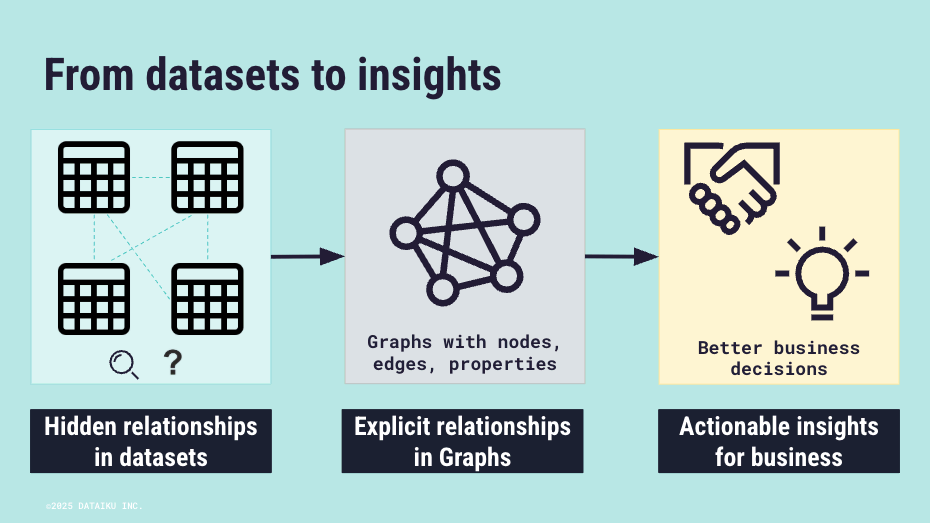
Graph analytics focuses on extracting insights from the structure and relationships within graph data. It typically includes tasks such as applying graph algorithms, performing multi-hop traversals, and identifying structural patterns within a network. Graph algorithms can help measure properties of the graph, such as identifying influential nodes, detecting communities, or computing shortest paths. In addition, multi-hop queries allow analysts to explore indirect relationships across several steps, while pattern matching enables the discovery of recurring structures or interaction patterns within the graph.
To make these tasks easier to express, graph query languages such as Cypher and Gremlin provide a declarative way to navigate and analyze graph structures. These languages allow users to naturally describe multi-hop traversals and pattern-based queries directly in the graph model, enabling analysts to explore neighborhoods, follow chains of relationships, and detect structural patterns with concise queries. Combined with graph algorithms, they form the core toolkit for analyzing complex networks where relationships play a central role.
Why Graph Analytics Matters for Modern Data
The rapid growth of digital data has created increasingly complex information environments. In many modern systems, data is interconnected and forms large networks rather than isolated records. Traditional analytical approaches often struggle to capture these network structures. Graph analytics addresses this challenge by providing specialized methods for analyzing data represented as nodes and relationships within a graph.
One important reason graph analytics matters is its ability to uncover structural patterns within large networks. By examining how entities are connected, analysts can identify clusters, communities, and unusual structures that reveal meaningful behaviors in the data. For example, coordinated fraud schemes often appear as tightly connected groups of accounts that can only be detected when transactions are analyzed as a network.
Another key advantage is the ability to trace connections across complex systems. Many relationships in real-world datasets occur through chains of intermediate entities rather than direct links. Graph analytics allows analysts to explore these multi-step connections, making it possible to discover indirect relationships, hidden dependencies, and previously unknown links between entities.
A third reason graph analytics is valuable is its role in optimizing network-based systems. Many operational environments, such as transportation networks, logistics systems, and communication infrastructures, can be naturally represented as graphs. Graph algorithms can analyze these systems to identify bottlenecks, determine efficient routes, and improve overall system performance.
As data ecosystems become more interconnected, the ability to detect network structures, trace complex connections, and optimize graph-based systems becomes increasingly important. Graph analytics provides the analytical foundation needed to understand and manage these interconnected environments.
What is Graph Analytics Used For?
Graph analytics is used in a wide range of industries where relationships between entities play a crucial role. By analyzing network structures, organizations can uncover insights that traditional analytical methods may overlook.
One common use case is fraud detection in financial systems. Banks and payment platforms analyze transaction networks to identify suspicious patterns such as circular money flows or unusually dense transaction clusters. Graph analytics helps reveal fraud rings that might otherwise remain hidden.
Another major application is recommendation systems. E-commerce and streaming platforms use graph analytics to analyze relationships between users, products, and preferences. By identifying similarities in behavior or shared connections, systems can recommend products, movies, or content tailored to individual users.
Graph analytics is also widely used in cybersecurity. Network logs and system interactions can be modeled as graphs where nodes represent devices or accounts. By analyzing these connections, security teams can detect abnormal communication patterns, identify compromised nodes, and prevent attacks before they escalate.
Knowledge graphs and search engines also rely heavily on graph analytics. By connecting entities such as people, places, and concepts, these systems allow users to discover meaningful relationships across large information networks. This approach powers many modern AI-driven search technologies.
Core Concepts Behind Graph Analytics
Understanding graph analytics requires familiarity with several foundational concepts that define how graph data is structured and analyzed.
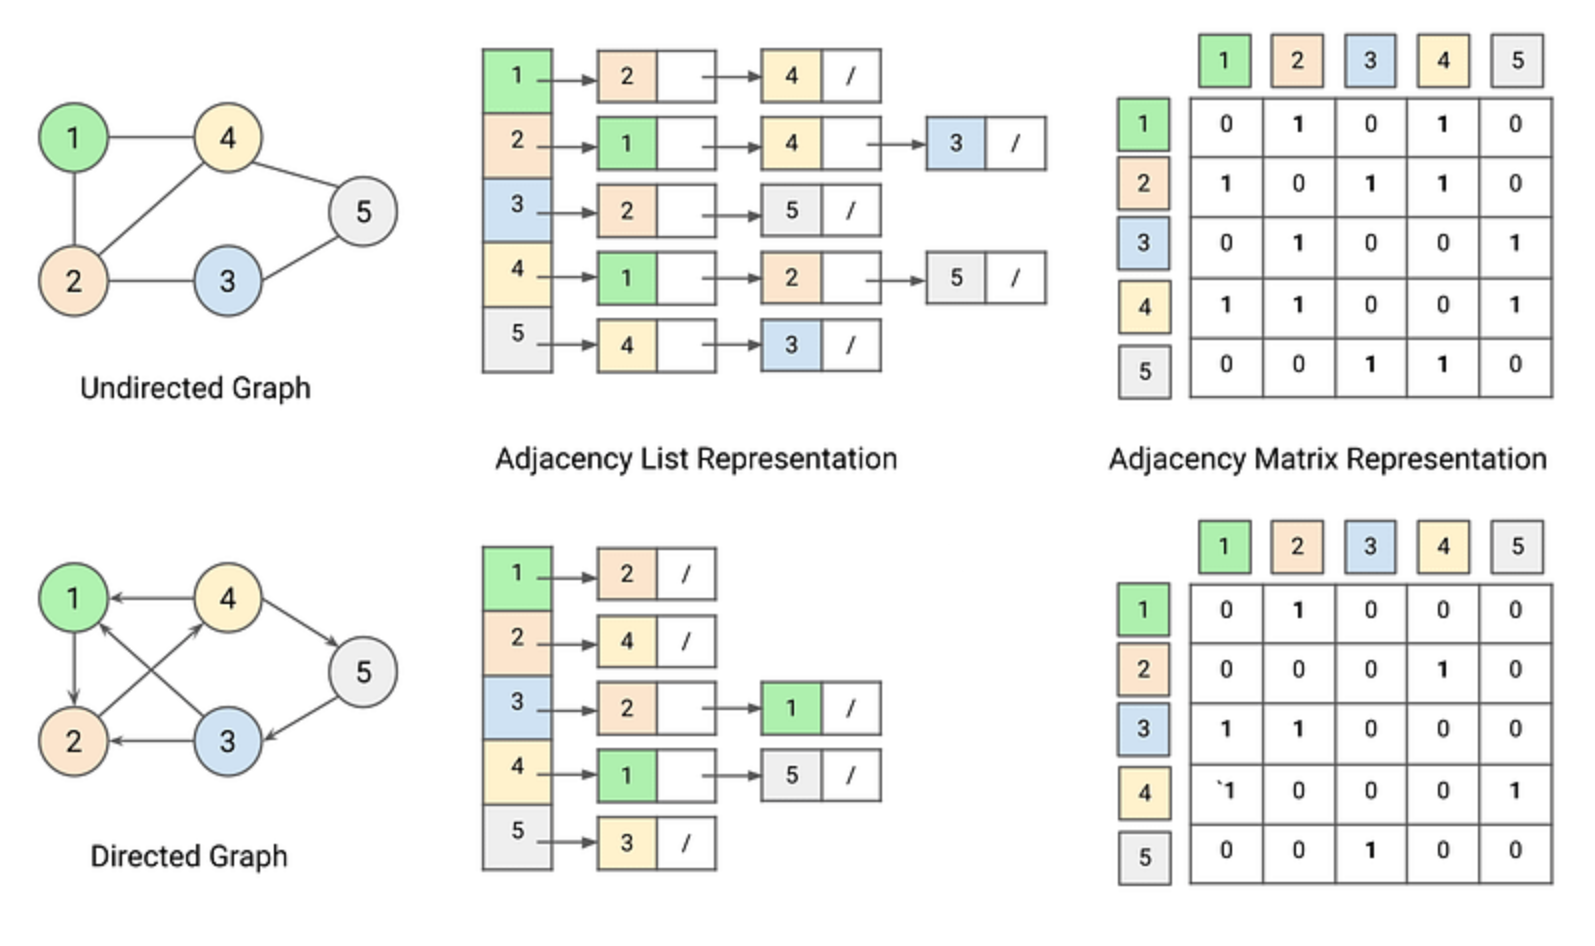
At the most basic level, a graph consists of nodes and edges. Nodes represent entities such as users, products, or devices. Edges represent relationships between those entities. These relationships may be directed or undirected depending on whether the connection has a specific direction.
Graphs can also include properties attached to nodes and edges. These properties store additional information about entities and relationships, such as timestamps, weights, or attributes. Property graphs are widely used in modern graph databases because they provide flexibility in representing real-world systems.
Another key concept is graph traversal. Traversal refers to the process of moving through nodes and edges to explore connections within the graph. Many graph queries rely on traversal techniques to discover paths or patterns between entities.
Connectivity and centrality are also essential ideas in graph analytics. Connectivity measures how nodes are linked within the network, while centrality measures how important or influential a node is relative to others. These metrics help analysts identify key players in a network.
Understanding these core concepts provides the foundation for applying graph algorithms and interpreting their results effectively.
How Graph Analytics Processes Connected Data
Graph analytics processes connected data by transforming raw relationships into mathematical structures that algorithms can analyze. This process begins with representing the graph in a format suitable for computation.
One common representation is the adjacency list, where each node maintains a list of its connected neighbors. Another is the adjacency matrix, which represents connections between nodes using a matrix of values. The choice of representation affects performance and scalability when analyzing large networks.
Once the graph structure is defined, analysis proceeds on two fronts: applying algorithms and performing multi-hop traversals and pattern matching. Algorithms examine patterns such as how frequently nodes interact, how densely groups of nodes connect, or how information flows through the network. Meanwhile, multi-hop traversals and pattern matching explore connections across multiple steps and identify subgraph patterns that match specific relationship structures.
The computational complexity of graph analytics can be significant, particularly when analyzing large networks with millions or billions of nodes. For this reason, many systems use distributed computing or GPU acceleration to process graph algorithms more efficiently.
The overall workflow typically includes graph construction, algorithm execution, and result interpretation. Each stage transforms raw network data into insights about structure, influence, or similarity within the graph.
Major Graph Analytics Algorithms
Building on the foundational concepts of nodes, edges, properties, and traversal, graph analytics leverages specialized algorithms to extract insights from complex networks. These algorithms can be broadly categorized into classical algorithms and data-oriented techniques.
Classical Algorithms focus on fundamental graph problems. Traversal algorithms like Depth-First Search (DFS) and Breadth-First Search (BFS) explore networks to identify paths and connected components. Shortest path algorithms, including Dijkstra, Bellman-Ford, and Floyd-Warshall, determine the minimum distance or cost between nodes, critical for routing and logistics. Minimum spanning tree algorithms, such as Kruskal and Prim, optimize network connectivity by linking all nodes with minimal total edge weight. Other classical algorithms, including network flow and topological sort, support resource allocation, scheduling, and dependency analysis.
Data-Oriented Algorithms analyze the structure and influence of entities within a network. Centrality measures, like PageRank, betweenness, closeness, and eigenvector centrality, identify the most influential nodes. Community detection algorithms, including Louvain and label propagation, reveal clusters or densely connected subgroups within networks. Graph embedding techniques like Node2Vec and DeepWalk transform nodes into vector representations, enabling machine learning applications and similarity analysis.
By combining these algorithms with graph traversal and connectivity metrics, analysts can uncover influential entities, hidden communities, optimal paths, and structural patterns in diverse domains, from social networks and supply chains to fraud detection and biological systems.
Examples of Graph Analytics
To illustrate how graph analytics works in practice, we present two examples that demonstrate different aspects of analyzing interconnected systems: one emphasizing graph algorithms, and the other highlighting multi-hop queries and pattern matching.
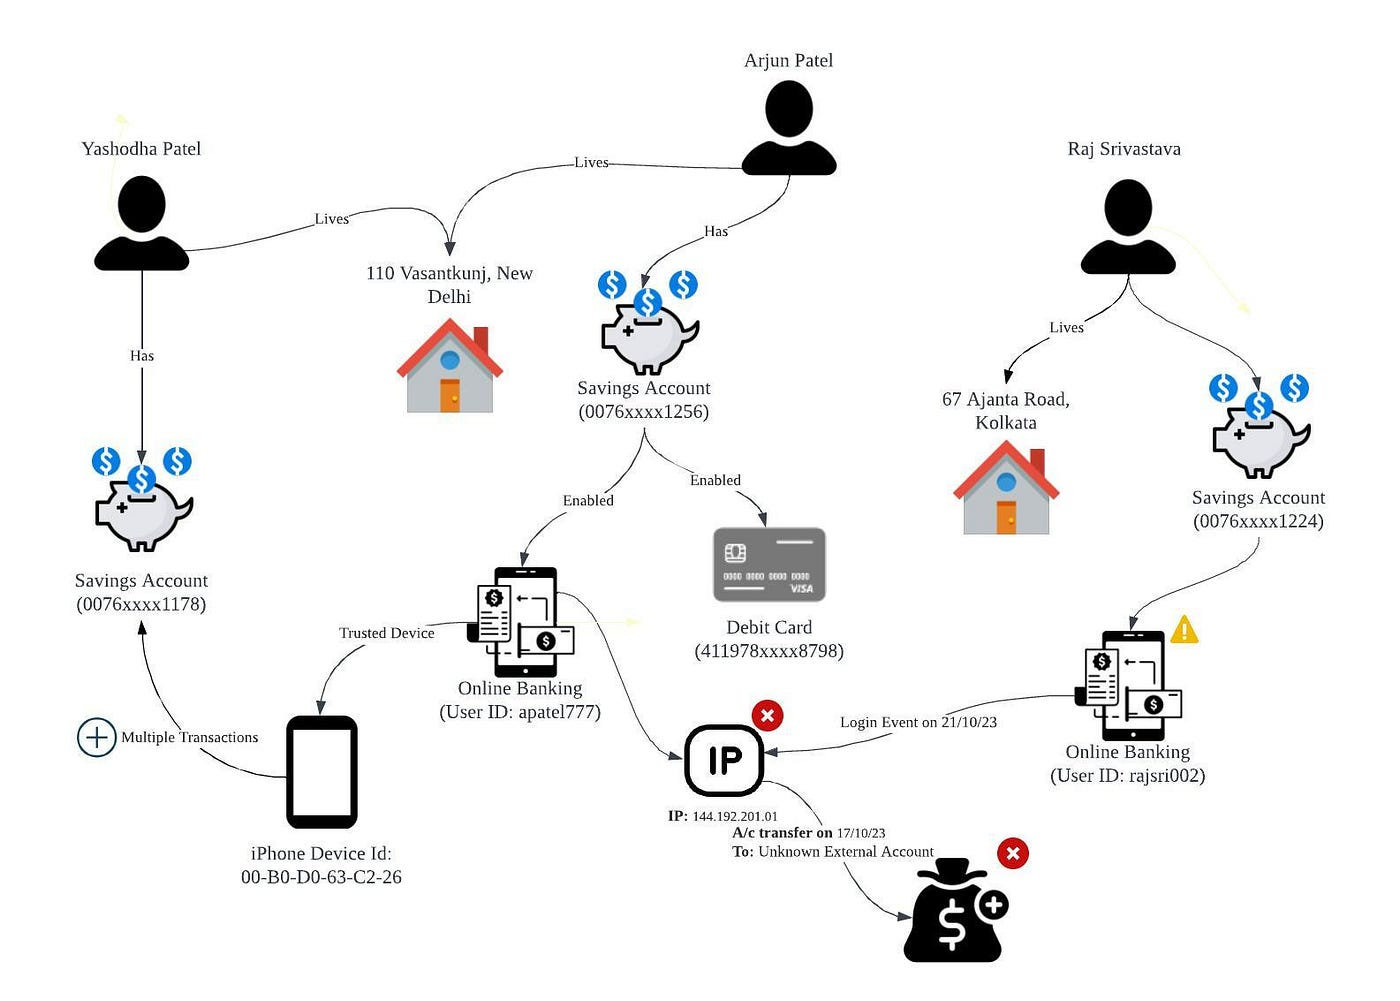
1. Cybersecurity Threat Detection
In a cybersecurity network, entities such as devices, users, IP addresses, and login events are represented as nodes, while connections such as network traffic, access attempts, or shared credentials are modeled as edges. Each edge may carry attributes like timestamp, event type, or severity.
Analysts use multi-hop traversals to track indirect relationships across the network, such as chains of suspicious logins or lateral movements of an attacker. Pattern matching allows them to detect specific structures, for example, a sequence of failed logins followed by a successful login from multiple devices, which could indicate credential compromise.
By querying for these patterns, analysts can uncover hidden attack paths, identify compromised devices, and proactively respond to threats. Graph query languages like Cypher or Gremlin make expressing these complex traversals and structural patterns straightforward, enabling efficient detection of multi-step attack scenarios.
2. Social Media Influence Analysis
In a social media network, entities such as users, posts, and interactions are represented as nodes, while relationships such as follows, likes, or shares are modeled as edges. Each edge may carry attributes like interaction frequency, type, or timestamp.
Analysts use graph algorithms to measure the importance of users within the network. Centrality metrics such as PageRank or eigenvector centrality help identify highly influential users who play a significant role in spreading information.
Community detection algorithms like Louvain or label propagation are then applied to identify clusters of users who interact frequently. By examining connections between these communities, analysts can detect key bridging users who connect otherwise separate groups.
By analyzing these structures, marketers or platform managers can better understand how information spreads through the network, identify influential users who amplify content, and discover highly engaged communities. Visualization techniques such as force-directed layouts can further highlight high-centrality nodes and densely connected groups, making influence patterns easier to interpret.
Steps for Implementing Graph Analytics
Implementing graph analytics typically involves several stages, each designed to transform raw data into meaningful insights. The process often begins with identifying the entities and relationships that define the network.
The first step is data modeling, where data is converted into nodes and edges. This stage requires careful design to ensure the graph accurately reflects the relationships present in the system. Entities such as users, devices, or products become nodes, while interactions become edges. In addition, data should be prepared for import into a graph database or a graph engine like PuppyGraph, which allows direct querying on existing data sources without full data migration.
The next step involves analyzing the network structure, which typically includes both running graph algorithms and performing multi-hop traversals and pattern matching. Graph algorithms, such as PageRank, community detection, shortest paths, and centrality metrics, provide insights into the overall structure of the network, while multi-hop traversals and pattern matching allow exploration of connections across multiple steps and the discovery of subgraph patterns that match specific relationship structures. Engines like PuppyGraph support both openCypher and Gremlin, enabling these queries to be expressed efficiently.
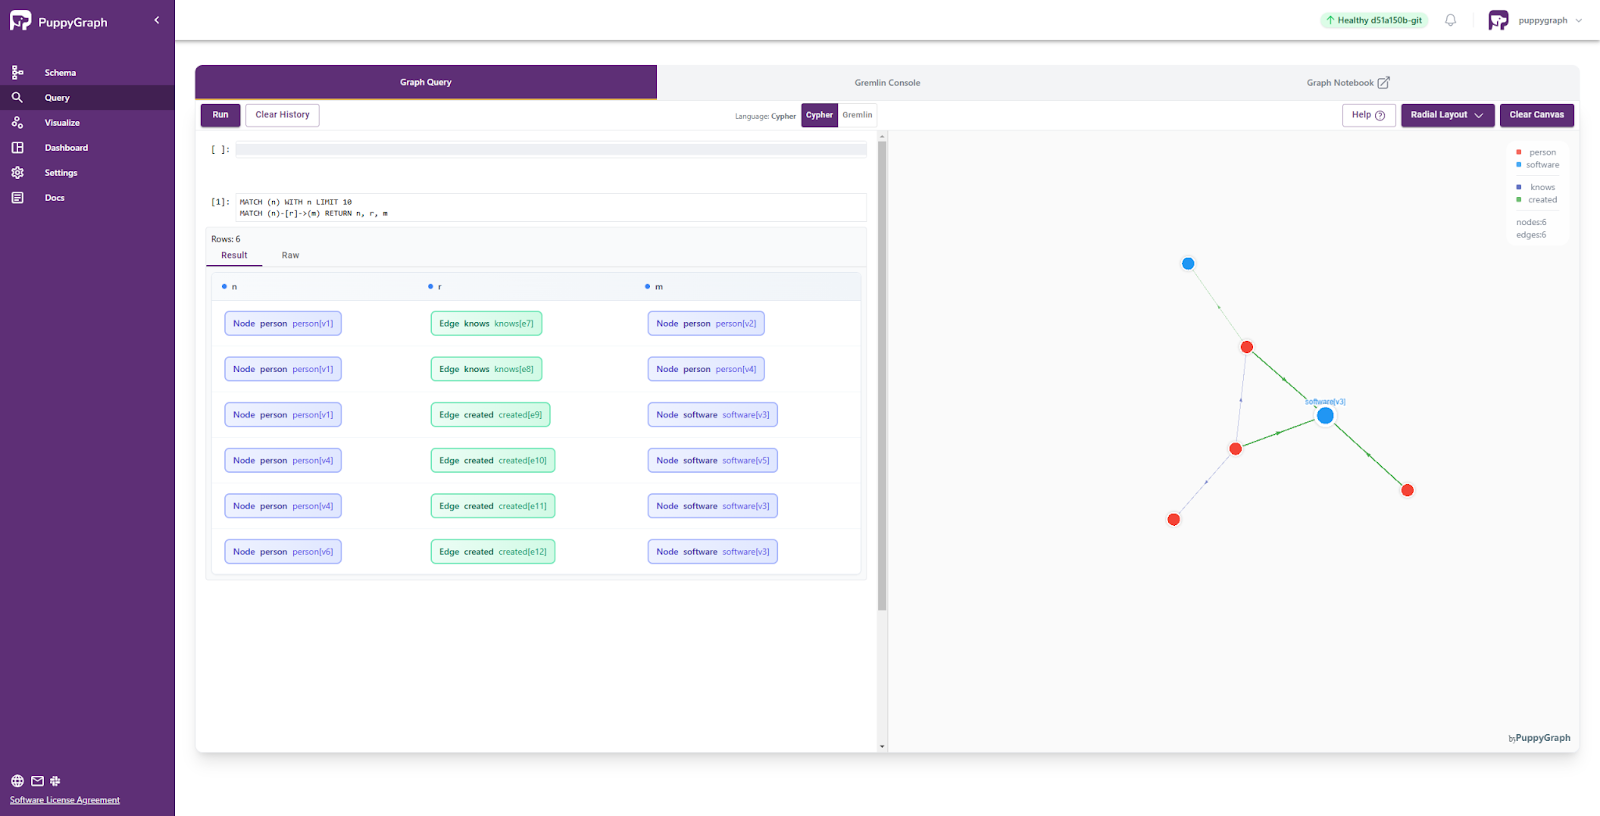
The final stage is interpretation and visualization. Graph visualization tools help analysts explore the results and communicate insights to stakeholders. This stage often involves dashboards or interactive visual interfaces that reveal how entities are connected within the network. For example, PuppyGraph provides a Query panel where users can run queries and view results visually, making it easier to identify patterns and key paths.
Conclusion
Graph analytics provides a powerful way to understand complex, interconnected data by focusing on relationships rather than isolated records. By representing entities as nodes and their interactions as edges, graph analytics enables organizations to explore network structures, trace multi-step connections, and detect meaningful patterns. Through algorithms such as centrality analysis, community detection, and shortest path computation, analysts can reveal influential entities, hidden clusters, and important structural relationships that traditional analytical approaches may overlook.
As modern data ecosystems continue to grow in scale and complexity, graph analytics is becoming an essential capability for organizations across industries. Platforms like PuppyGraph further simplify the adoption of graph analytics by enabling users to run graph queries directly on existing data sources without complex data migration. By combining graph algorithms, traversal queries, and interactive analysis tools, organizations can transform connected data into actionable insights and make more informed decisions in increasingly networked environments.
Explore the forever-free PuppyGraph Developer Edition, or book a demo to see it in action.

Hao Wu is a Software Engineer with a strong foundation in computer science and algorithms. He earned his Bachelor’s degree in Computer Science from Fudan University and a Master’s degree from George Washington University, where he focused on graph databases.

Get started with PuppyGraph!


Developer Edition
- Forever free
- Single noded
- Designed for proving your ideas
- Available via Docker install
Enterprise Edition
- 30-day free trial with full features
- Everything in developer edition & enterprise features
- Designed for production
- Available via AWS AMI & Docker install