

Graph Clustering: Methods & Algorithms
Graph clustering is a core technique in modern data analysis, helping organizations understand patterns hidden within complex networks. As digital systems grow more interconnected, data increasingly takes the form of relationships rather than isolated records. Social interactions, supply chains, financial transactions, and knowledge graphs all naturally form network structures. Clustering these structures allows analysts to group similar nodes, detect communities, and identify meaningful patterns that traditional tabular analysis may miss.
This article provides a practical and conceptual overview of graph clustering. It explains key techniques, highlights common algorithms, and explores how clustering integrates with machine learning workflows. You will also see real-world applications across industries and learn about challenges that emerge at large scale. Finally, the article discusses how graph-based analytics platforms can help teams run clustering workflows efficiently, even on complex distributed data sources. The goal is to provide both conceptual clarity and actionable understanding for practitioners working with connected data.
What Is Graph Clustering?
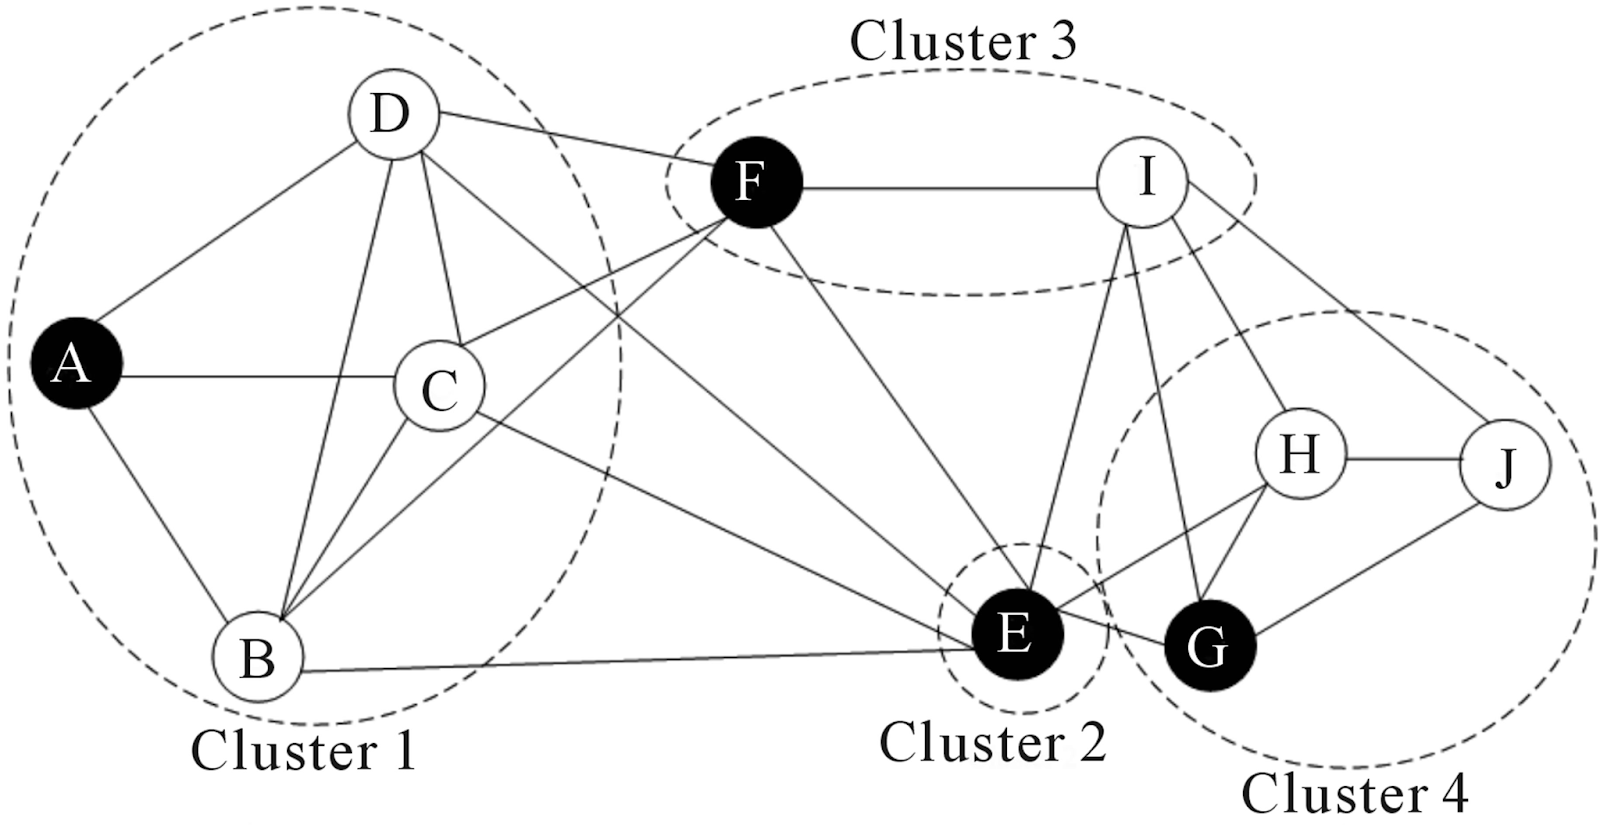
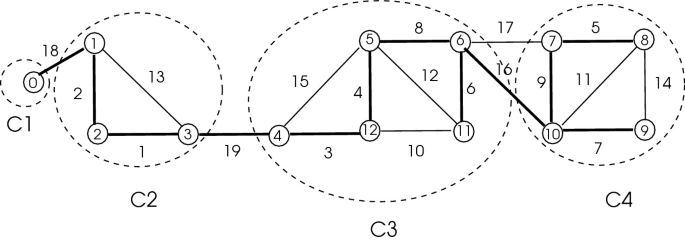
Graph clustering refers to the process of grouping nodes in a graph so that nodes within the same group are more densely connected to each other than to nodes outside the group. Unlike traditional clustering that operates on feature vectors, graph clustering emphasizes relationships and structural patterns. A cluster may represent a community in a social network, a group of related documents, or a set of highly interconnected services in an infrastructure graph.
In many real-world datasets, relationships carry more meaning than individual attributes. For example, two users who share many mutual connections may belong to the same community even if their personal attributes differ significantly. Graph clustering algorithms leverage adjacency, edge weights, and topology to identify these patterns. The structure of the graph becomes the primary signal guiding cluster formation.
Different types of graphs require different clustering approaches. Some graphs are undirected and unweighted, while others include directionality, timestamps, or complex edge properties. Algorithms must account for these variations to produce meaningful clusters. Additionally, clustering may aim for disjoint partitions or allow nodes to belong to multiple clusters, depending on the analytical goals and the nature of the data.
Graph clustering is often iterative and exploratory. Analysts may adjust algorithm parameters, evaluate modularity or density metrics, and compare multiple clustering outcomes. Visualization tools frequently help interpret clusters and validate whether the discovered structure reflects domain knowledge. As datasets grow more complex, graph clustering becomes an essential tool for uncovering hidden structure and organizing connected information.
Why Graph Clustering Matters
In modern analytics, understanding relationships is just as important as analyzing individual records. Graph clustering provides a way to extract higher-level structure from interconnected data. By identifying tightly connected groups, organizations gain insights into communities, functional modules, or behavioral segments that are otherwise difficult to detect through traditional analytics methods.
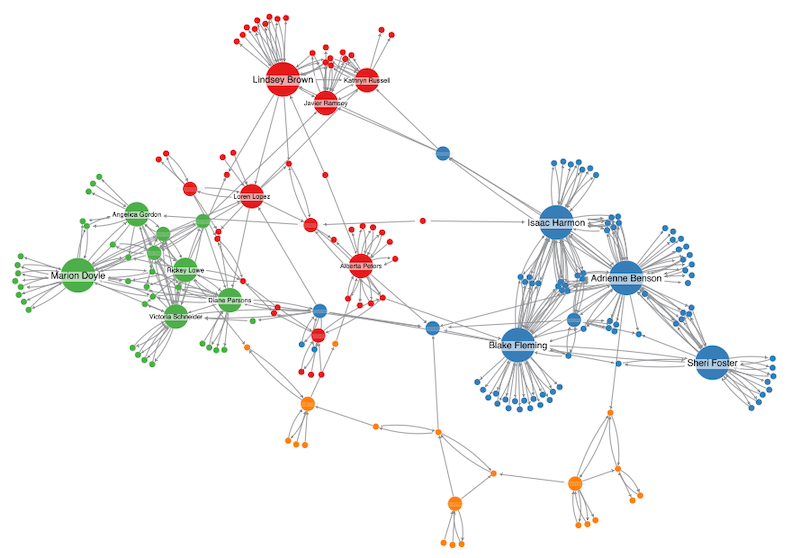
One reason graph clustering matters is its ability to reveal emergent patterns. In social networks, clusters may indicate interest groups or influence communities. In cybersecurity, clusters of suspicious connections may signal coordinated attacks. By grouping nodes based on connectivity rather than attributes alone, analysts can uncover patterns that reflect real-world interactions rather than predefined categories.
Graph clustering also improves data exploration and visualization. Large graphs can be overwhelming, with thousands or millions of nodes. Clustering reduces complexity by summarizing structure into manageable subgraphs. Analysts can focus on key communities or modules instead of analyzing the entire network at once. This hierarchical perspective helps teams understand large datasets more efficiently.
Another benefit is improved performance in downstream analytics. Machine learning models often perform better when input data is organized into meaningful segments. Clusters can be used as features, labels, or sampling units. For example, recommendation systems may use cluster membership to identify user groups with similar preferences. Beyond machine learning, clustering also supports operational analysis, such as identifying tightly connected business units, detecting coordinated risk patterns, or simplifying large network visualizations for executive reporting. By structuring data through clustering, organizations create a more interpretable and actionable foundation for advanced analytics and strategic decision-making.
Types of Graph Clustering Techniques
Graph clustering techniques vary depending on how they define similarity and how they divide the graph. Broadly speaking, they can be grouped into three main categories: structural methods, attribute-aware clustering, and probabilistic or statistical models.
Structural Methods
One broad category includes structural methods that rely primarily on network topology, such as edge density, node connectivity, modularity, or graph cuts. These methods typically attempt to maximize modularity or minimize edge cuts between clusters. Structural approaches are widely used because they require minimal additional information beyond the graph itself.
Community detection algorithms such as greedy modularity optimization (for example, the Louvain algorithm and the Leiden algorithm) fall into this category. Label propagation is another example, where nodes iteratively adopt the most frequent label among their neighbors until stable communities emerge. Flow-based approaches such as the Infomap algorithm simulate random walks and identify regions where information tends to remain due to dense connectivity.
Spectral techniques also belong to the structural category. Spectral clustering transforms the graph into a matrix representation, such as the graph Laplacian, and applies eigenvalue decomposition to identify partitions that optimize connectivity patterns. These methods are effective for detecting non-obvious structures and work well when graphs exhibit complex global patterns.
Attribute-Aware Clustering
Another category focuses on attribute-aware clustering. In many datasets, nodes carry metadata such as demographics, product categories, textual features, or embeddings. Attribute-aware methods combine structural similarity with attribute similarity to create more nuanced clusters.
This hybrid approach is common in recommendation systems and knowledge graph analysis, where both relationships and semantic attributes matter. Techniques may extend traditional algorithms by incorporating feature similarity into the objective function or by combining graph embeddings with vector-based clustering methods such as k-means.
Graph neural networks (GNNs) increasingly support attribute-aware clustering. Models such as Deep Graph Infomax, Graph Auto-Encoder, and attention-based architectures like Graph Attention Network (GAT) learn node embeddings that capture both structural context and node features. Clustering is then performed in the learned embedding space, often using k-means or hierarchical clustering. Some end-to-end deep clustering models jointly optimize representation learning and cluster assignments, improving performance on large attributed graphs.
Probabilistic and Statistical Models
Probabilistic and statistical models represent a third major category of graph clustering approaches. Unlike purely structural methods that optimize a score (such as modularity) or embedding-based methods that rely on geometric representations, these approaches assume that clusters arise from an underlying generative process. The goal is not only to partition nodes, but to explain how the observed network could have been generated.
Stochastic block models are a common example. The Stochastic Block Model (SBM) assumes that each node belongs to one of \( K \) (sometimes inferred) latent communities, and that edges are generated randomly according to community-level connection probabilities. Concretely, if node \( i \) has community label \( z_i \), and \( B_{ab} \) denotes the probability of an edge between communities \( a \) and \( b \), then edges are drawn independently with probability
\[P(A_{ij}=1 \mid z_i=a, z_j=b)=B_{ab}.\]
Given an observed adjacency matrix \( A \), the task is to infer both the hidden community assignments \( z \) and the probability matrix \( B \) by maximizing the likelihood
\[P(A \mid z, B)=\prod_{i < j} B_{z_i z_j}^{A_{ij}} (1-B_{z_i z_j})^{1-A_{ij}}.\]
For inference, one widely used strategy is the Expectation-Maximization (EM) algorithm. In the E-step, the model estimates the probability that each node belongs to each community. In the M-step, it updates \( B \) to maximize the expected log-likelihood. Bayesian variants instead place priors on \( z \) and \( B \), and use variational inference or Markov Chain Monte Carlo (MCMC) to approximate the posterior distribution \( P(z, B \mid A) \). These methods naturally provide uncertainty estimates.
When the number of communities \( K \) is unknown, it can be selected using model selection criteria such as Minimum Description length (MDL) and Bayesian Inference criterion (BIC), by fitting the model for several candidate values of \( K \) and penalizing model complexity. Alternatively, Bayesian nonparametric approaches place a Dirichlet process prior over community assignments, allowing new communities to be created during MCMC sampling so that the effective number of groups adapts automatically to the data.
Because such models are explicitly probabilistic, they produce interpretable parameters that describe how communities interact and can quantify uncertainty in assignments. This makes them particularly valuable in scientific and research settings, where understanding the generative mechanism behind network structure is just as important as identifying the clusters themselves.
Each technique offers trade-offs in interpretability, computational complexity, and scalability. Structural methods are often efficient and scalable, attribute-aware methods provide richer semantic grouping, and probabilistic models offer interpretability and uncertainty estimation. As a result, algorithm selection depends heavily on the specific analytical context, data characteristics, and operational constraints.
Community Detection Algorithms
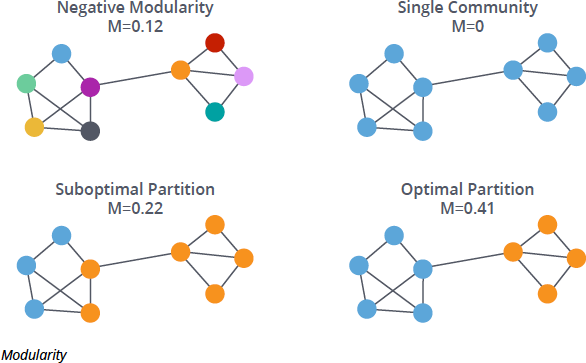
Community detection algorithms are among the most widely used approaches in graph clustering. These algorithms aim to find groups of nodes that are more densely connected internally than externally. A common strategy is modularity optimization, where algorithms iteratively adjust cluster assignments to maximize a score reflecting the strength of community structure within the network.
One widely used method is the Louvain algorithm, which optimizes modularity through an iterative two-phase process: nodes are locally reassigned to neighboring communities if modularity increases, and then communities are aggregated into super-nodes to form a smaller graph. This process repeats until no further improvement is possible. Its refinement, the Leiden algorithm, improves stability and guarantees better-connected communities.
Another approach uses label propagation, where nodes iteratively adopt the most common label among their neighbors until stable communities emerge. Because updates rely only on local neighborhood information, label propagation is computationally lightweight and scales efficiently to very large graphs. These methods are relatively efficient and scale well to large graphs, making them suitable for real-time analytics environments.
Flow-based algorithms offer another perspective by modeling how information diffuses through the network. Methods such as Infomap simulate random walks on the graph and analyze the paths taken by a walker over time. The intuition is that in a well-defined community, a random walk tends to remain within that region for longer periods before transitioning to another part of the graph. By compressing the description of these walk trajectories using information-theoretic principles, the algorithm identifies partitions that best capture flow persistence. Communities therefore emerge as regions where movement is “trapped” due to dense internal connectivity and relatively sparse external links. Such approaches can reveal hierarchical structure and, in some variants, overlapping communities that simpler modularity-based methods might miss.
Hierarchical vs Partition-Based Clustering
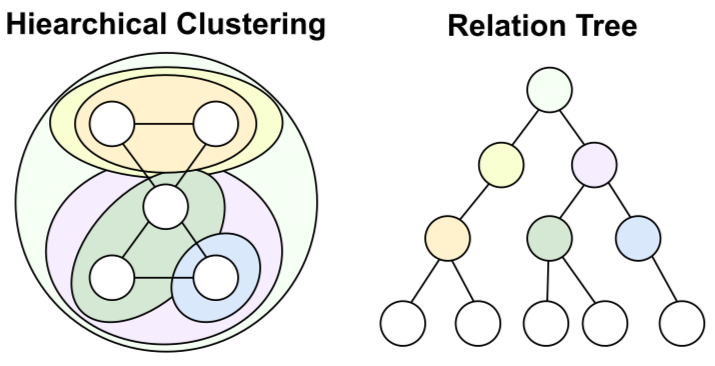
Hierarchical clustering introduces a different perspective compared with the partition-based approaches discussed earlier. Instead of producing a single flat segmentation, hierarchical clustering builds a multi-level structure in which clusters are nested within larger clusters. In other words, a large community may contain several smaller subcommunities, and those subcommunities may themselves contain even more fine-grained groups. The result is a tree-like organization that captures structure at multiple resolutions.
This hierarchy can be constructed either bottom-up (agglomerative), where small clusters are progressively merged into larger ones, or top-down (divisive), where a large cluster is recursively split into smaller groups. For example, in a social network, a broad “technology” community might contain subclusters such as “AI researchers” and “startup founders,” which could further divide into more specialized groups. The key idea is that clustering is not limited to one level: analysts can move up or down the hierarchy depending on how coarse or fine-grained they want the analysis to be.
Partition-based clustering, as described in earlier sections, focuses on producing a single-level partition of the graph according to a chosen optimization objective. Rather than constructing a multi-level structure, it outputs one segmentation that reflects the best solution under the defined criterion. This makes it straightforward to interpret and integrate into downstream analytics pipelines.
Hierarchical methods often provide richer insights because they capture multi-scale structure. Analysts can observe how clusters relate across levels, helping identify core communities and peripheral nodes. However, hierarchical clustering can be computationally expensive for very large graphs, requiring careful optimization or sampling techniques to remain practical.
Partition-based methods, in contrast, prioritize producing a clear and stable segmentation under a specific objective. They are often more computationally efficient and easier to operationalize at scale. Choosing between hierarchical and partition-based approaches depends on analytical goals, data size, and whether multi-level structural insight or a single, well-defined segmentation is more important for the use case.
Graph Clustering in Machine Learning
Graph clustering is often used as a downstream step that feeds into machine learning workflows. In other words, clustering first extracts structural groups from a graph, and the resulting cluster assignments are then incorporated into predictive models. The machine learning model does not perform clustering itself; instead, it consumes the cluster structure as additional input.
Clusters can serve as features that represent community membership. Concretely, once a clustering algorithm assigns each node to a community, that assignment can be encoded as a categorical feature, a one-hot vector, or an embedding derived from the cluster structure.
For example, in a fraud detection setting, the graph may represent accounts as nodes and transactions as edges. Clustering groups together accounts that transact frequently with each other. If many suspicious transactions occur within the same cluster, the model can treat cluster membership as a risk signal. Instead of evaluating each transaction independently, the classifier now incorporates the structural context: whether an account belongs to a tightly connected transaction group, how dense that group is, and how it interacts with other clusters. The cluster assignment thus becomes part of the feature engineering pipeline before model training.
Graph neural networks (GNNs) incorporate clustering concepts primarily for scalability and controlled information propagation. Large graphs are often partitioned into clusters that serve as mini-batches during training. Instead of sampling arbitrary nodes, the training process loads one cluster (a densely connected subgraph) at a time, preserving local connectivity while reducing memory requirements. This makes distributed computation more efficient because each worker processes a coherent subgraph.
Clusters can also define neighborhoods at a higher level: message passing can be restricted within clusters for certain layers, or cross-cluster edges can be treated differently to control how far information spreads. In effect, clustering shapes the receptive field of the model, determining which nodes exchange information frequently and which interactions are attenuated. This helps balance expressive power with computational efficiency, especially in very large graphs.
Applications of Graph Clustering
Graph clustering is widely used across industries because many real-world systems naturally form networks. In social media analysis, clustering identifies communities based on shared interests or interaction patterns. Marketing teams use these insights to tailor campaigns and understand audience segmentation. Similarly, communication networks benefit from clustering to detect groups of users with frequent interactions or shared behaviors.
In finance, graph clustering helps uncover suspicious transaction networks and potential fraud rings. Clusters of accounts that frequently transfer funds among themselves may signal coordinated activity. Analysts can use clustering results to prioritize investigations and monitor evolving threats. This approach complements rule-based systems by capturing complex relationship patterns that static rules might miss.
Knowledge management and information retrieval represent another important domain. Clustering related documents, entities, or concepts allows organizations to organize large knowledge graphs into meaningful thematic groups. This improves search relevance and supports advanced analytics, enabling teams to extract insights from vast interconnected datasets with greater clarity and precision.
Challenges in Large-Scale Graph Clustering
As graphs grow larger and more complex, clustering becomes computationally challenging. Large-scale networks may contain billions of edges, making traditional algorithms too slow or memory-intensive. Distributed processing frameworks and approximate algorithms help address these challenges, but they introduce trade-offs between accuracy and performance that analysts must carefully manage.
Another challenge is dynamic data. Many real-world graphs evolve continuously, with new nodes and edges appearing over time. Static clustering methods may quickly become outdated, requiring incremental or streaming algorithms that update clusters without recomputing the entire graph. Maintaining stability while adapting to change is a key concern in operational analytics environments.
Data quality also affects clustering outcomes. Missing edges, noisy connections, or biased sampling can distort cluster structures. Analysts must perform preprocessing and validation to ensure that clustering results reflect meaningful patterns rather than artifacts of incomplete data. Visualization and domain expertise remain essential for interpreting results and avoiding misleading conclusions.
Finally, evaluating cluster quality is inherently complex. Metrics such as modularity, conductance, or normalized cut provide quantitative measures, but they may not fully capture domain-specific relevance. Balancing algorithmic evaluation with human interpretation is critical, especially when clustering results inform high-stakes decisions in areas like security, finance, or healthcare analytics.
How PuppyGraph Helps in Graph Clustering
In real-world deployments, graph clustering often involves multiple data sources, distributed storage systems, and evolving schemas. These workflows need to integrate with heterogeneous environments while maintaining performance and flexibility. PuppyGraph simplifies this process by allowing analysts to run clustering algorithms directly on existing datasets without building separate data pipelines.
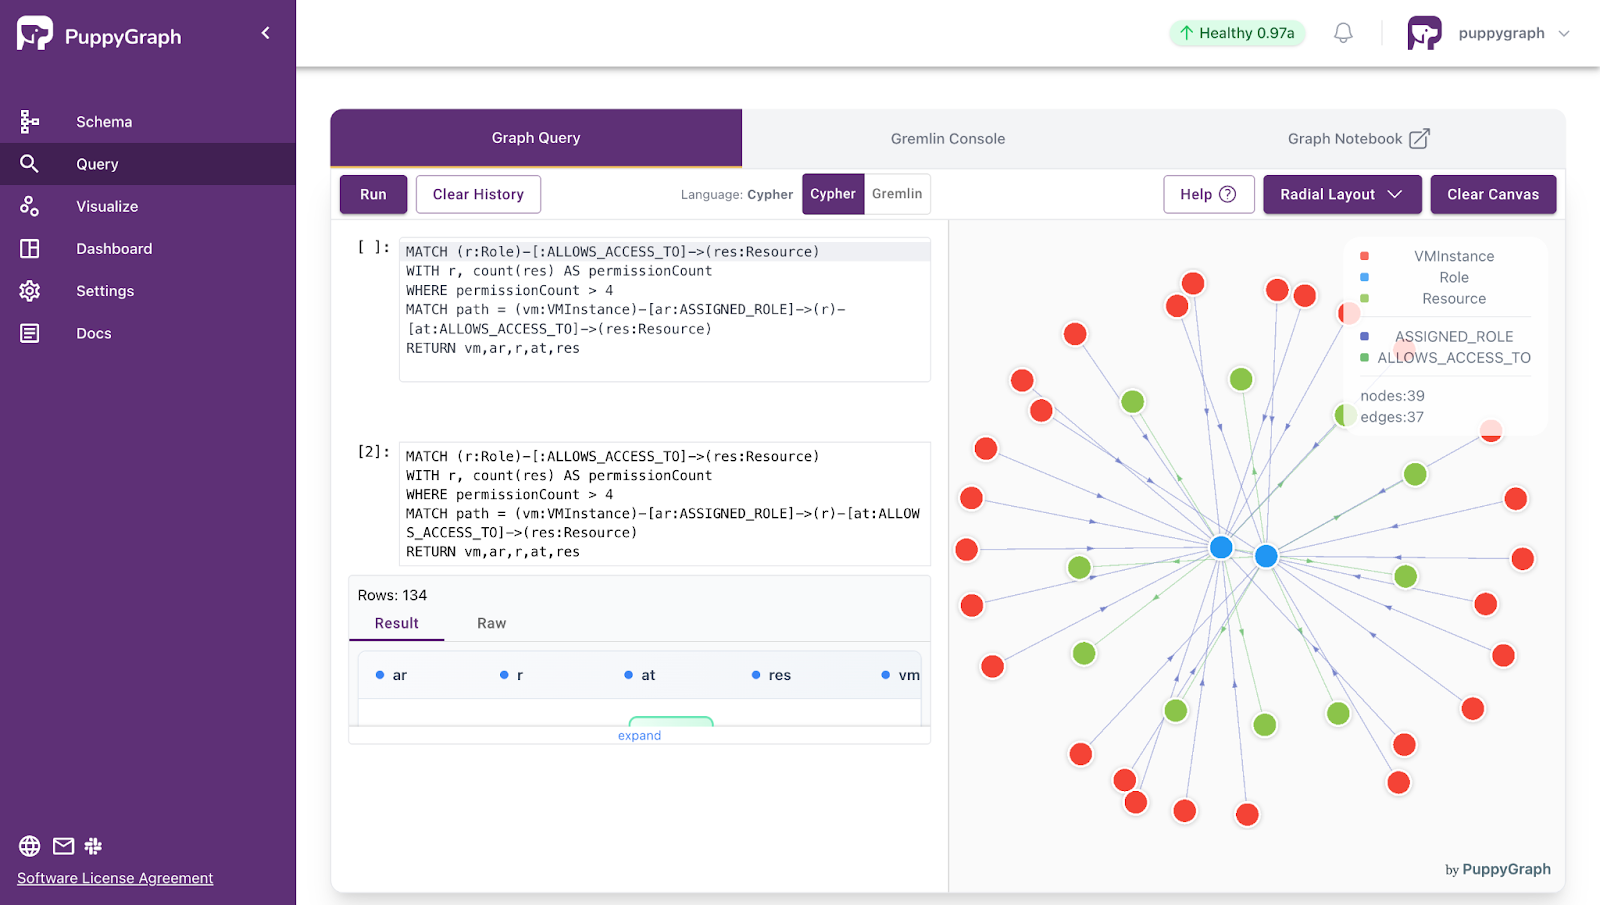
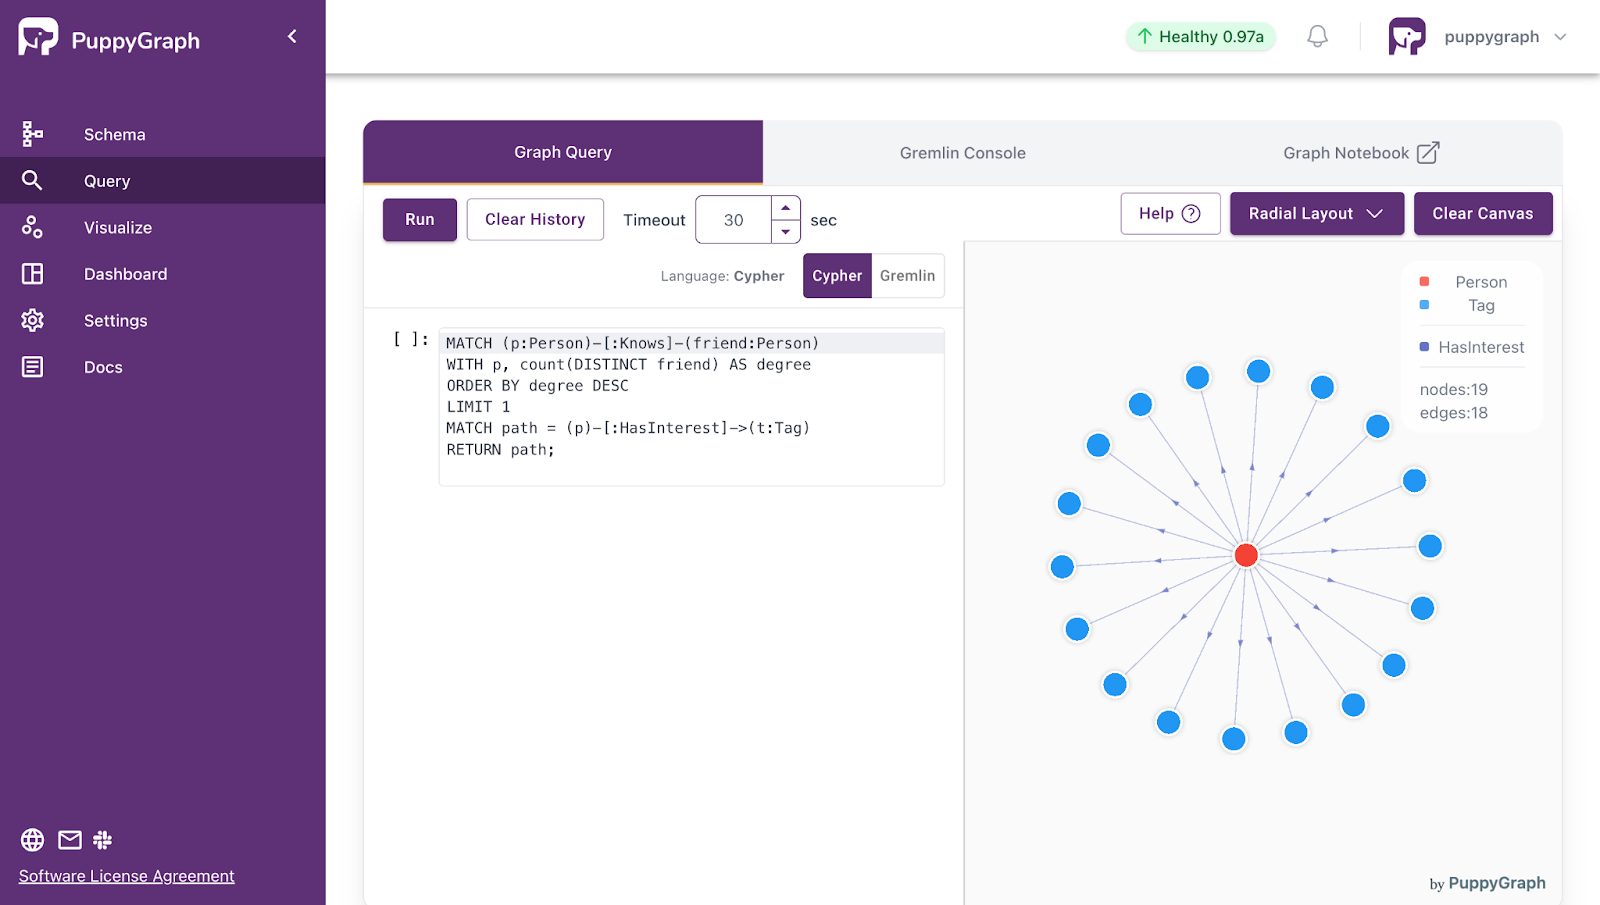
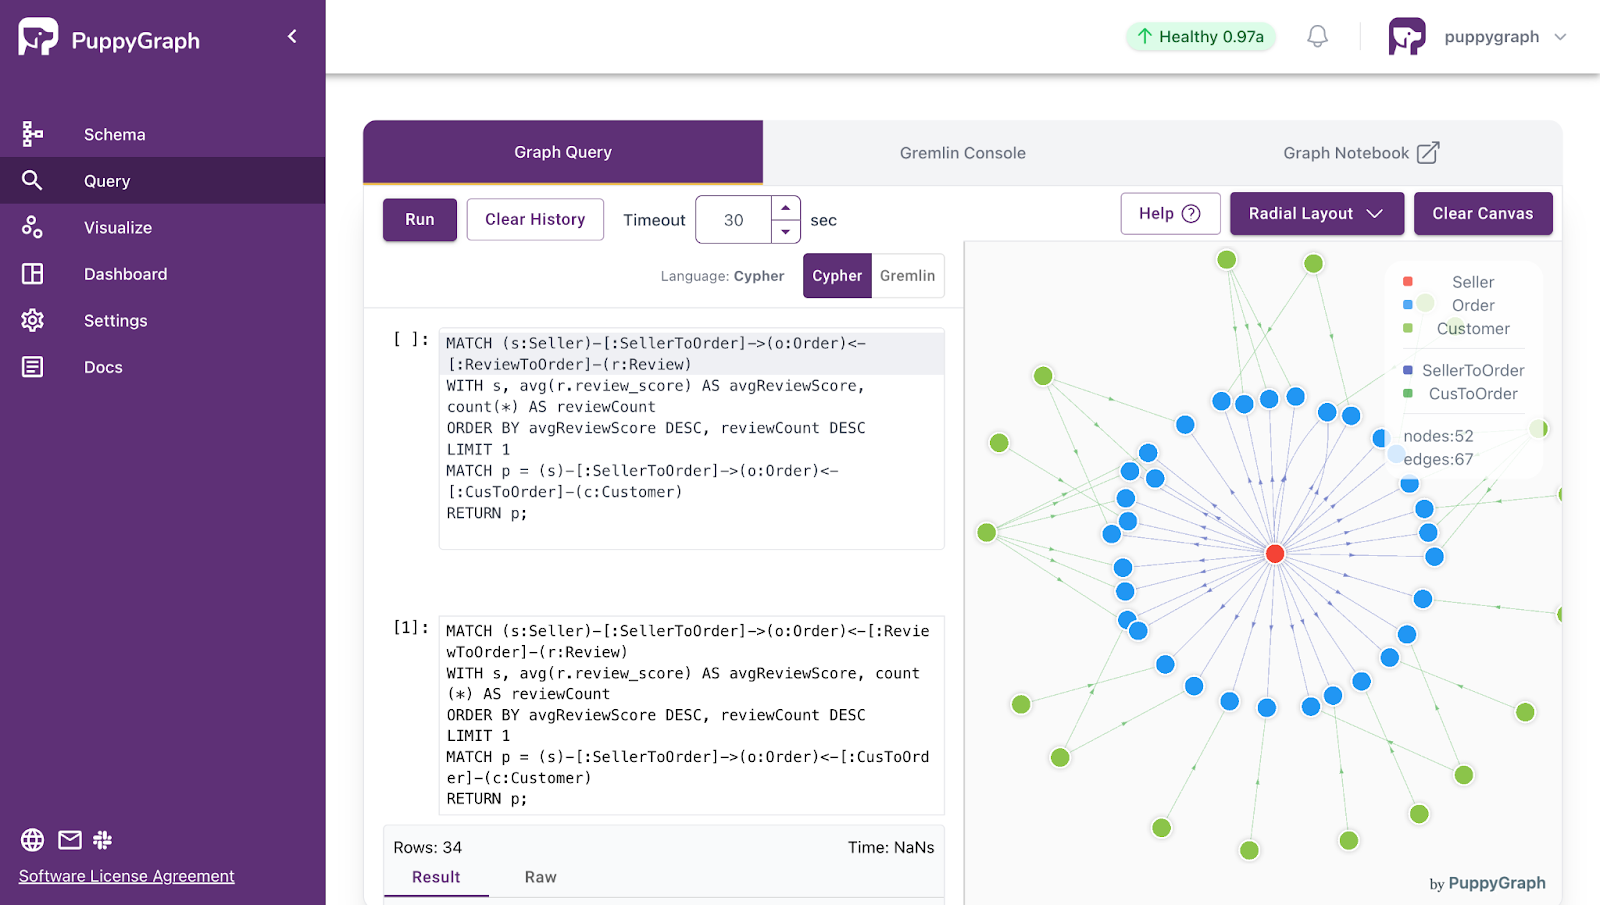
PuppyGraph uses a graph schema to define how tabular data should be interpreted as a graph. The schema specifies which tables represent vertices and edges, how columns map to identifiers and attributes, and how relationships are constructed. After uploading the schema, you can query the graph using openCypher or Gremlin, or invoke built-in algorithms with openCypher or Gremlin syntax.
PuppyGraph provides two built-in algorithms for community detection and graph structure analysis: Louvain Community Detection and Label Propagation Algorithm (LPA). These algorithms serve different purposes and are suitable for different types of graph analytics scenarios.
The Louvain Community Detection algorithm is designed to detect hierarchical community structures by optimizing modularity. It works by iteratively grouping nodes into communities and then compressing communities into super-nodes to further refine the structure. This is useful for identifying tightly connected user groups, collaboration clusters, or functional modules in large networks. The algorithm assigns each node a communityId representing its community membership.
To run Louvain, you can use either Gremlin or openCypher syntax. A simple example in Cypher looks like this:
CALL algo.louvain({
    labels: ['User'],
    relationshipTypes: ['LINK'],
    maxIterations: 30,
    relationshipWeightProperty: 'weight',
    maxLevels: 1,
    threshold: 0.0001,
    largeCommunityThreshold: 10000,
    seed: 42
    }) YIELD id, communityId
RETURN id, communityId
The Label Propagation Algorithm (LPA), on the other hand, is a lightweight and scalable community detection approach. It works by assigning an initial label to each node and then repeatedly updating node labels based on the most frequent label among neighbors until the system stabilizes. This method is especially useful for large-scale graphs where fast approximate community detection is required.
Here is an example usage in Cypher:
CALL algo.labelPropagation({
    labels: ['User'],
    relationshipTypes: ['LINK'],
    relationshipWeightProperty: 'weight',
    labelProperty: 'tag'
    }) YIELD id, communityId
RETURN id, communityId
Both algorithms scale to large datasets and can optionally export results directly to object storage for downstream analytics and machine learning workflows.

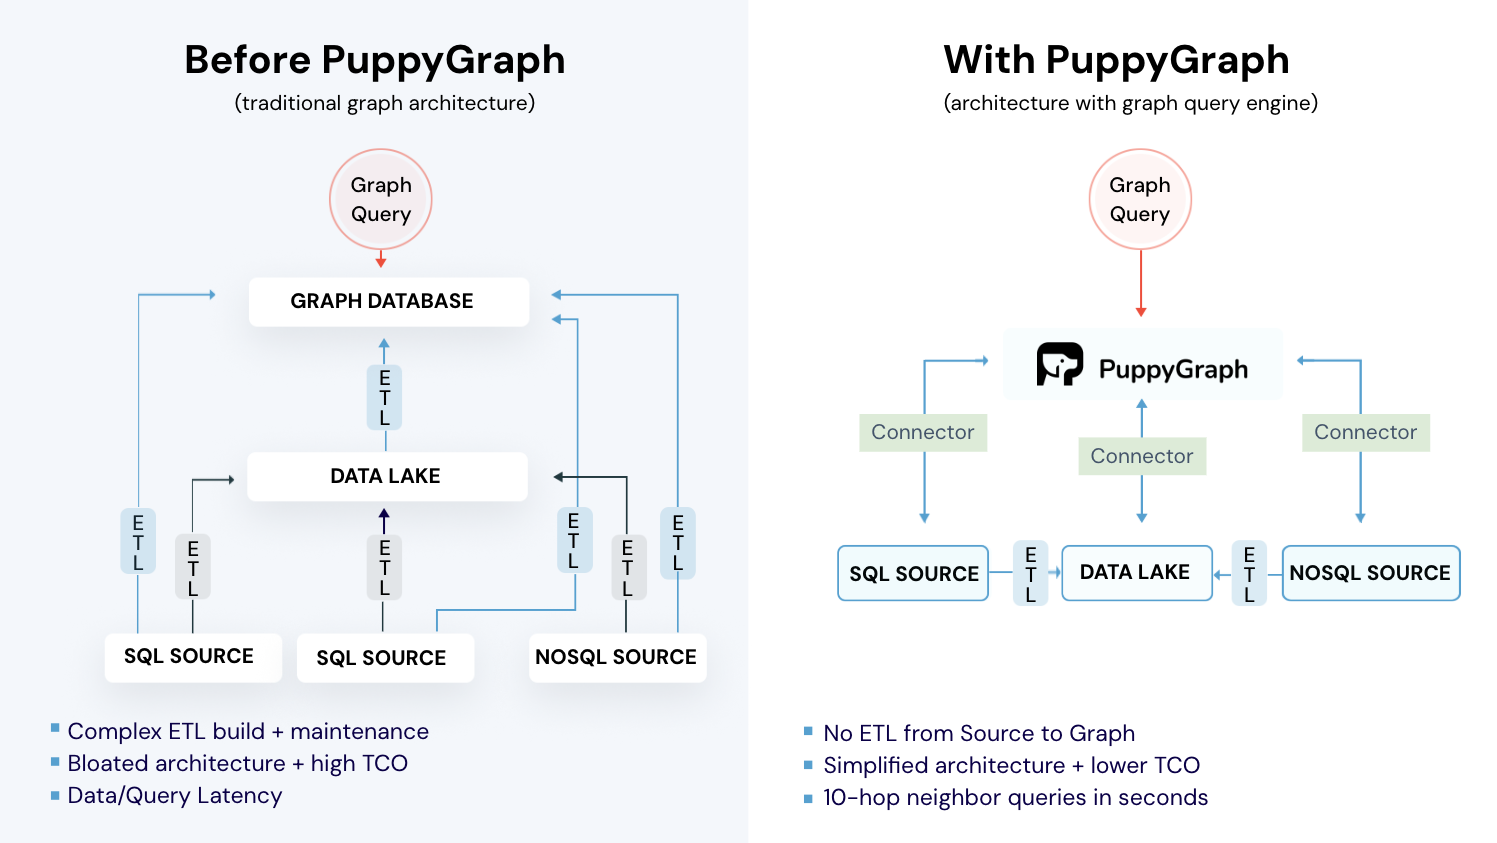
PuppyGraph is the first and only real time, zero-ETL graph query engine in the market, empowering data teams to query existing relational data stores as a unified graph model that can be deployed in under 10 minutes, bypassing traditional graph databases' cost, latency, and maintenance hurdles.
It seamlessly integrates with data lakes like Apache Iceberg, Apache Hudi, and Delta Lake, as well as databases including MySQL, PostgreSQL, and DuckDB, so you can query across multiple sources simultaneously.

Key PuppyGraph capabilities include:
- Zero ETL: PuppyGraph runs as a query engine on your existing relational databases and lakes. Skip pipeline builds, reduce fragility, and start querying as a graph in minutes.
- No Data Duplication: Query your data in place, eliminating the need to copy large datasets into a separate graph database. This ensures data consistency and leverages existing data access controls.
- Real Time Analysis: By querying live source data, analyses reflect the current state of the environment, mitigating the problem of relying on static, potentially outdated graph snapshots. PuppyGraph users report 6-hop queries across billions of edges in less than 3 seconds.
- Scalable Performance: PuppyGraph’s distributed compute engine scales with your cluster size. Run petabyte-scale workloads and deep traversals like 10-hop neighbors, and get answers back in seconds. This exceptional query performance is achieved through the use of parallel processing and vectorized evaluation technology.
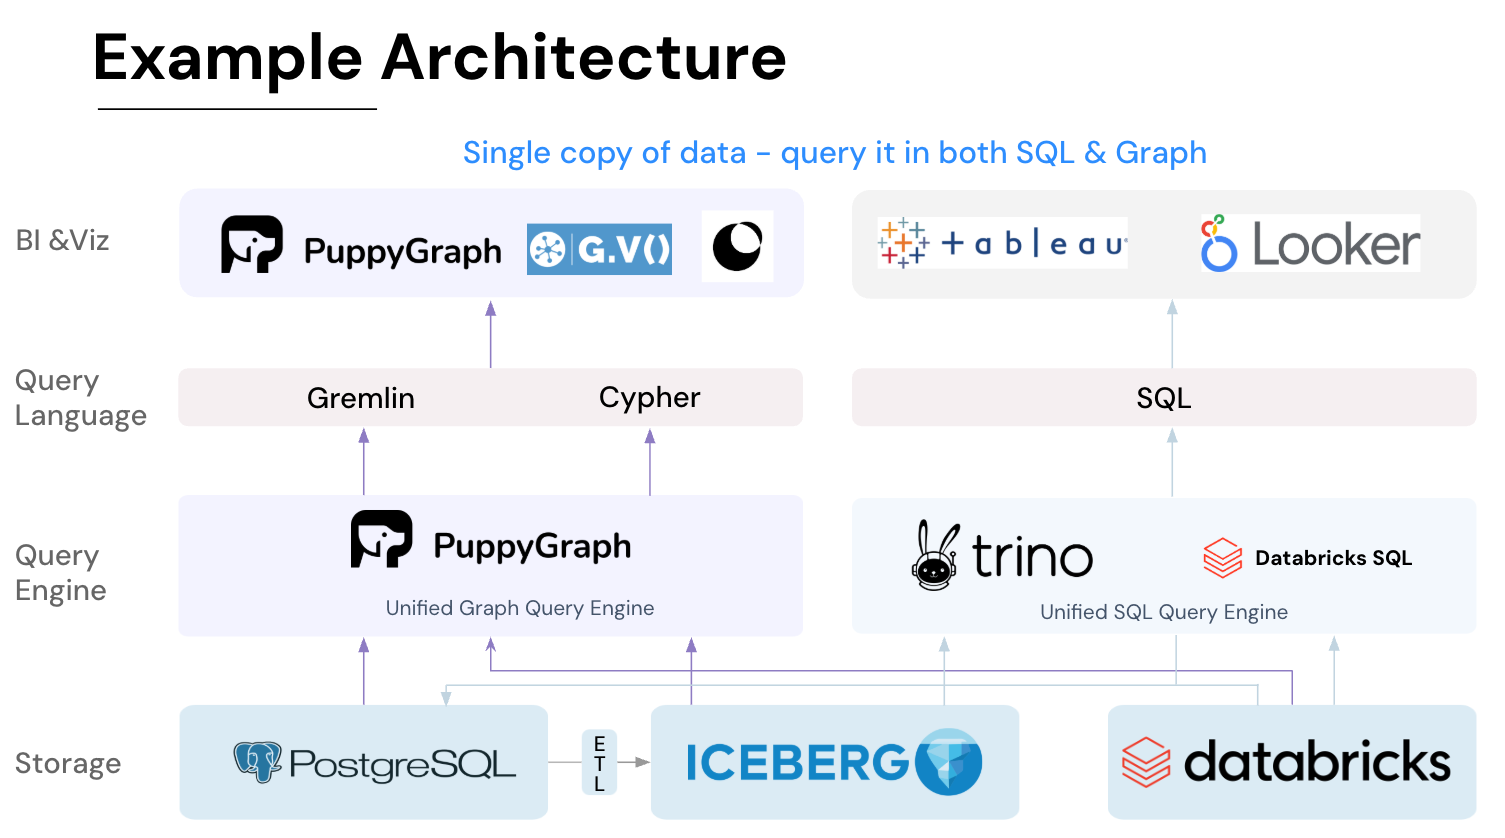
- Best of SQL and Graph: Because PuppyGraph queries your data in place, teams can use their existing SQL engines for tabular workloads and PuppyGraph for relationship-heavy analysis, all on the same source tables. No need to force every use case through a graph database or retrain teams on a new query language.
- Lower Total Cost of Ownership: Graph databases make you pay twice — once for pipelines, duplicated storage, and parallel governance, and again for the high-memory hardware needed to make them fast. PuppyGraph removes both costs by querying your lake directly with zero ETL and no second system to maintain. No massive RAM bills, no duplicated ACLs, and no extra infrastructure to secure.
- Flexible and Iterative Modeling: Using metadata driven schemas allows creating multiple graph views from the same underlying data. Models can be iterated upon quickly without rebuilding data pipelines, supporting agile analysis workflows.
- Standard Querying and Visualization: Support for standard graph query languages (openCypher, Gremlin) and integrated visualization tools helps analysts explore relationships intuitively and effectively.
- Proven at Enterprise Scale: PuppyGraph is already used by half of the top 20 cybersecurity companies, as well as engineering-driven enterprises like AMD and Coinbase. Whether it’s multi-hop security reasoning, asset intelligence, or deep relationship queries across massive datasets, these teams trust PuppyGraph to replace slow ETL pipelines and complex graph stacks with a simpler, faster architecture.


As data grows more complex, the most valuable insights often lie in how entities relate. PuppyGraph brings those insights to the surface, whether you’re modeling organizational networks, social introductions, fraud and cybersecurity graphs, or GraphRAG pipelines that trace knowledge provenance.
Deployment is simple: download the free Docker image, connect PuppyGraph to your existing data stores, define graph schemas, and start querying. PuppyGraph can be deployed via Docker, AWS AMI, GCP Marketplace, or within a VPC or data center for full data control.
Conclusion
Graph clustering provides a powerful way to uncover structure in connected data. By grouping nodes based on relationships rather than isolated attributes, organizations can reveal communities, functional modules, and behavioral patterns that traditional analytics may overlook. From structural methods and attribute-aware techniques to probabilistic models such as the Stochastic Block Model, different approaches offer trade-offs in scalability, interpretability, and flexibility. Selecting the right method depends on data characteristics, analytical goals, and operational constraints.
As graph workloads move into large, distributed environments, efficient execution becomes just as important as algorithm design. PuppyGraph enables teams to run clustering directly on existing data sources without complex ETL pipelines. By combining scalable computation, flexible graph modeling, and standard query languages, organizations can integrate graph clustering into everyday analytics workflows and turn connected data into actionable insight.
Explore the forever-free PuppyGraph Developer Edition, or book a demo to see it in action.

Hao Wu is a Software Engineer with a strong foundation in computer science and algorithms. He earned his Bachelor’s degree in Computer Science from Fudan University and a Master’s degree from George Washington University, where he focused on graph databases.

Get started with PuppyGraph!


Developer Edition
- Forever free
- Single noded
- Designed for proving your ideas
- Available via Docker install
Enterprise Edition
- 30-day free trial with full features
- Everything in developer edition & enterprise features
- Designed for production
- Available via AWS AMI & Docker install