

Graph Data Science: Unlocking Insights with Graph Algorithms and Machine Learning

Data science is a rapidly evolving field, pushing us to constantly seek innovative methods to derive meaningful insights from the vast networks of complex, interconnected web of data that surrounds us. Traditional data analysis techniques often fall short when dealing with complex relationships and networks. This is where graph data science emerges as a game-changer, offering a powerful means to uncover overlooked patterns within these extensive, interconnected datasets.
In this comprehensive blog, we'll delve into the world of graph data science, exploring its core concepts, various kinds of graph algorithms, applications, and the cutting-edge tools that empower data scientists to navigate the complexities of networked data.

What is graph data science?
Data science is a multidisciplinary field that applies scientific techniques, processes, algorithms, and systems to extract knowledge and insights from both structured and unstructured data. It integrates concepts from statistics, mathematics, computer science, and domain-specific knowledge to analyze and interpret complex data, uncover patterns, and support data-driven decision-making.
Building on these foundations, graph data science emerges as a specialized area within data science, focusing on the analysis and interpretation of graph-structured data. A graph, in this context, is a mathematical model composed of nodes (or vertices) and edges that connect these nodes, effectively representing complex relationships and interactions among entities.
While traditional data science typically deals with tabular data, graph data science excels at managing interconnected data where relationships are as significant as the entities themselves. This approach enables a deeper understanding of complex systems and networks.
Learn more about relationship graphs.
Key elements of graph data science include:
- Data representation: Modeling data as graphs to capture intricate relationships and dependencies.
- Graph analytics: Utilizing algorithms to extract insights from graph structures, such as identifying influential nodes, detecting communities, or finding the shortest paths.
- Machine learning on graphs: Developing and applying machine learning techniques specifically tailored for graph-structured data.
- Visualization: Creating visual representations of graphs to facilitate the understanding and communication of complex relationships.
- Domain applications: Employing graph data science techniques to address real-world challenges in areas such as social network analysis, recommendation systems, fraud detection, and more.

Graph data science has surged in popularity lately because it excels at providing distinct insights in scenarios where understanding the relationships and connections between data points is critical. It enables us to tackle tasks such as:
- Node classification: Predicting the category or label of a node based on its attributes and its connections within the graph.
- Link prediction: Predicting the likelihood of a relationship (edge) forming between two nodes.
- Community detection: Identifying groups of nodes that are densely connected within the graph, representing communities or clusters.
- Centrality analysis: Identifying the most influential or important nodes within a graph.
- Pathfinding and route optimization: Finding the shortest or most efficient paths between nodes in a network.
- Recommendation systems: Recommending items or content to users based on their preferences and the graph structure representing user-item interactions.
Graph data science provides a powerful lens through which we can analyze complex systems, understand their dynamics, and make informed decisions.
Why do you need graphs?
Consider how intertwined our world is, with intricate webs of connections that simple data models just can't capture effectively. Graphs step in to fill that gap - offering a powerful and intuitive way to model, explore, and derive insights from interconnected data.
Read this insightful deep-dive blog post to learn when to use a graph database.
Graphs excel at representing relationships between entities. Unlike tabular data structures, graphs can easily capture and represent multidimensional relationships, making them ideal for modeling real-world scenarios such as social networks, supply chains, biological systems, transportation networks, and knowledge bases.
One of the key advantages of using graphs is their ability to uncover hidden patterns and insights that might be challenging or impossible to discover using traditional data analysis methods. Graph algorithms can identify influential nodes in a network, detect communities or clusters, find shortest paths or optimal routes, and even predict missing links or connections.
In the realm of machine learning, graphs can significantly enhance models by providing rich feature engineering based on network structure, graph-based embeddings for improved predictions, and more context for natural language processing tasks. This makes graphs an invaluable tool for improving the accuracy and effectiveness of various machine learning applications.
In terms of performance and scalability, graph databases often outperform traditional relational databases , especially when dealing with highly connected data and traversal-heavy operations. This makes them particularly useful for handling large-scale, complex data sets that require frequent querying of relationships.

A significant advantage of graph-based approaches is their inherent flexibility and scalability. Graphs can easily accommodate changes in data structure and relationships without requiring a complete overhaul of the system. As new nodes and edges are added, the graph naturally expands, allowing for seamless integration of new data points and connections. This flexibility makes graphs particularly well-suited for dynamic, evolving datasets common in fields like social media analysis, real-time fraud detection, or evolving scientific research. Moreover, many graph databases and processing frameworks are designed to scale horizontally, allowing them to handle massive amounts of data across distributed systems. This scalability ensures that graph-based solutions can grow alongside an organization's data needs, from small-scale projects to enterprise-level applications processing billions of relationships.
The applications of graphs span across various industries, solving complex problems in diverse fields. In financial services, graphs are used for fraud detection by identifying suspicious patterns in transaction networks. E-commerce platforms leverage graphs for recommendation systems, providing personalized suggestions based on user behavior and product relationships. Telecommunications companies use graphs for network optimization, while pharmaceutical researchers apply them to drug discovery processes. In the realm of cybersecurity, graphs play a crucial role in threat detection by analyzing patterns in network traffic and user behavior.
In summary, graphs provide a powerful and flexible framework for representing, analyzing, and understanding interconnected data. Their ability to model intricate relationships, uncover hidden insights, and scale with evolving data needs positions them as an essential component in modern data science and machine learning applications.
Want to learn more? Read our blog 7 Graph Database Use Cases You Need To Know.
Graph data science techniques
Graph data science employs a rich set of techniques to extract knowledge and insights from graph-structured data. These techniques span various areas, including:
Graph algorithms
These algorithms operate directly on the graph structure, traversing nodes and edges to perform tasks like pathfinding, community detection, centrality analysis, and more. They provide fundamental building blocks for graph data science.
Graph feature engineering
Graph feature engineering extracts predictive elements from raw graph data for machine learning tasks. It leverages existing relationships within data to create informative features, enhancing model accuracy without requiring additional data collection. This technique is particularly valuable for improving predictions in scenarios where data availability is limited.
Graph embeddings
Graph embedding techniques aim to map nodes or entire graphs into a lower-dimensional vector space while preserving the structural information. These embeddings can be used as features for downstream machine learning tasks or for visualizing and exploring the graph structure.
Graph mining
Graph mining techniques focus on discovering patterns and relationships within large graphs. They include frequent subgraph mining, anomaly detection, and influence maximization algorithms.
Graph Neural Networks (GNNs)
GNNs are a class of machine learning models specifically designed for graph data. They leverage the graph structure to learn node representations that capture both node attributes and their relationships within the graph. GNNs have proven effective for tasks like node classification, link prediction, and graph representation learning.
Graph databases and query languages
Graph databases provide efficient storage and retrieval of graph-structured data. Query languages like Cypher and Gremlin allow us to interact with graph databases and perform complex graph traversals and transformations.
Choosing the right techniques for working with graph data really depends on the problem you're trying to solve and the details of the graph data itself. Graph data scientists usually mix and match different methods to get the best results. This way, they can use the best features of each technique to get a full picture of the data.
Graph data science tools
A variety of tools and platforms are available to support graph data science workflows, each offering unique capabilities and strengths. Here's a look at some prominent tools in the field:
1. PuppyGraph


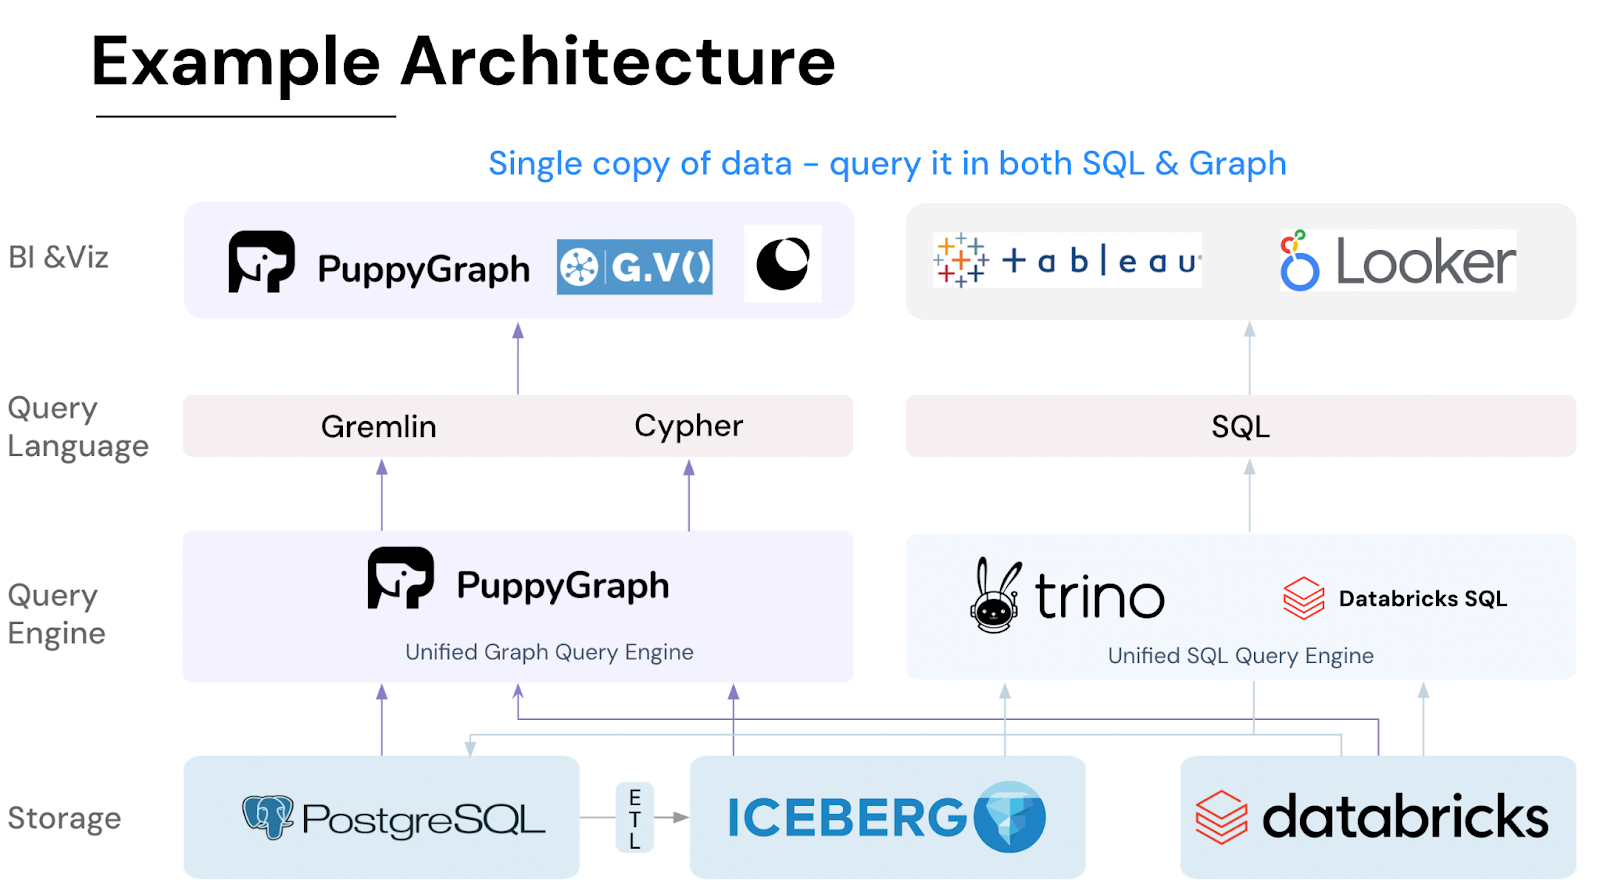
PuppyGraph introduces a novel approach that simplifies the adoption of graph databases and analytics, minimizing the learning curve and eliminating complex ETL processes. This easy-to-adopt graph analytics engine efficiently converts existing relational data stores into a single graph model, allowing for direct execution of queries on tables within the current data sources. By seamlessly integrating with well-known lakehouses and databases, PuppyGraph reduces the barriers to entry, facilitating a swift transition to graph-based analysis. Users can leverage their familiarity with Gremlin and OpenCypher, the two widely-used graph query languages supported by PuppyGraph, enhancing its versatility. Additionally, its expanding collection of graph algorithms and visualization tools further equips users to tackle diverse analytical tasks in various industries.
2. Neo4j
Neo4j is a popular graph database that provides efficient storage and retrieval of graph-structured data. It offers a native graph query language (Cypher) for interacting with the graph, as well as integration with popular programming languages and frameworks. But as a graph database, Neo4j still requires a complex ETL process and the single-node architecture might hinder scalability with large volumes of data.
3. NetworkX
NetworkX is a Python library for creating, manipulating, and analyzing graphs. It provides a comprehensive set of graph algorithms and data structures, making it a versatile tool for graph data science tasks. NetworkX is well-suited for exploratory analysis, prototyping, and research projects.
4. PyTorch Geometric
PyTorch Geometric is a PyTorch-based library for deep learning on graphs. It provides a unified framework for implementing and training graph neural networks (GNNs) and other graph-based machine learning models. PyTorch Geometric's flexibility and integration with the PyTorch ecosystem make it a powerful tool for research and development in graph deep learning.
5. TigerGraph
TigerGraph is a high-performance graph database and analytics platform. It offers a scalable distributed architecture, a native graph query language (GSQL), and built-in support for graph algorithms and machine learning. TigerGraph is well-suited for applications that require real-time analytics on massive graphs, such as fraud detection, customer 360, and supply chain optimization. As a native graph database, users still need to do ETL process.
These are just a few examples of the many tools available for graph data science. The choice of tool depends on factors such as the size and complexity of the graph data, the specific tasks to be performed, and the desired level of performance and scalability.
Graph algorithms for data science
After implementing a relationship graph, we often utilize graph algorithms to gain deeper insights into the network and address specific questions related to relationships and topology. These algorithms analyze entire graphs for offline examination of historical data, contrasting with small, real-time transactions and local queries that focus on limited areas around a few nodes.
Graph algorithms serve two primary purposes: graph analytics and graph feature engineering. In graph analytics, they help uncover patterns and insights from the graph's structure. In graph feature engineering, they identify, combine, and extract predictive features from raw graph data, which are then used in machine learning tasks. Incorporating more detailed information from graph data generally enhances the accuracy of machine learning models.
Graph algorithms traverse the graph, exploring nodes and edges to extract valuable information. Here are some key graph algorithms and measures commonly used in data science, categorized by their application tasks:
- Network navigation algorithms are essential for determining efficient routes through complex networks, optimizing both digital and physical journeys. Examples of these algorithms include Dijkstra's algorithm, which finds the shortest path between nodes in a weighted graph; the A* search algorithm, an informed search method that uses heuristics to enhance performance; and Breadth-First Search (BFS), which explores all neighbor nodes at the current depth before moving on to nodes at the next depth level.
- Node influence metrics algorithms quantify the significance of individual nodes within a network, highlighting key players and their roles in the overall structure. For example, PageRank measures the importance of web pages, originally used by Google; Betweenness Centrality identifies nodes that serve as bridges between different parts of a network; and Eigenvector Centrality assigns relative scores to nodes based on the importance of their connections.
- Cluster identification algorithms are used to uncover tightly-knit groups within larger networks, revealing underlying organizational structures and relationships. Examples include the Louvain method, a fast, hierarchical algorithm for detecting communities in large networks; Label Propagation, a near-linear time algorithm that uses network structure to guide its progress; and the Girvan-Newman algorithm, which identifies communities by progressively removing edges from the network.
- Node affinity analysis algorithms assess the similarity between nodes based on their attributes, which is useful for applications like personalized recommendations and hierarchical categorization. Examples include Jaccard Similarity, which measures similarity between finite sample sets; Cosine Similarity, which determines the cosine of the angle between two vectors in a multi-dimensional space; and the Pearson Correlation Coefficient, which measures the linear correlation between two variables.
- Connection forecasting algorithms predict potential future connections or uncover hidden links within a network by analyzing existing structures and node proximities. Examples include Common Neighbors, which predicts links based on the number of shared neighbors between two nodes; the Adamic-Adar Index, a refinement of Common Neighbors that gives more weight to less-connected neighbors; and the Resource Allocation Index, which is inspired by resource allocation dynamics in complex networks.
Graph data science examples
Graph data science finds applications across various domains, revolutionizing the way we analyze and understand interconnected data. Let's explore a few examples:
Social network analysis
Graphs naturally model social networks, where nodes represent individuals and edges represent relationships like friendships or interactions. Graph algorithms can identify influential users, communities, and trends, enabling targeted marketing, community management, and opinion mining.

Recommendation systems
Recommendation systems leverage graph-based techniques to suggest products, content, or connections to users. By analyzing user-item interaction graphs, these systems can identify similar users and items, leading to personalized recommendations and improved user engagement.

Fraud detection
Graphs can represent financial transactions, user behavior, and other relevant data. Graph algorithms can detect patterns indicative of fraud, such as unusual transaction patterns or connections between suspicious entities, helping prevent financial losses and protect users.

Healthcare
Graphs can model patient interactions, disease pathways, and drug interactions. Graph-based techniques can help identify potential drug targets, predict disease outbreaks, and personalize treatment plans based on patient similarities and disease patterns.

Supply chain optimization
Graphs can represent supply chains, where nodes represent suppliers, manufacturers, distributors, and retailers, and edges represent the flow of goods and services. Graph algorithms can identify bottlenecks, optimize routes, and improve efficiency throughout the supply chain.

Knowledge graphs
Knowledge graphs represent structured information about entities and their relationships. Graph-based techniques can be used for tasks like question answering, entity linking, and information retrieval, enabling intelligent search and knowledge discovery.

These examples showcase the versatility and impact of graph data science. By explicitly modeling relationships and leveraging graph algorithms and machine learning techniques, we can gain valuable insights and make informed decisions in diverse fields.
Read this blog post from Danfeng Xu, CTO and Co-founder at PuppyGraph to learn about the 7 trending graph database use cases.
Conclusion
Graph data science has emerged as a powerful paradigm for analyzing and understanding complex interconnected data. By explicitly modeling relationships and leveraging graph algorithms and machine learning techniques, we can uncover hidden patterns, make accurate predictions, and gain valuable insights in various domains.
If you're looking to unlock the full potential of your interconnected data, graph data science offers a powerful toolkit. PuppyGraph is the first and only real time, zero-ETL graph query engine in the market, empowering data teams to query existing relational data stores as a unified graph model that can be deployed in under 10 minutes, bypassing traditional graph databases' cost, latency, and maintenance hurdles.
PuppyGraph is already used by half of the top 20 cybersecurity companies, as well as engineering-driven enterprises like AMD and Coinbase. Whether it’s multi-hop security reasoning, asset intelligence, or deep relationship queries across massive datasets, these teams trust PuppyGraph to replace slow ETL pipelines and complex graph stacks with a simpler, faster architecture.


Interested in trying PuppyGraph? Start with our forever-free Developer Edition, or try our AWS AMI. Want to see a PuppyGraph live demo? Book a call with our engineering team today.

Sa Wang is a Software Engineer with exceptional mathematical ability and strong coding skills. He holds a Bachelor's degree in Computer Science and a Master's degree in Philosophy from Fudan University, where he specialized in Mathematical Logic.

Get started with PuppyGraph!


Developer Edition
- Forever free
- Single noded
- Designed for proving your ideas
- Available via Docker install
Enterprise Edition
- 30-day free trial with full features
- Everything in developer edition & enterprise features
- Designed for production
- Available via AWS AMI & Docker install