

Graph Database for Fraud Detection: Prevent Fraud
Your team already runs rules, device fingerprints, and ML scores, yet rings still slip through while good customers get blocked. The real issue isn’t scoring power. It’s a mismatch between event-first pipelines and how fraud actually behaves. Fraud is relational and temporal. Offenders coordinate across people, devices, cards, IPs, merchants, and time windows.
The stakes are direct and measurable. Missed fraud drives chargebacks, operational costs, and regulatory exposure. Overblocking erodes revenue and trust. Reputation damage lingers long after a single incident. In banking, the risk is visible. Quavo’s 2025 Trust in Banking Consumer Study reports that 66% of customers would consider switching after a slow or frustrating dispute process. This pressure is not limited to banks. Telecom faces SIM swaps, insurers battle staged claims, marketplaces manage mule networks, and retailers fight refund and promo abuse.
This post covers what needs to change. We detail the current landscape of fraud detection, challenges that stall detection, and explain the graph way to model connected data. We then map them to real use cases, and close with how to try this on your existing data using PuppyGraph.
Understanding Fraud Detection Challenges
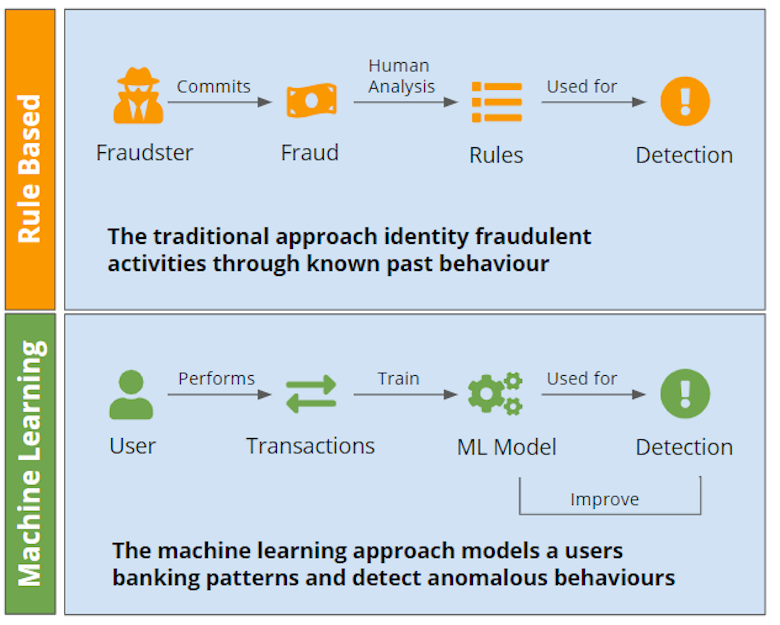
Most fraud programs decide with two layers: rules for speed and control, and machine learning for scale and pattern discovery. Rules return clear actions with reason codes. On the other hand, models compress many signals into a single risk score so teams can rank work and tune thresholds by segment. Used together, they cover immediate guardrails and high-volume scoring. Still, consistent results require more than event-level views. The gaps show up in a few recurring ways.
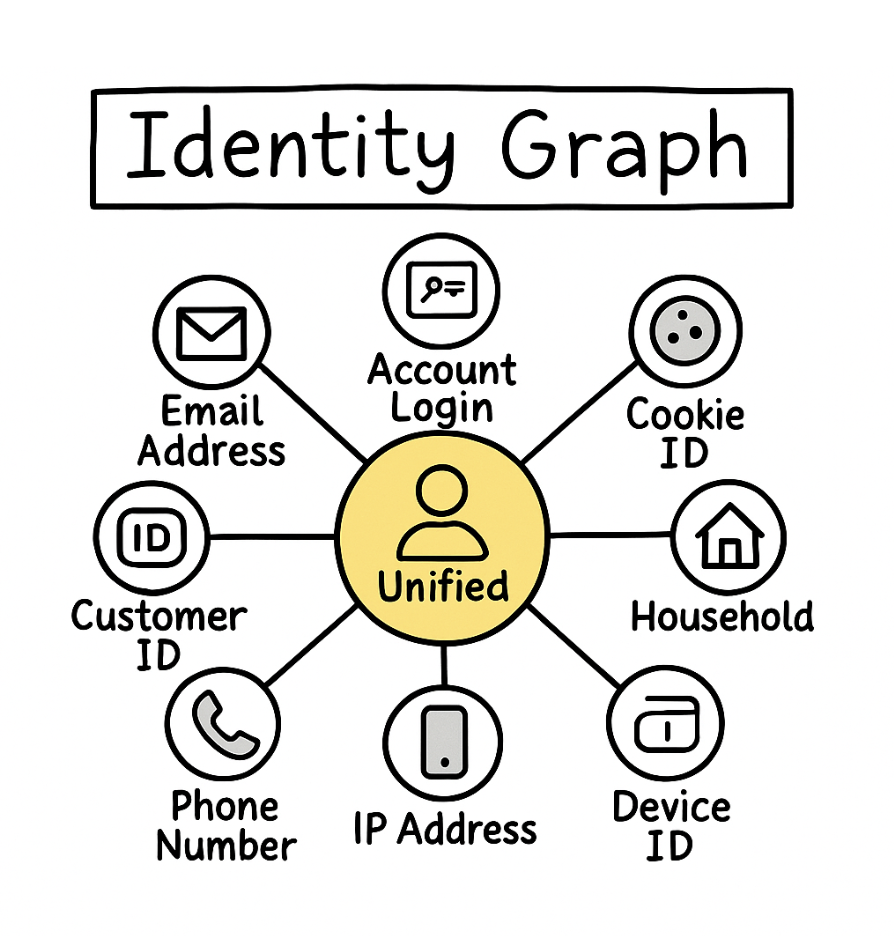
Identity Resolution
Traditional stacks struggle to keep identities stable as tactics evolve. Sparse or shared identifiers cause over-merge and under-merge, and new patterns like synthetic identities shift linking rules. Rules expect fixed keys and known heuristics. Supervised models learn yesterday’s merges from delayed labels. When the ground truth changes, features tied to “the customer” lose meaning and unknown attacks look ordinary long enough to pass.
Multi-hop Behavior
Fraud rings hide in connections that span people, devices, cards, IPs, merchants, and time. Event-first pipelines flatten this neighborhood into per-entity aggregates, so collusion that was not in the training data goes unseen. Rules capture local checks, not coordinated behavior across hops. Models trained on historical cases generalize within that history, which leaves blind spots when fraudsters rearrange sequences or spread activity across more nodes.
Cross-Channel Context
The relationships you need already exist in your data, but they are buried in rows and columns across different systems. Every decision rebuilds the same context with joins and windowed aggregates to link payments, logins, chargebacks, and support tickets. That stitching is costly to compute and fragile as schemas and keys change. Precomputing reduces query load but adds staleness and more pipelines to maintain. The net effect is that rule engines and ML models wait on expensive context assembly, which slows iteration and leaves blind spots when links fail.
Explainability
High-stakes actions need clear reasons. Rules provide reason codes, but as libraries grow the combined effect is hard to track. Machine learning compresses many signals into a score, which is hard to explain at case level without capturing evidence paths. When a novel tactic appears, “score 0.87” is not enough for disputes, audit, or customer communication. The result is slower investigations and weaker adverse-action notices.
Latency Budgets
The joins that assemble context are heavy. Large cross-system queries and enrichment jobs add seconds or minutes when authorization has only milliseconds. At the moment you most need context, such as during authorization, the enrichment may still be in flight. Decisions go out with partial data, or the pipeline stalls while the job finishes. The result is uneven coverage across authorization, holds, and investigations, plus week-to-week variability as upstream jobs, windows, and keys shift. To patch gaps, organizations layer more channel-specific rules, which fuels rule sprawl and makes behavior changes harder to track. Meanwhile, new attack paths that cross systems slip through while the joins catch up.
What Is a Graph Database?
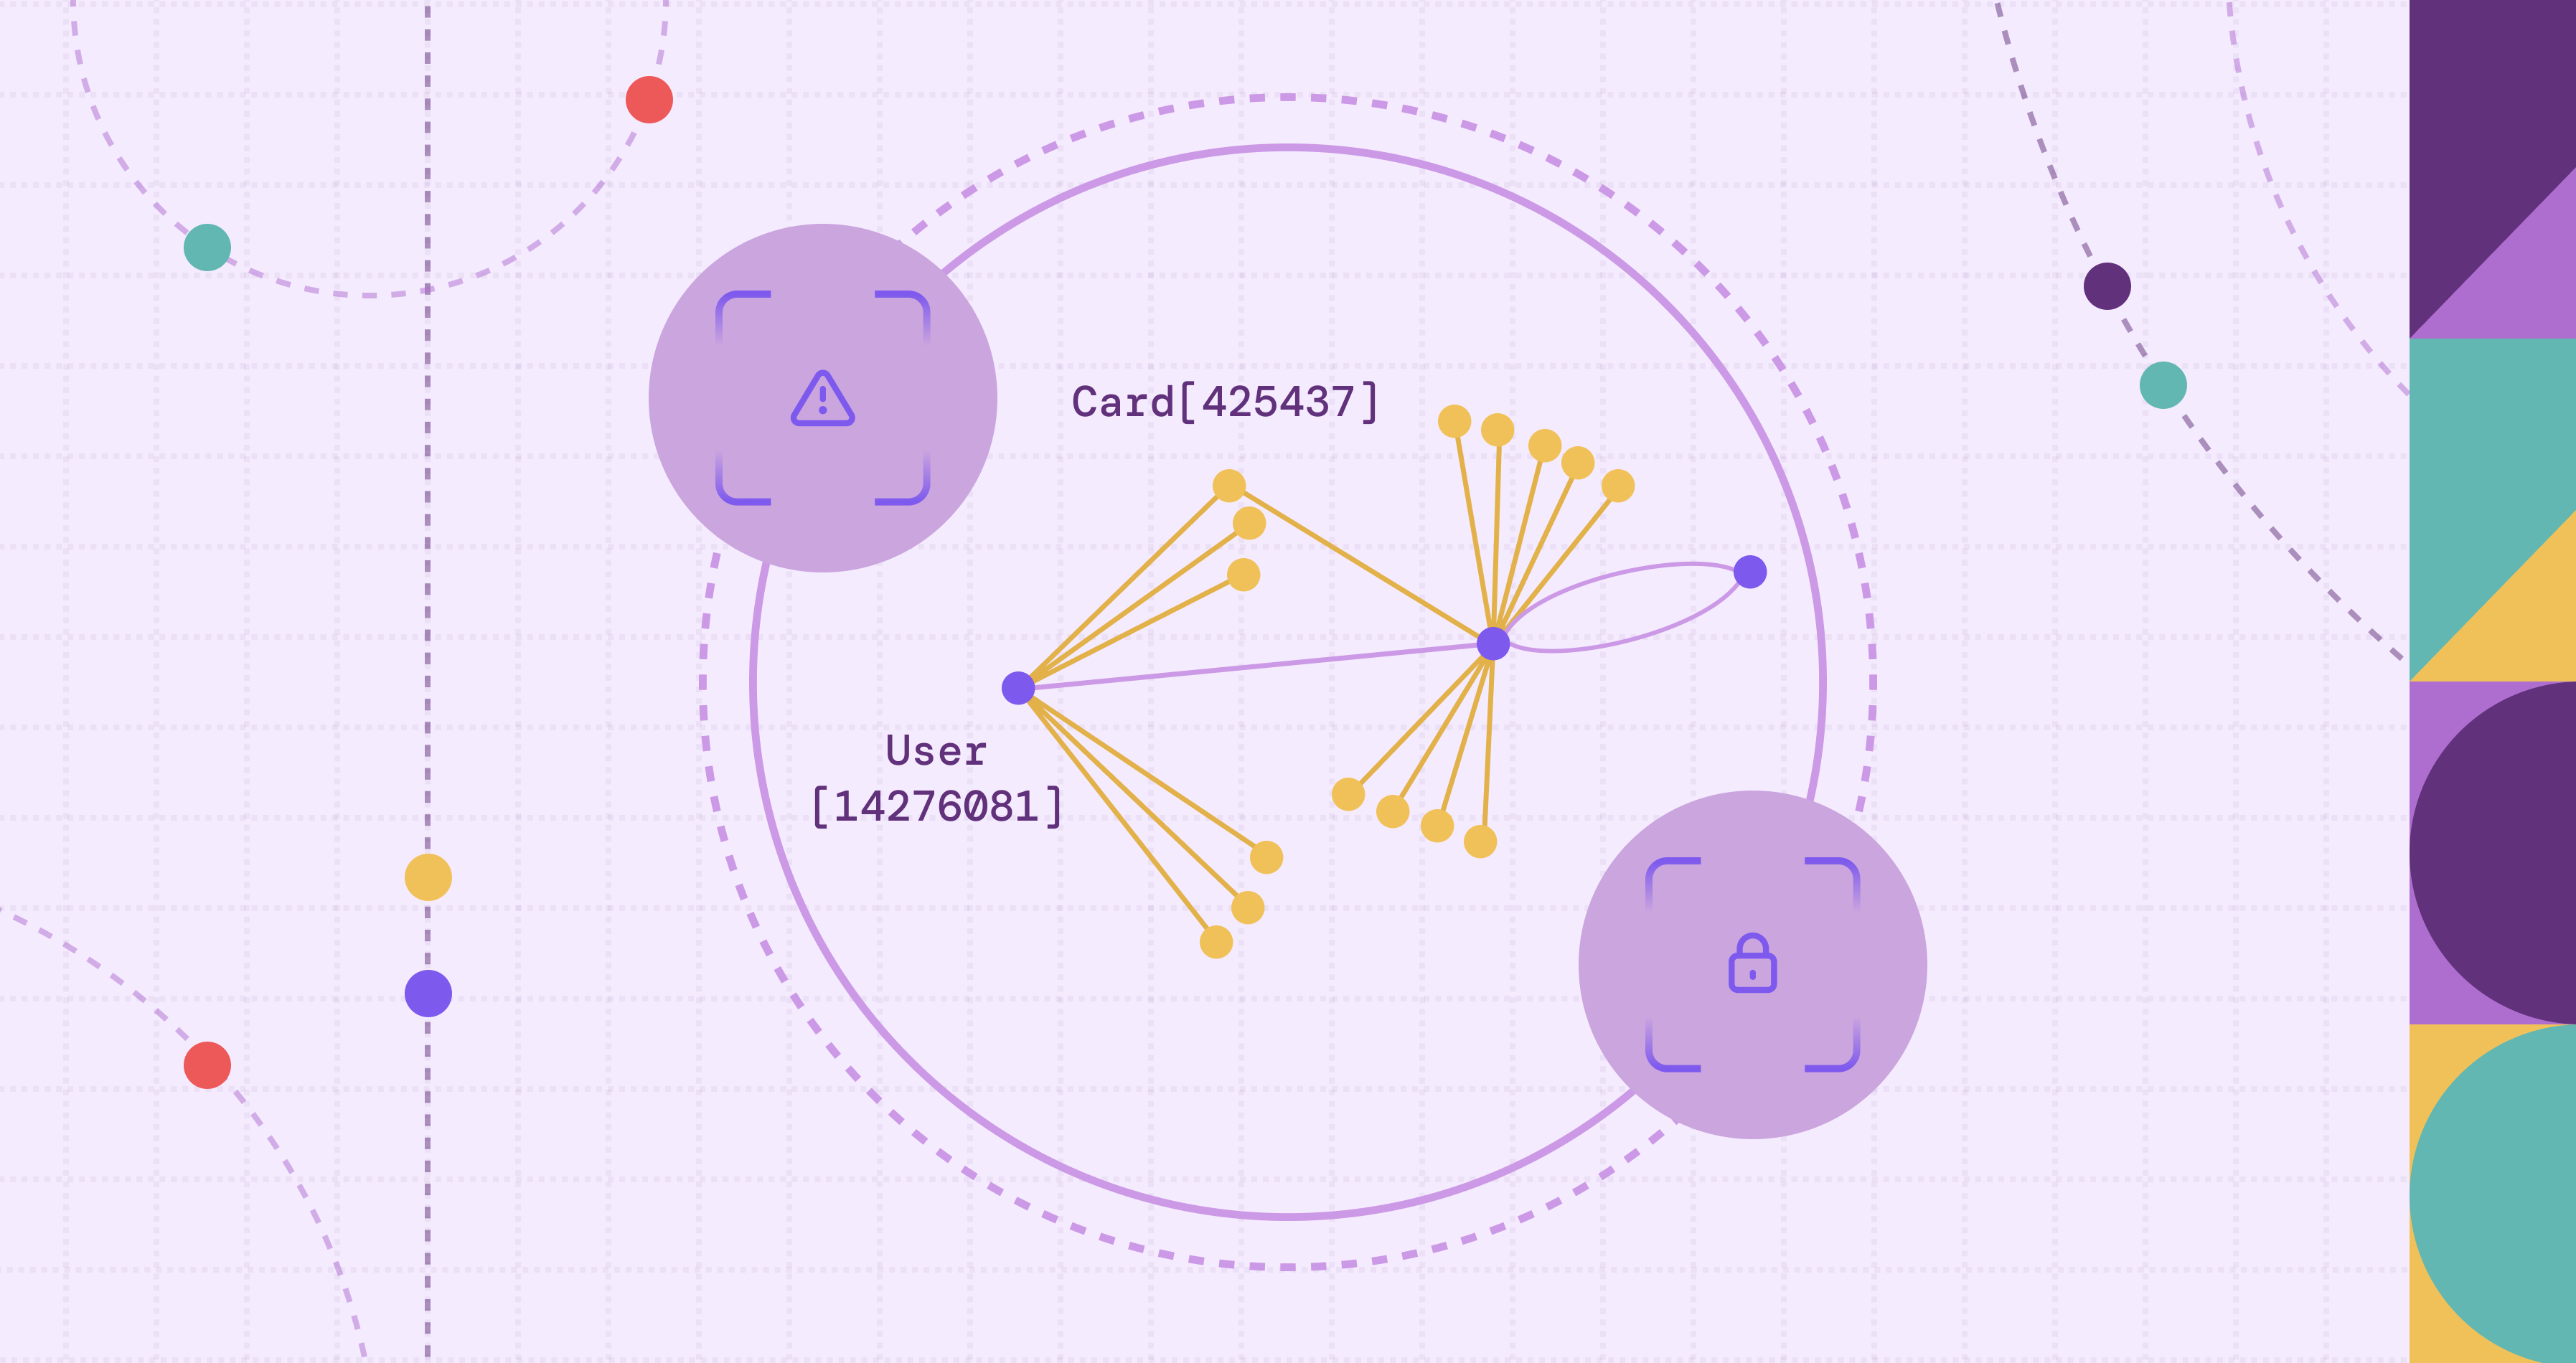
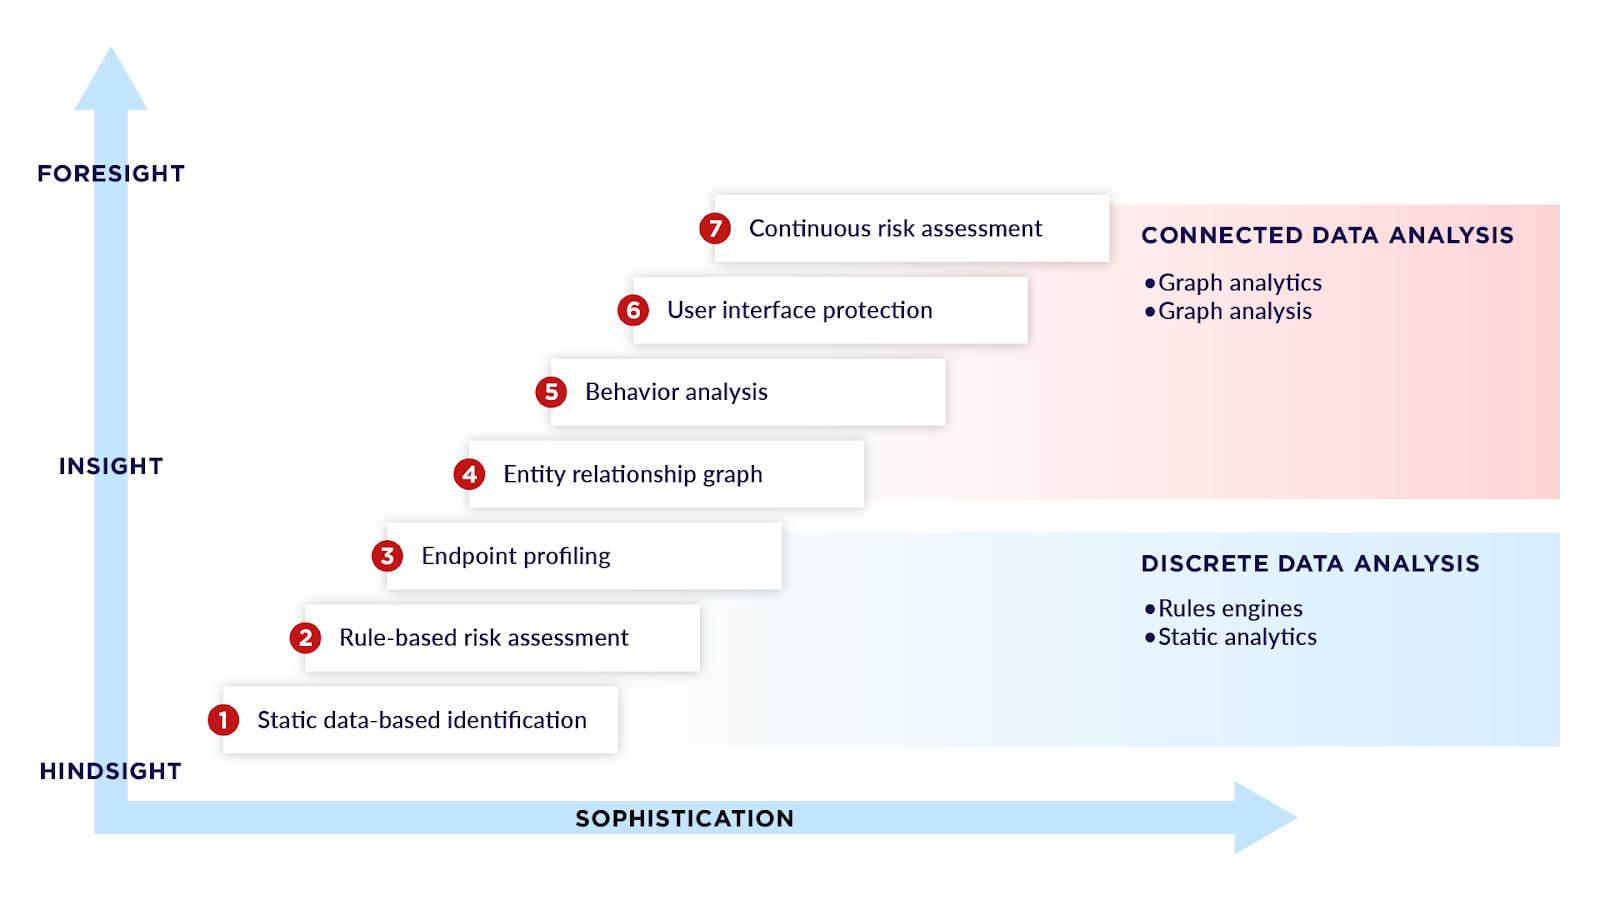
Due to the limitations of current fraud detection solutions, alternatives such as graph analytics are starting to rise in popularity. A graph database stores data as nodes and relationships rather than rows and joins. For fraud, that maps to reality. People, devices, cards, IPs, merchants, and emails are entities, while the links between them carry meaning with timestamps and attributes. Instead of rebuilding context for every decision, you query the neighborhood around an entity to see how it connects across channels and time.
This structure excels at complex, multi-hop questions, which is where fraudsters try to hide. Rings spread activity across fresh accounts, reused devices, shared IP ranges, burner emails, and time gaps to dilute any single event’s signal. Graph queries follow those links directly, with variable-length traversals and windowed filters, so patterns like fan-outs, cycles, bridges, and sleeper paths are simple to express and fast to retrieve. You can ask for accounts that share a device within 24 hours, short paths from a new account to a known bad node, or overlaps that tie two clusters through a common card or merchant.
The result is a connected context you can act on. Graph queries return evidence such as device degree over a window, shared payment instruments across accounts, or the exact path to a risky entity. These become stable, explainable features for rules and models, replacing brittle, repeated joins with direct traversal and keeping the full picture intact at decision time.
Why Graph Databases Excel at Fraud Detection
Adapt to Change with a Flexible Schemas
Most graph databases are schema-optional. You start with core nodes and relationship types, then add constraints and indexes as needed. For fraud, this lets you introduce a new entity or link, like a mule account or a reused device, without reshaping tables. Governance still holds through uniqueness rules, required properties, and allowed relationship types. The model keeps pace as tactics evolve.
Reduce Latency with Stored Relationships
Graphs store connections as first-class data. Instead of rebuilding joins for every decision, you traverse the neighborhood around an entity and read what is already linked. This cuts query costs and improves response times. Lightweight graph features such as degrees, overlaps, and shortest-path distances can be precomputed for real time, while targeted traversals support holds and deeper searches power investigations.
Catch Novel Tactics with Structural Patterns
Fraudsters change sequences, spread activity across more nodes, or insert bridge accounts to avoid detection. Graph analytics looks for logical network patterns such as fan-outs, cycles, bridges, shared-attribute rings, and short paths to risky nodes. Coordination stands out even when the playbook shifts. Add one node or link and the ring becomes visible. These structural signals also feed rules and machine learning, lifting recall without brittle joins.
Query Intuitively with Graph Queries
Graph queries match how investigators think about fraud. Instead of writing long SQL with many joins and window functions, you describe the pattern you want to find: accounts that share a device within 24 hours, short paths from a new account to a known bad node, or a fan-out from one IP to many fresh accounts. Pattern matching and variable-length traversals make these questions concise and readable. Time filters and relationship properties add the needed precision without turning the query into a tangle of joins. The result is faster iteration, clearer reviews with risk teams, and fewer errors when you move from an idea to a working detector.
A common way to detect fraud circles is by grouping accounts with transfer records and shared credit cards using the Weakly Connected Component (WCC) algorithm. With a graph query language like Cypher, this is simple:
CALL algo.wcc({
   labels: ['User'],
   relationshipTypes: ['PatternAssociation']
})
YIELD id, componentId
RETURN componentId, collect(id) as ids
ORDER BY size(ids) DESC
However, SQL has no in-built equivalent, requiring users to mimic the algorithm with recursive CTEs to propagate a component label until it stabilizes:
WITH RECURSIVE
undirected AS (
  SELECT src AS a, dst AS b FROM edges
  UNION
  SELECT dst AS a, src AS b FROM edges
),
nodes AS (
  SELECT a AS node FROM undirected
  UNION
  SELECT b FROM undirected
),
-- Expand reachability: for each node, collect all roots it can reach.
reach(node, root) AS (
  -- seed: each node reaches itself
  SELECT node, node FROM nodes
  UNION
  -- step: follow undirected edges
  SELECT u.b, r.root
  FROM reach r
  JOIN undirected u ON u.a = r.node
),
-- Component id = smallest node id reachable from that node (label propagation)
components AS (
  SELECT node, MIN(root) AS component_id
  FROM reach
  GROUP BY node
)
SELECT * FROM components
ORDER BY component_id, node;
Graph Database For Fraud Detection: Use Cases
Payments, commerce, platforms, and services all face abuse that moves across accounts, devices, and time. The following use cases show how graphs can turn scattered events into coherent patterns you can act on.
Money Laundering
Launderers move funds from risky sources through intermediate accounts to cash-out endpoints while staying under thresholds.
A fraud graph here might include nodes like user, account, card, merchant, cashout_endpoint, device, and ip. Edges capture movement and context such as p2p_transfer, ach, wire, card_payment, logs_in_from, and uses_device.
Watch out for short paths short paths from known risky sources to cash-out within tight windows, many-to-one-to-many flow shapes where value fans in to a hub and then fans out, chains of small transfers designed to dodge limits, and accounts that sit on numerous near-parallel routes to the same cashout_endpoint.
Credit Card Fraud
Attackers abuse payment instruments through testing and rapid monetization, often misusing a real person's existing identity and credit card information to make unauthorized purchases.
A fraud graph here might include nodes like card, user, device, ip, merchant, and endpoint. Edges represent operational touchpoints such as authorizes_card, purchases_from, signs_up, logs_in, calls_endpoint, and uses_ip.
You’ll often notice bursts of small authorizations from the same device or ip across many cards and merchants, single devices touching many cards within minutes, dense clusters around specific merchants or endpoints during probing, and quick pivots from successful tests to higher-value purchases.
Synthetic Identity
Synthetic personas are assembled from partial identifiers that pass basic checks, then “warm up” with small, low-risk activity before escalating.
A fraud graph here might include nodes like user, device, address, email, document_token, card, and application. Edges capture how these relate in time and space, such as uses_device, lives_at, has_email, submits_document, and pays_with.
A few telltale signs include single devices or addresses linked to many newly created users within a short window, accounts that share weak anchors but show little overlap with trusted entities, rapid fan out from fresh accounts after declines or verification events, and repeated reuse of emails or similar identifiers across thin histories that resemble template-based identities.
Incentive, Refund, and Return abuse
Coordinated abuse extracts value from promos, referrals, refunds, and returns.
A fraud graph here might include nodes like user, device, address, email, card, order, refund, promo, and merchant. Edges express activity and sharing such as uses_promo, places_order, receives_refund, shares_device, and ships_to.
A few common patterns are as follows: A single device or address spawning many new users redeeming the same promo in a short window, tight referral loops and small cycles among a few users, address hubs with elevated refund ratios, and merchant clusters that share the same customer subgraph while exhibiting abnormal refund density.
How Graph-Based Fraud Detection Works
With the basics in place, we’ll go deeper into how graph-based fraud detection works in theory and the graph algorithms behind it.
Pattern Matching
Pattern matching lets you state the fraud pattern directly: who connects to whom, in what order, and under simple constraints. In SQL, stitching context means juggling many keys across tables that get messy and unintuitive fast. With a graph query you describe the relationship pattern and add small filters like a hop limit or a time window. The result is both a hit and an explanation, since the matched subgraph is the evidence.
Here’s a Cypher example that captures a common case where one user sends money to another user who shares the same credit card, returning only the user pairs you care about.
MATCH (user1:User)-[:HAS_CARD]->(card:Card)<-[:HAS_CARD]-(user2:User)
WHERE user1 <> user2
MATCH (user1)-[p2p:P2P]->(user2)
RETURN DISTINCT id(user1) AS fromUserId, id(user2) AS toUserId;
Connected Components
Connected components split a graph into sets of nodes that can reach one another, so you can tell whether an entity stands alone or sits inside a larger cluster. Use weakly connected components (WCC) to ignore direction and reveal general neighborhoods, such as users linked by shared devices or addresses. Use strongly connected components (SCC) to keep direction and isolate tight loops, including circular money movement or referral cycles.
Community Detection
Community detection finds groups that interact more with each other than with the rest of the graph. It measures how tight a group is, not just whether any path exists. Algorithms like Louvain cluster nodes with many internal edges and few external ones. After you identify connected components, run community detection inside each one to surface dense clusters. This reveals rings or corridors of behavior, such as buyers who share many anchors and visit the same small set of merchants. The output is a label for each node plus simple scores you can use to compare groups and track how they change over time.
Cycle Detection and Flow Analysis
Use cycle detection with flow analysis to spot circular behavior in how money and incentives move. After you find a loop, examine how value moves through it: net inflow and outflow at each node, any leakage, how amounts change across hops, and the share that reaches a cashout endpoint. High-traffic nodes, in particular, should be closely monitored. Watching these cuts off multiple routes at once and helps catch risk moving across clusters early.
Graph Embeddings
Graph embeddings turn a node’s neighborhood and multi-hop context into numeric vectors that machine learning models can train on and score with. You learn a compact representation that captures who a node connects to and how. Methods like node2vec, DeepWalk, and GraphSAGE produce features that drop straight into common ML pipelines for training, validation, and real-time inference. Train on recent activity to reflect current behavior, validate in time order, and refresh on a schedule to reduce drift. In production, pair embeddings with a few clear path features so reviewers still have evidence, and track signals like similarity to known bad nodes, cluster membership in embedding space, and how much a node’s vector shifts over time.
How Puppygraph Helps in Fraud Detection with Graph Technology
Graph databases fit fraud work well, but many teams hesitate to adopt them because getting started is expensive and operationally heavy. Standing up a new database means new licenses and specialized infrastructure, plus a fresh data model to learn. Moving data into that system requires complex ETL, ongoing sync jobs, and new pipelines to keep data current. You also end up maintaining a second copy of sensitive information, which creates extra security reviews, compliance overhead, and failure points when schemas or keys change. The result is slower iteration, higher cost, and more moving parts than most fraud teams want to manage.

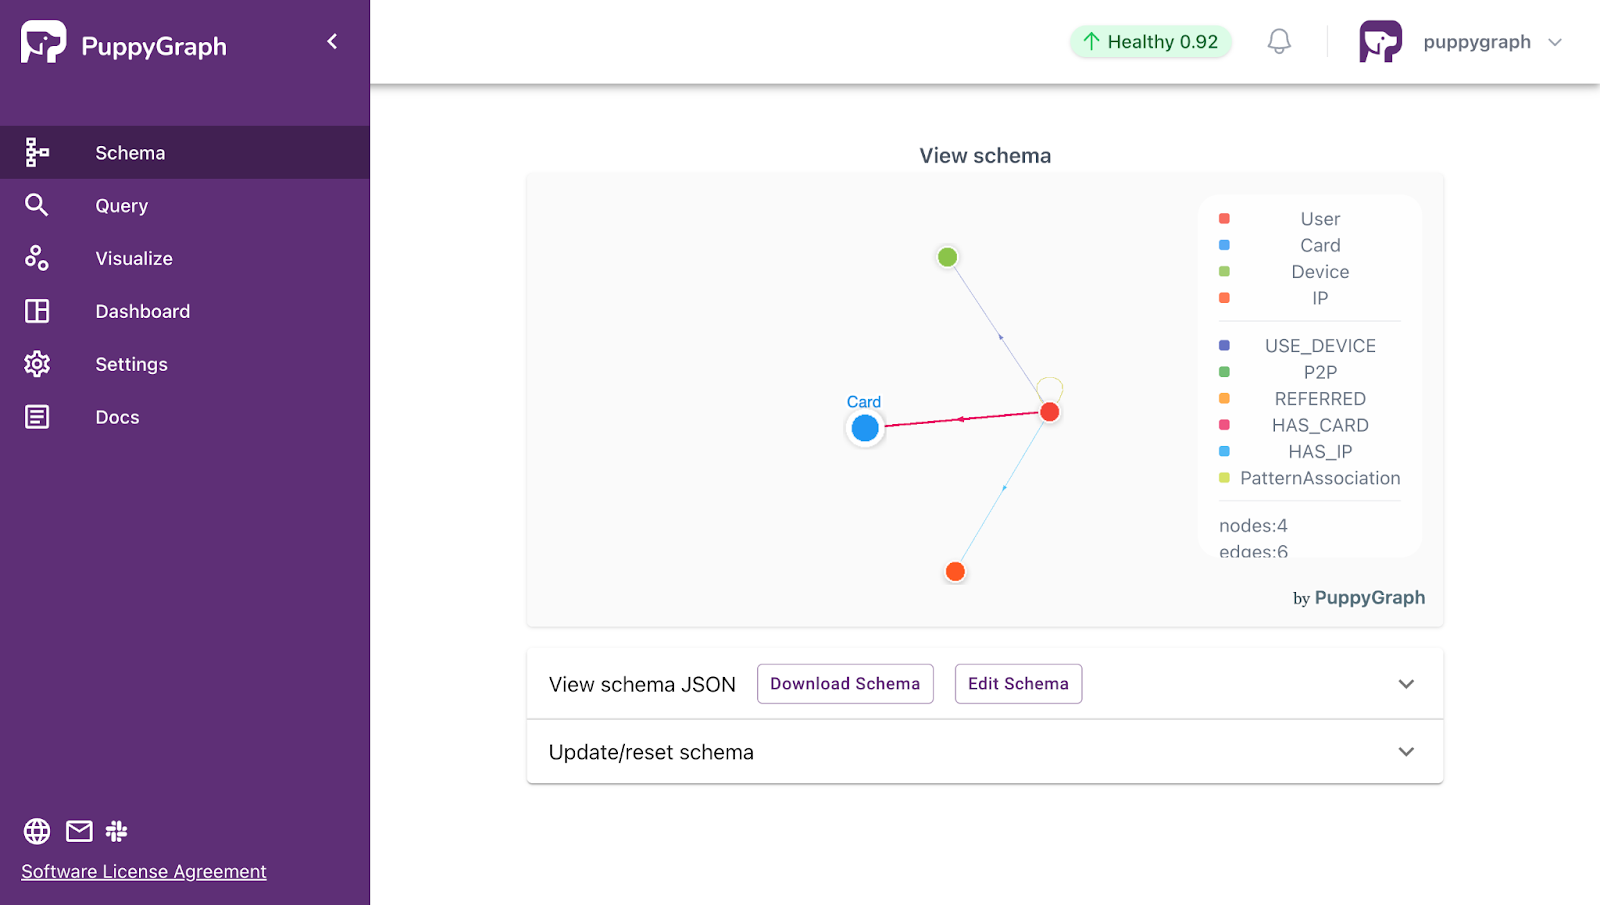
PuppyGraph is the first and only real time, zero-ETL graph query engine in the market, empowering data teams to query existing relational data stores as a unified graph model that can be deployed in under 10 minutes, bypassing traditional graph databases' cost, latency, and maintenance hurdles.
It seamlessly integrates with data lakes like Apache Iceberg, Apache Hudi, and Delta Lake, as well as databases including MySQL, PostgreSQL, and DuckDB, so you can query across multiple sources simultaneously.

Key PuppyGraph capabilities include:
- Zero ETL: PuppyGraph runs as a query engine on your existing relational databases and lakes. Skip pipeline builds, reduce fragility, and start querying as a graph in minutes.
- No Data Duplication: Query your data in place, eliminating the need to copy large datasets into a separate graph database. This ensures data consistency and leverages existing data access controls.
- Real Time Analysis: By querying live source data, analyses reflect the current state of the environment, mitigating the problem of relying on static, potentially outdated graph snapshots. PuppyGraph users report 6-hop queries across billions of edges in less than 3 seconds.
- Scalable Performance: PuppyGraph’s distributed compute engine scales with your cluster size. Run petabyte-scale workloads and deep traversals like 10-hop neighbors, and get answers back in seconds. This exceptional query performance is achieved through the use of parallel processing and vectorized evaluation technology.
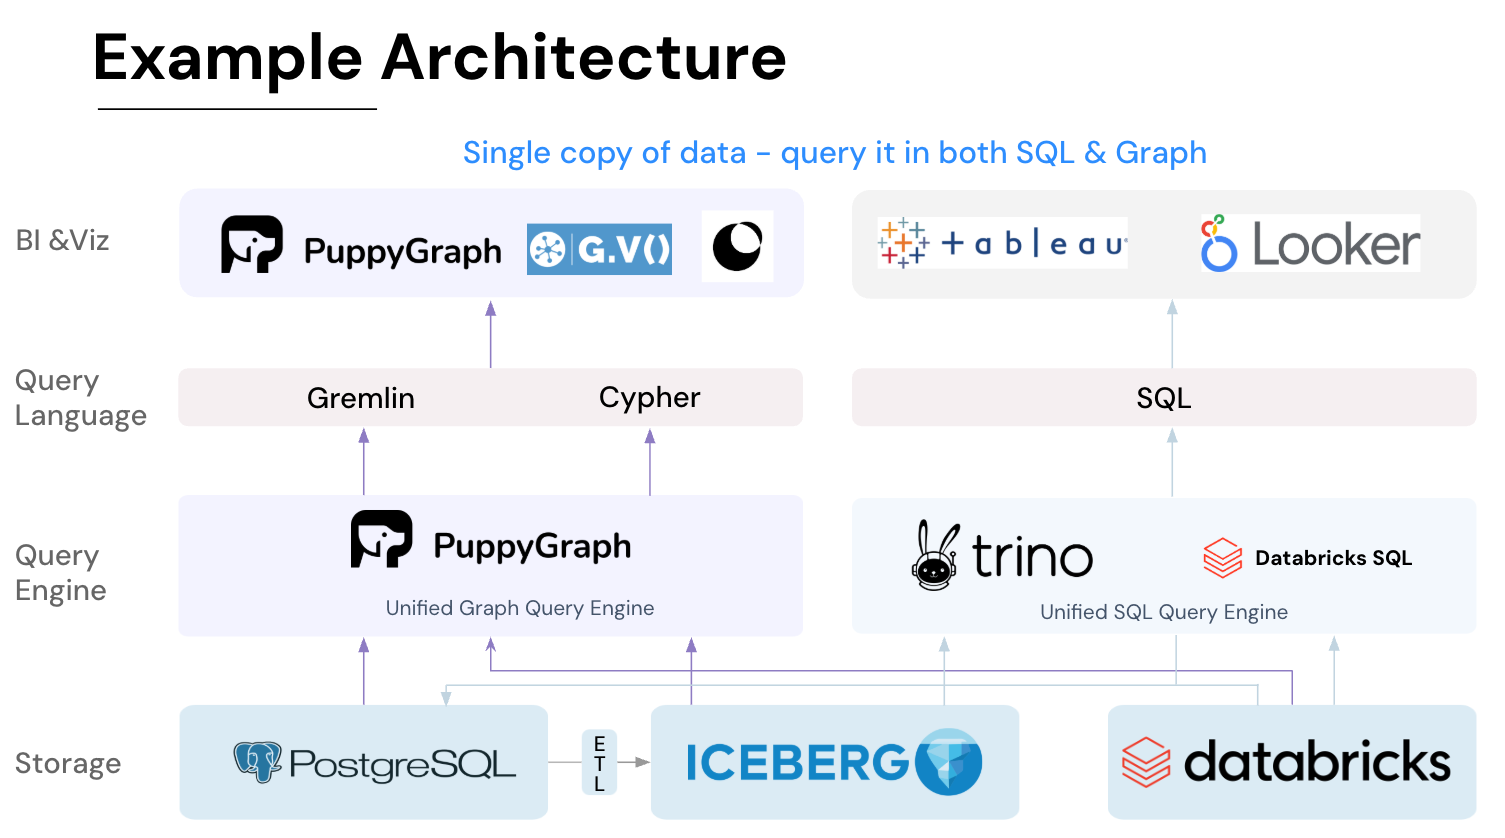
- Best of SQL and Graph: Because PuppyGraph queries your data in place, teams can use their existing SQL engines for tabular workloads and PuppyGraph for relationship-heavy analysis, all on the same source tables. No need to force every use case through a graph database or retrain teams on a new query language.
- Lower Total Cost of Ownership: Graph databases make you pay twice — once for pipelines, duplicated storage, and parallel governance, and again for the high-memory hardware needed to make them fast. PuppyGraph removes both costs by querying your lake directly with zero ETL and no second system to maintain. No massive RAM bills, no duplicated ACLs, and no extra infrastructure to secure.
- Flexible and Iterative Modeling: Using metadata driven schemas allows creating multiple graph views from the same underlying data. Models can be iterated upon quickly without rebuilding data pipelines, supporting agile analysis workflows.
- Standard Querying and Visualization: Support for standard graph query languages (openCypher, Gremlin) and integrated visualization tools helps analysts explore relationships intuitively and effectively.
- Proven at Enterprise Scale: PuppyGraph is already used by half of the top 20 cybersecurity companies, as well as engineering-driven enterprises like AMD and Coinbase. Whether it’s multi-hop security reasoning, asset intelligence, or deep relationship queries across massive datasets, these teams trust PuppyGraph to replace slow ETL pipelines and complex graph stacks with a simpler, faster architecture.


As data grows more complex, the most valuable insights often lie in how entities relate.
For example, groups containing confirmed fraudulent users have a higher likelihood of containing other undetected fraudulent users. We can focus on these suspicious clusters with a single query:
g.V().hasLabel('User').has('wcc_id', -1738790537).out('PatternAssociation').path()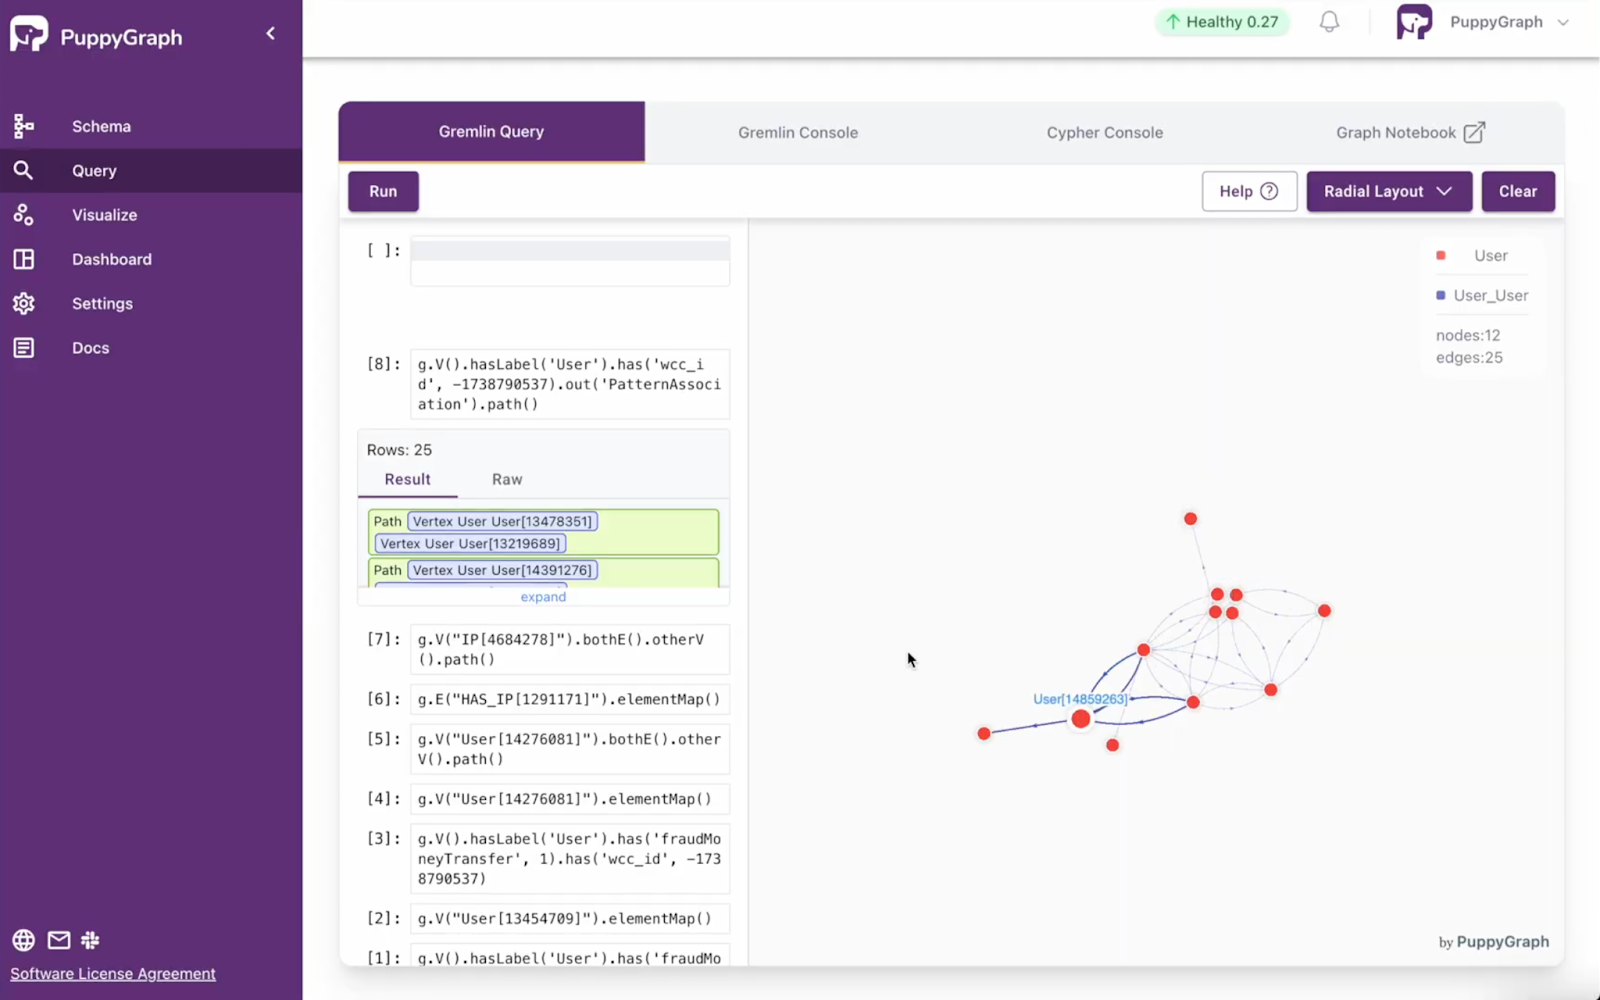
Interested in playing around with this example? Head on over to our GitHub Repository to get started with querying your data as a graph. Or, if you already have your own data you’d like to explore, PuppyGraph lets you go from deploy to query in minutes. You can run PuppyGraph with Docker, AWS AMI, GCP Marketplace, or deploy it inside your VPC for full control.
Conclusion
Fraud is a network problem, and graphs let you see it that way. When you treat users, devices, cards, merchants, and events as connected data, coordinated behavior stops looking like scattered alerts and starts reading like a story you can follow. Paths show how risk moves, clusters show where it concentrates, and the same evidence can feed both investigations and machine learning without slowing you down.
PuppyGraph makes this approach practical. It runs as a graph query engine on your existing tables, so there is no ETL and no second copy of sensitive data. Ready to get started? Give the PuppyGraph Developer Edition or book a demo to see how it works in action.

Jaz Ku is a Solution Architect with a background in Computer Science and an interest in technical writing. She earned her Bachelor's degree from the University of San Francisco, where she did research involving Rust’s compiler infrastructure. Jaz enjoys the challenge of explaining complex ideas in a clear and straightforward way.

Get started with PuppyGraph!


Developer Edition
- Forever free
- Single noded
- Designed for proving your ideas
- Available via Docker install
Enterprise Edition
- 30-day free trial with full features
- Everything in developer edition & enterprise features
- Designed for production
- Available via AWS AMI & Docker install