

How to Build a Knowledge Graph: Step-by-Step Guide for Beginners

Knowledge graphs are one of the most practical and talked-about tools for organizing highly connected data. Companies like Google, Amazon, and LinkedIn rely on them to power search engines, recommendation systems, and fraud detection platforms. But you don't need to be a tech giant to get business value from this approach.
Building a knowledge graph is about representing real-world entities and the relationships between them in a way that machines (and people) can reason over. Maybe you're trying to connect customer data across systems, build smarter AI applications, or just make sense of fragmented information. In any of those cases, a knowledge graph gives you a structured foundation to work from.
This guide walks through the entire process of building a knowledge graph from scratch. We'll cover the fundamentals, help you choose the right tools and technologies, and share practical tips so you can avoid the most common pitfalls along the way.
What Is a Knowledge Graph?
A knowledge graph is a data model that represents information as a network of entities (nodes) and the relationships (edges) between them. Each entity has properties that describe it, and each relationship captures how two entities are connected. The graph structure itself is the organizing principle, and that's what makes a knowledge graph different from a flat table or document store.
Think of it like a whiteboard sketch where you draw circles for people, products, or concepts, then draw lines between them to show how they relate. A knowledge graph takes that same intuition and stores it in a structured, queryable format.
For example, in a knowledge graph for an e-commerce company, you might have:
- A Customer node with properties like name, email, and location
- A Product node with properties like SKU, category, and price
- A PURCHASED relationship connecting a customer to a product, with properties like purchase date and quantity
What makes knowledge graphs different from the traditional relational model is that data relationships are first-class citizens. In a relational database, joining tables to traverse connections is expensive and gets slower as the data grows. In a graph, following a relationship from one entity to another is a constant-time operation, no matter how large the dataset.
Knowledge graphs are also flexible. You don't need to define a rigid schema upfront the way you would with a SQL database. You can add new entity types and relationship types as your understanding of the domain evolves, which makes them a natural fit for domains where data structures change over time.
In machine learning applications, knowledge graphs improve model training by enriching sparse data with additional context and connections. For recommendation systems, a knowledge graph can identify hidden relationships between items and users that a flat feature table would miss entirely. They also support explainability, since you can trace the reasoning path through the graph to understand why a model made a particular prediction. More recently, large language models use knowledge graphs for generating responses based on structured, verified facts rather than relying on training data alone. This approach is known as GraphRAG.
Define the Use Case and Objectives
Before you write a single line of code or spin up a database, you need to get clear on what you're building the knowledge graph for. Skipping this step is one of the most common reasons knowledge graph projects stall out or fail.
Start by identifying the core questions your knowledge graph needs to answer. These questions will shape every decision that follows, from schema design to database selection.
Here are a few examples of use cases and the kinds of questions they drive:
Fraud detection: "Which accounts share the same device, IP address, or payment method? Are there clusters of accounts that look suspicious based on their transaction patterns?"
Customer 360: "What products has this customer purchased, what support tickets have they filed, and which marketing campaigns have they interacted with? How does this connect to their account activity?"
Drug discovery: "Which proteins interact with this compound? What side effects have been reported in clinical trials for drugs targeting the same pathway?"
IT infrastructure mapping: "Which services depend on this server? If this network segment goes down, what applications are affected?"
Once you've defined the questions, map out the key entities and relationships you'll need. You don't need a perfect schema at this stage. You just need enough clarity to guide your data collection and design decisions.
It also helps to define success criteria early. What does "done" look like? Is it a working prototype that answers three key queries? A production system integrated with your ML pipeline? Getting specific about outcomes keeps the project focused and prevents scope creep.
Identify and Collect Data Sources
With your use case defined, the next step is figuring out where the data lives and how to integrate data from multiple sources into a form that works for a graph.
Most organizations don't have their data sitting in one clean, unified source. Instead, it's spread across relational databases, data warehouses, APIs, CSV exports, and sometimes even unstructured text documents. That's normal. Data integration across fragmented sources is exactly what a knowledge graph is designed to solve.
Start by inventorying your relevant datasets. For each one, note what entities and relationships it contains, the format of the raw data, how frequently it updates, and any quality issues you're aware of.
Common data sources include:
Structured data like relational databases (PostgreSQL, MySQL), data warehouses (Snowflake, Databricks, BigQuery), and spreadsheets. These are typically the easiest to work with because the entities and relationships are already somewhat defined by the table structures and foreign keys.
Semi-structured data like JSON or XML from APIs, log files, or configuration management systems. You'll need to parse these and map them to your graph schema.
Unstructured data, like documents, emails, or web pages. Extracting entities and relationships from natural language text requires Natural Language Processing (NLP) techniques like Named Entity Recognition (NER) and relation extraction. Tools like spaCy, Hugging Face transformers, or cloud NLP services can help here.
For entity extraction from text, a typical pipeline looks like this:
- Run NER to identify entities (people, organizations, locations, products)
- Resolve entities across sources (is "John Smith" in document A the same as "J. Smith" in document B?)
- Extract relationships between co-occurring entities
- Validate and clean the extracted data
Entity resolution is often the trickiest part. Two entries that look different ("John Smith" and "J. Smith") might refer to the same real-world object, while two entries that look identical might be different people entirely. You'll need a combination of fuzzy matching, rule-based logic, and sometimes manual review to confirm that each record maps to the same entity it should. Spending time here pays off because duplicate records and mismatched entities will undermine the quality of your entire graph.
For any data source, expect to spend time standardizing formats, handling missing values, correcting errors like invalid IDs, and cleaning up incomplete data before it's ready for data mapping and data ingestion into your graph.
Design the Knowledge Graph Schema
Schema design is where you define the vocabulary of your knowledge graph: what types of entities exist, what node labels to use, what node properties they have, and how they relate to each other.
In graph terminology, this is often called an ontology or a graph data model. If you're using the property graph model (which most modern tools support), it's the blueprint that tells you how to model relationships between your entities, including what business rules govern those connections.
A good approach is to start simple and iterate. Begin with the core entities and relationships that directly support your use case, then expand as needed. Trying to model everything at once leads to analysis paralysis and overly complex schemas that are hard to maintain.
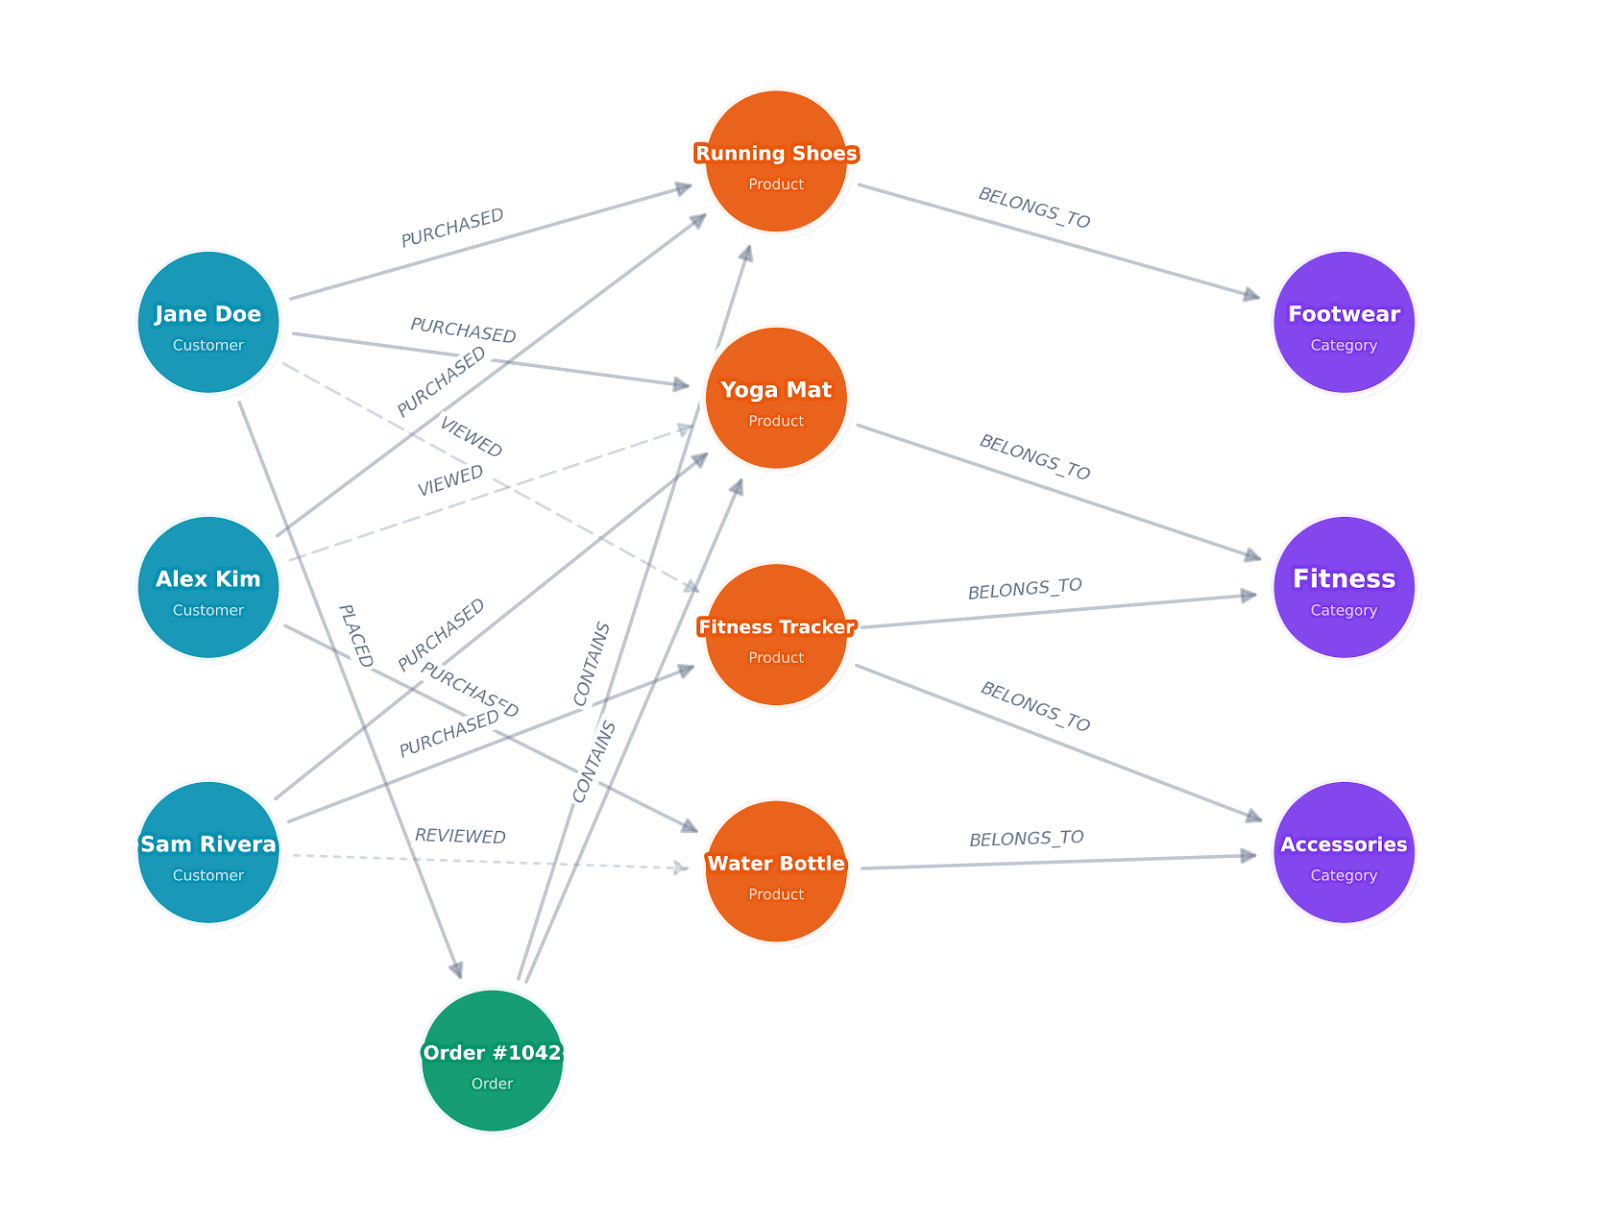
Let's walk through this with the e-commerce example we introduced earlier. Say you're building a knowledge graph to answer questions like "What products do customers with similar purchase histories buy?" and "Which product categories are frequently purchased together?"
Step 1: List your entity types. Based on those questions, you need Customer, Product, and Category. You might also want Order as a separate entity if you need to track order-level details like shipping and payment.
Step 2: Define properties for each entity type. Keep it focused on what your queries actually need. A Customer might need name, email, signup_date, and location. A Product needs title, sku, price, and description. Don't add every available field from your source database. You can always expand later.
Step 3: Define relationship types. Name them with clear, descriptive verbs. A Customer PURCHASED a Product. A Product BELONGS_TO a Category. A Customer VIEWED a Product. A Customer REVIEWED a Product.
Step 4: Add relationship properties. A PURCHASED relationship might carry purchase_date, quantity, and order_total. A REVIEWED relationship might carry rating and review_date. These properties let you filter and sort traversals later.
Step 5: Identify constraints and cardinality. Can a customer purchase the same product multiple times? (Yes, each purchase is a separate relationship.) Can a product belong to multiple categories? (Depends on your catalog structure.) These decisions shape how you write queries later.
Here's what the resulting schema looks like:
Nodes:
  - Customer (customer_id, name, email, signup_date, location)
  - Product (product_id, title, sku, price, category)
  - Category (category_id, name, parent_category)


Relationships:
  - Customer -[PURCHASED {purchase_date, quantity, order_total}]-> Product
  - Customer -[VIEWED {view_date}]-> Product
  - Customer -[REVIEWED {rating, review_date}]-> Product
  - Product -[BELONGS_TO]-> Category
This schema is simple enough to build quickly but rich enough to power product recommendations, customer segmentation, and purchase pattern analysis. You'll notice it maps directly to the kind of tables you'd already have in a relational database, which is exactly what makes the next steps straightforward.
One thing to watch out for: don't over-normalize your graph the way you might with a relational database. In a graph, it's often better to store frequently accessed properties directly on the node rather than creating a separate node type just to avoid duplication. For example, storing category as a property on the Product node and as a separate Category node is fine. The property gives you fast filtering, and the node gives you traversal capability.
Choose the Right Graph Technology
Picking the right graph technology matters more than most people realize, because it affects your query language, data model, scalability options, and how much infrastructure you'll need to manage. There are a few different approaches worth understanding.
Traditional Graph Databases
Property graph databases like Neo4j, Amazon Neptune, and JanusGraph model data as nodes and edges, where both can have key-value properties attached to them. This is the model most developers find intuitive because it maps closely to how you'd sketch a graph on a whiteboard. These databases require you to ETL your data into their own storage engine, which means maintaining a separate copy of your data and building pipelines to keep it in sync.
RDF Triple Stores
RDF (Resource Description Framework) databases like Apache Jena, Blazegraph, and Stardog store data as subject-predicate-object triples. This model comes from the Semantic Web tradition and is common in academic research, life sciences, and government data publishing.
RDF databases use SPARQL as their query language and support formal ontologies through standards like OWL and RDFS. If you need to integrate with linked open data, enforce complex reasoning rules, or work in a domain where semantic web standards are established, RDF is the way to go.
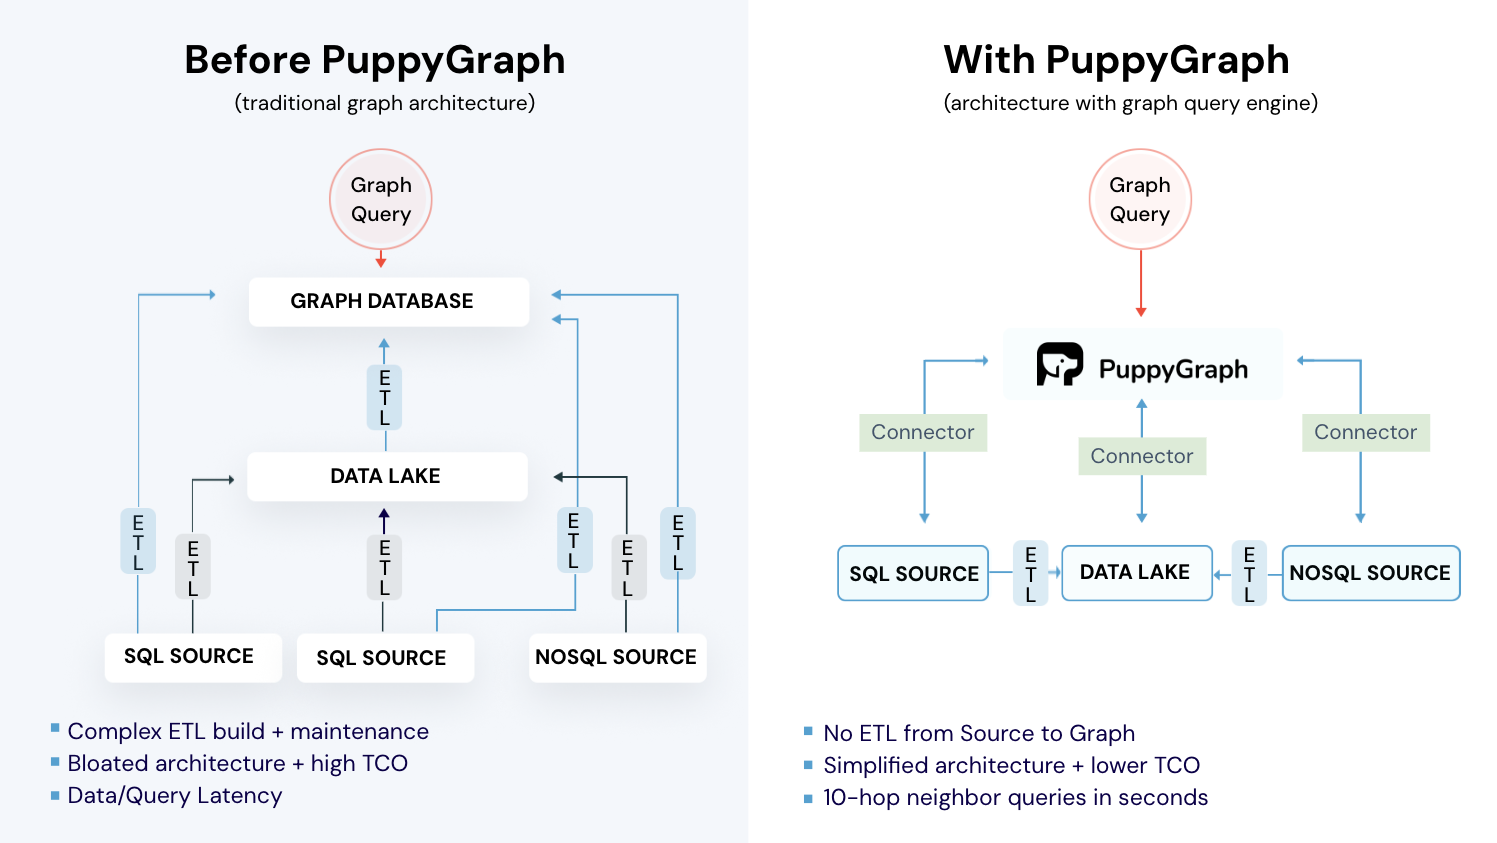
Graph Query Engines (Zero-ETL)
A newer approach skips the dedicated graph database entirely. Graph query engines like PuppyGraph sit on top of your existing data sources (Snowflake, Databricks, PostgreSQL, Apache Iceberg, and others) and let you run graph queries directly on the underlying data where it already lives. There's no ETL pipeline to build, no data to copy, and no second storage system to manage. For teams building an enterprise knowledge graph on top of an existing data stack, this is often the fastest path to production.
This zero-ETL approach makes the most sense if your data already lives in a data lake or warehouse. You define your graph schema as a JSON configuration that maps your existing tables to nodes and relationships, upload it to PuppyGraph, and start querying within minutes. PuppyGraph supports both openCypher and Gremlin, so you're not locked into a single query language.
Key Factors to Consider
When evaluating your options, think about:
Data movement: Do you want to copy your data into a separate graph database, or query it in place? Traditional graph databases require ETL pipelines and ongoing sync. A zero-ETL engine like PuppyGraph eliminates that overhead entirely.
Query patterns: What kinds of traversals will you run? Deep, multi-hop queries? Pattern matching? Shortest path calculations? PuppyGraph handles 6-hop queries across billions of edges in under 3 seconds.
Scale: How large will your graph get? Millions of nodes? Billions? PuppyGraph's distributed compute engine scales with your cluster size and handles petabyte-scale workloads.
Integration: Does the technology integrate with your existing data stack? If your data lives across multiple sources, PuppyGraph can query across them simultaneously without consolidation.
Operational overhead: Traditional graph databases require significant infrastructure management. PuppyGraph deploys in under 10 minutes and runs as a lightweight query layer on top of your existing systems.
For many teams, especially those already running data lakes or warehouses, a graph query engine like PuppyGraph is the fastest path to getting value from graph queries without rearchitecting your data platform.
Connect Your Data to the Graph
With your schema designed and graph technology selected, the next step is making your data queryable as a graph. The approach here depends heavily on whether you're using a traditional graph database or a zero-ETL graph query engine like PuppyGraph.
The Zero-ETL Approach (PuppyGraph)
If you're using PuppyGraph, there's no data loading step at all. Instead, you define a JSON schema file that maps your existing tables to graph nodes and relationships. PuppyGraph reads this schema and queries your data in place.
Here's what that looks like in practice with our e-commerce example. Say you have customer and product data in PostgreSQL tables. You'd create a schema file that handles the data mapping, telling PuppyGraph how to interpret those tables as a graph:
{
  "catalogs": [
    {
      "name": "postgres_catalog",
      "type": "postgresql",
      "jdbc_uri": "jdbc:postgresql://host:5432/mydb",
      "jdbc_user": "user",
      "jdbc_password": "password",
      "schemas": [
        {
          "name": "public",
          "tables": [
            {"name": "customers", "columns": [...]},
            {"name": "products", "columns": [...]},
            {"name": "purchases", "columns": [...]}
          ]
        }
      ]
    }
  ],
  "vertices": [
    {
      "label": "Customer",
      "one_to_one": {
        "table_name": "public.customers",
        "pk_columns": ["customer_id"]
      }
    },
    {
      "label": "Product",
      "one_to_one": {
        "table_name": "public.products",
        "pk_columns": ["product_id"]
      }
    }
  ],
  "edges": [
    {
      "label": "PURCHASED",
      "source": {"label": "Customer", "pk_columns": ["customer_id"]},
      "target": {"label": "Product", "pk_columns": ["product_id"]},
      "table_name": "public.purchases"
    }
  ]
}
Upload this schema to PuppyGraph, and you can immediately start running graph queries against your live PostgreSQL data. No CSV exports, no bulk imports, no sync pipelines. The same approach works for Snowflake, Databricks, Apache Iceberg, and 20+ other data sources.
You can get PuppyGraph running locally with Docker in about 10 minutes. The PuppyGraph quickstart guide walks through connecting a data source and uploading your first schema. If you want to follow along with the e-commerce example in this post, create the customers, products, and purchases tables in a local PostgreSQL instance with some sample data, then use the schema above as your starting point.
The Traditional ETL Approach
If you're using a traditional graph database, you'll need to transform and load your data into the database's native storage. The general process involves transforming source data to match your graph schema, bulk loading the initial dataset using the database's import tools, and then setting up incremental update pipelines to keep the graph in sync.
For structured data coming from relational databases, the mapping is usually straightforward. Foreign keys in your tables map naturally to relationships in your graph. A customer_id column in an orders table, for example, becomes a PURCHASED relationship between a Customer node and an Order node.
After the initial load, you need a process for keeping the graph in sync with your source data. This could be a scheduled batch job that runs nightly, a streaming pipeline that processes changes in near real-time, or a change data capture (CDC) setup that detects and applies incremental changes. This ongoing sync is one of the biggest operational burdens of running a traditional graph database, and it's the primary reason many teams are moving to zero-ETL approaches.
Validate Your Graph Before Moving On
Before you start writing application queries, take 10 minutes to verify that your graph is wired up correctly. This step catches issues that become much harder to debug later.
Run these checks against your e-commerce graph:
// 1. Verify node counts match your source data
MATCH (c:Customer) RETURN count(c) AS customer_count;
MATCH (p:Product) RETURN count(p) AS product_count;


// 2. Spot-check that relationships exist and have the right properties
MATCH (c:Customer {name: "Jane Doe"})-[r:PURCHASED]->(p:Product)
RETURN c.name, p.title, r.purchase_date, r.quantity;


// 3. Check for orphaned nodes (products nobody purchased, customers with no orders)
MATCH (p:Product) WHERE NOT (p)<-[:PURCHASED]-() RETURN count(p) AS orphaned_products;


// 4. Verify a known relationship count (e.g., if Jane Doe has 12 orders in your source DB)
MATCH (c:Customer {name: "Jane Doe"})-[r:PURCHASED]->() RETURN count(r) AS purchase_count;
If the counts don't match your source data, check your schema mapping (for PuppyGraph) or your ETL pipeline (for traditional databases) before moving on. It's much easier to fix a mapping issue now than after you've built queries and dashboards on top of it.
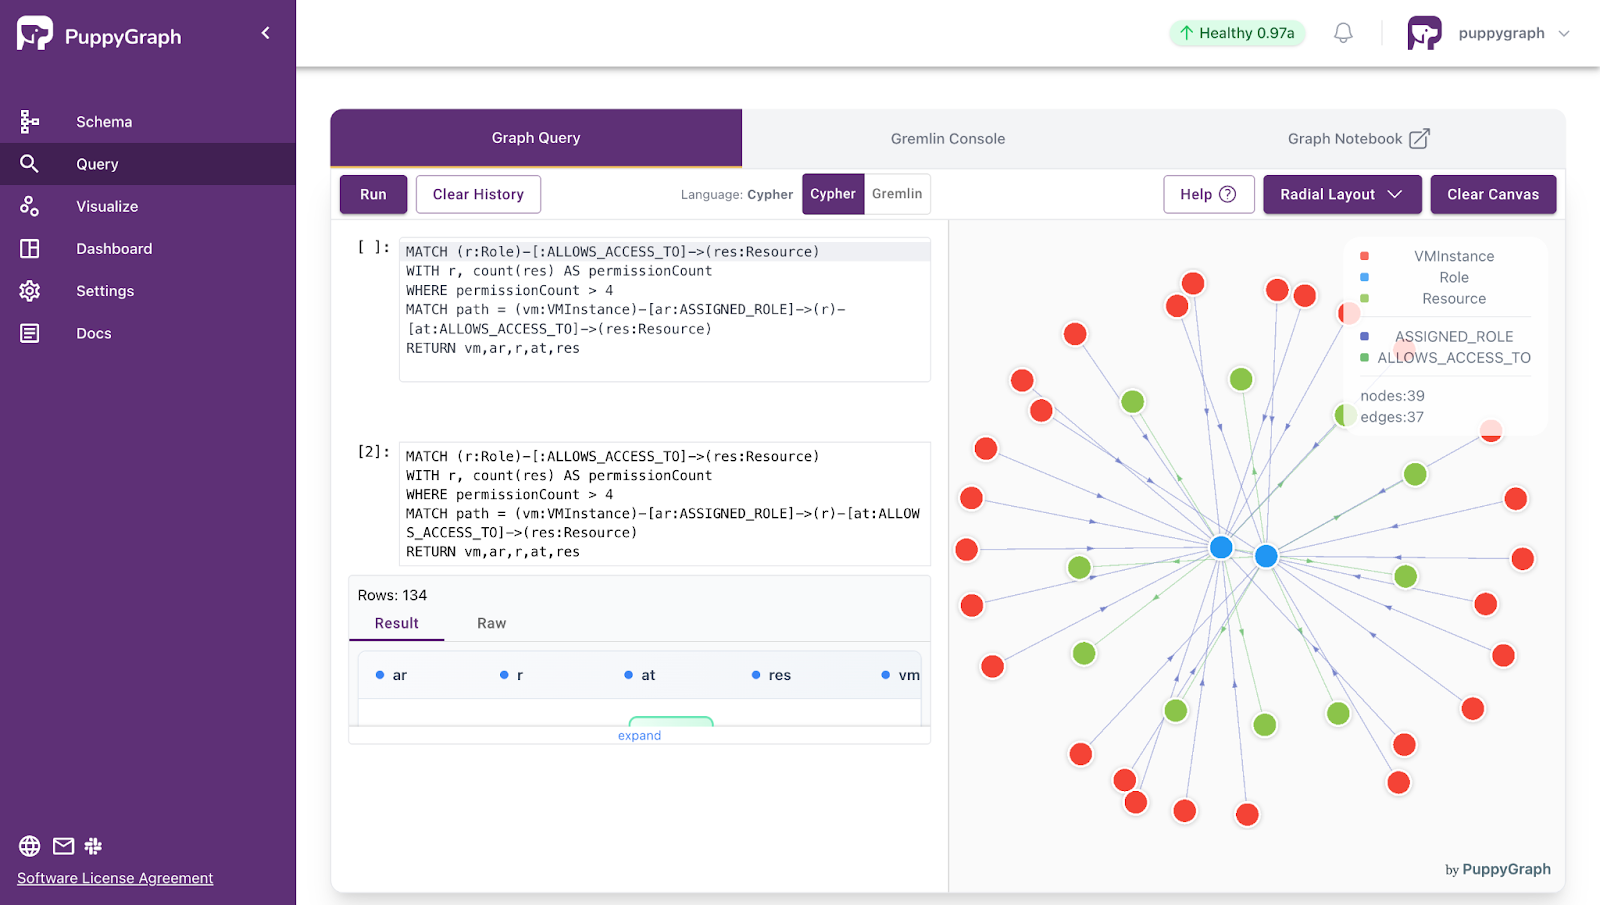
Query the Knowledge Graph
Once your graph is set up, you can start querying it. The most common graph query languages are openCypher (supported by PuppyGraph, Neo4j, and other property graph systems), SPARQL (used by RDF triple stores), and Gremlin (used by Apache TinkerPop-compatible systems, including PuppyGraph). Each takes a different approach.
Cypher
Cypher uses an ASCII-art style syntax to describe graph patterns. Nodes are wrapped in parentheses, relationships in square brackets, and arrows show direction. It reads almost like a sketch of the pattern you're looking for.
Here's a simple example that finds all products purchased by a specific entity, in this case a customer:
MATCH (c:Customer {name: "Jane Doe"})-[:PURCHASED]->(p:Product)
RETURN p.title, p.category, p.price
ORDER BY p.price DESC
For more complex queries, you can chain graph patterns together to identify hidden patterns in your data. This query finds customers who purchased the same products as Jane, which is the foundation of a collaborative filtering recommendation:
MATCH (jane:Customer {name: "Jane Doe"})-[:PURCHASED]->(p:Product)<-[:PURCHASED]-(other:Customer)
WHERE jane <> other
RETURN other.name, count(p) AS shared_products
ORDER BY shared_products DESC
LIMIT 10
Cypher also supports aggregations, path finding, and more advanced operations like variable-length path matching:
// Find all customers connected to Jane within 3 hops (through shared purchases, views, etc.)
MATCH path = (start:Customer {name: "Jane Doe"})-[*1..3]-(end:Customer)
RETURN path
SPARQL
SPARQL queries use triple patterns that match the subject-predicate-object structure of RDF data. Here's the equivalent of our customer-product query:
PREFIX ex: <http://example.org/>


SELECT ?productTitle ?category ?price
WHERE {
  ?customer ex:name "Jane Doe" .
  ?customer ex:purchased ?product .
  ?product ex:title ?productTitle .
  ?product ex:category ?category .
  ?product ex:price ?price .
}
ORDER BY DESC(?price)
SPARQL is particularly strong when you need to query across multiple linked datasets or use formal ontological reasoning. If your knowledge graph uses OWL classes and RDFS subclass hierarchies, SPARQL can automatically infer relationships that aren't explicitly stated in the data.
Gremlin
Gremlin is another option worth knowing about, especially if you're working with Apache TinkerPop-compatible databases. Gremlin takes a traversal-based approach where you describe a path through the graph step by step:
g.V().has('Customer', 'name', 'Jane Doe')
  .out('PURCHASED')
  .values('title')
Some graph query engines, including PuppyGraph, support both Gremlin and Cypher, which gives you flexibility depending on your team's preferences and the complexity of the query.
Tips for Writing Effective Graph Queries
Start with simple queries and build up complexity gradually. Graph queries can get expensive fast if you're not careful about constraining your traversals. Always anchor your patterns with a specific starting node when possible, rather than scanning the entire graph. Use LIMIT clauses during development so you don't accidentally return millions of results. For performance tuning, profile your queries to understand where time is being spent. Most graph databases provide an EXPLAIN or PROFILE command for this. Beyond basic traversals, most graph databases also support graph algorithms for tasks like community detection, centrality ranking, and shortest path analysis.
Common Challenges and Best Practices
Most knowledge graph projects don't fail because the team picked the wrong database. They fail because of avoidable mistakes in planning, data quality, or scope. Here's what trips people up most often.
Data Quality Is Everything
The value of your knowledge graph is directly tied to the quality of both the data and the relationships in it. Duplicate entities, incorrect relationships, incomplete records, and missing properties will undermine every query and every application built on top of the graph. Invest in entity resolution early. Build validation pipelines that catch issues before they make it into the graph. And establish a process for ongoing data quality monitoring, not just a one-time cleanup.
Start Small, Then Expand
It's tempting to try to model your entire organization's data in one shot. Resist that urge. Start with a focused use case, build a working graph that answers a specific set of questions, and demonstrate value before expanding the scope. A knowledge graph that answers three questions well beats one that tries to answer everything and answers nothing reliably.
Plan for Schema Evolution
Your schema will change as evolving business needs introduce new data types, organizational structure shifts, or your team discovers new questions worth answering. New entity types will emerge, relationships will be renamed, and properties will be added or deprecated. Design your application code to handle schema changes gracefully. With a zero-ETL tool like PuppyGraph, schema iteration is fast. You update the JSON schema and your graph model changes immediately, no pipeline rebuilds required. But even with traditional graph databases, property graphs are naturally more flexible than rigid relational schemas.
Think About Performance Early
Graph queries can be very fast for the right workloads, but they can also blow up if you're not careful. Unbounded traversals (like "find all paths of any length") can be computationally expensive on large graphs. Use indexes on frequently queried properties, constrain your traversal depth, and test with realistic data volumes during development, not just a handful of sample records.
Don't Duplicate Data Unless You Have To
One of the biggest operational headaches with knowledge graphs is keeping data in sync when it's been copied from source systems. Every time you ETL data into a graph database, you're creating a copy that can drift out of sync with the source of truth. Where possible, consider architectures that let you query data in place. Graph query engines that work directly on top of data lakes and warehouses, like PuppyGraph, can reduce this burden by eliminating the need for a separate graph data store entirely.
Document Your Ontology
As your knowledge graph grows, new team members need to understand what entity types and relationships exist and what they mean. Treat your ontology like code: keep it in version control, add comments, and maintain a human-readable reference document. This becomes critical as more teams start building applications on top of the graph.
Integrate with Your ML Pipeline
If you're using the knowledge graph to support machine learning, think about how graph features (including both structural patterns and numerical values like centrality scores) will flow into your training pipeline. Graph embeddings (like Node2Vec or GraphSAGE) can capture structural information that traditional feature engineering misses. Knowledge graphs also support explainability, since you can trace a reasoning path through the graph to understand why a model made a specific prediction. This is especially valuable in regulated industries where model decisions need to be auditable.
Build Knowledge Graphs Without the Infrastructure Overhead Using PuppyGraph
At this point, the fundamentals are in place: a schema, mapped sources, and queries that prove the graph answers the right questions. The next step is making it production-ready, so the graph can scale, stay current, and remain governed as your data evolves. Let’s see how PuppyGraph supports that in practice.

PuppyGraph is the first and only real-time, zero-ETL graph query engine in the market, empowering data teams to query existing relational data stores as a unified graph model that can be deployed in under 10 minutes, bypassing traditional graph databases' cost, latency, and maintenance hurdles.
It seamlessly integrates with data lakes like Apache Iceberg, Apache Hudi, and Delta Lake, as well as databases including MySQL, PostgreSQL, and DuckDB, so you can query across multiple sources simultaneously.

Key PuppyGraph capabilities include:
- Zero ETL: PuppyGraph runs as a query engine on your existing relational databases and lakes. Skip pipeline builds, reduce fragility, and start querying as a graph in minutes.
- No Data Duplication: Query your data in place, eliminating the need to copy large datasets into a separate graph database. This ensures data consistency and leverages existing data access controls.
- Real Time Analysis: By querying live source data, analyses reflect the current state of the environment, mitigating the problem of relying on static, potentially outdated graph snapshots. PuppyGraph users report 6-hop queries across billions of edges in less than 3 seconds.
- Scalable Performance: PuppyGraph’s distributed compute engine scales with your cluster size. Run petabyte-scale workloads and deep traversals like 10-hop neighbors, and get answers back in seconds. This exceptional query performance is achieved through the use of parallel processing and vectorized evaluation technology.
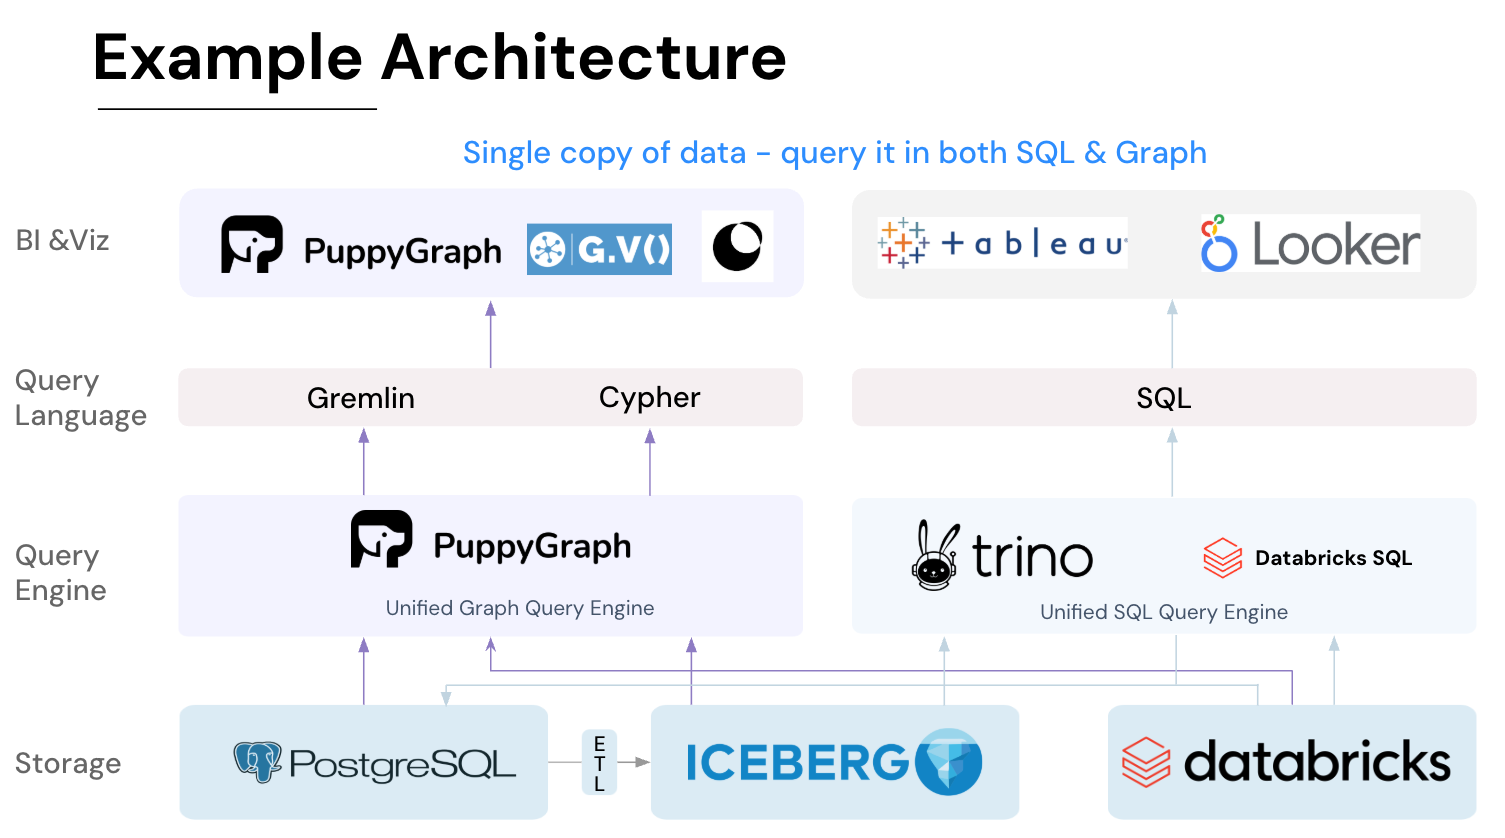
- Best of SQL and Graph: Because PuppyGraph queries your data in place, teams can use their existing SQL engines for tabular workloads and PuppyGraph for relationship-heavy analysis, all on the same source tables. No need to force every use case through a graph database or retrain teams on a new query language.
- Lower Total Cost of Ownership: Graph databases make you pay twice — once for pipelines, duplicated storage, and parallel governance, and again for the high-memory hardware needed to make them fast. PuppyGraph removes both costs by querying your lake directly with zero ETL and no second system to maintain. No massive RAM bills, no duplicated ACLs, and no extra infrastructure to secure.
- Flexible and Iterative Modeling: Using metadata-driven schemas allows creating multiple graph views from the same underlying data. Models can be iterated upon quickly without rebuilding data pipelines, supporting agile analysis workflows.
- Standard Querying and Visualization: Support for standard graph query languages (openCypher, Gremlin) and integrated visualization tools helps analysts explore relationships intuitively and effectively.
- Proven at Enterprise Scale: PuppyGraph is already used by half of the top 20 cybersecurity companies, as well as engineering-driven enterprises like AMD and Coinbase. Whether it’s multi-hop security reasoning, asset intelligence, or deep relationship queries across massive datasets, these teams trust PuppyGraph to replace slow ETL pipelines and complex graph stacks with a simpler, faster architecture.


As data grows more complex, the most valuable insights often lie in how entities relate. PuppyGraph brings those insights to the surface, whether you’re modeling organizational networks, social introductions, fraud and cybersecurity graphs, or GraphRAG pipelines that trace knowledge provenance.
Deployment is simple: download the free Docker image, connect PuppyGraph to your existing data stores, define graph schemas, and start querying. PuppyGraph can be deployed via Docker, AWS AMI, GCP Marketplace, or within a VPC or data center for full data control.
Conclusion
Knowledge graph building doesn't have to be a massive undertaking. Start with a clear use case, design a focused schema, pick the right tools for your data stack, and expand from there. The biggest gains come not from building the largest possible graph, but from building one that reliably answers the questions your organization actually needs answered.
The process is the same regardless of the use case: define the problem, model the data, load it, query it, and iterate. And with modern tools that let you query relational data as a graph without moving it, the barrier to entry is lower than most people expect.
Ready to try it? Download the PuppyGraph Developer Edition for free and start querying your data as a graph in minutes, or book a demo with our team to see how it works on your data stack.

Matt is a developer at heart with a passion for data, software architecture, and writing technical content. In the past, Matt worked at some of the largest finance and insurance companies in Canada before pivoting to working for fast-growing startups.

Get started with PuppyGraph!


Developer Edition
- Forever free
- Single noded
- Designed for proving your ideas
- Available via Docker install
Enterprise Edition
- 30-day free trial with full features
- Everything in developer edition & enterprise features
- Designed for production
- Available via AWS AMI & Docker install