


Semantic Analytics: Definition, Benefits & Use Cases
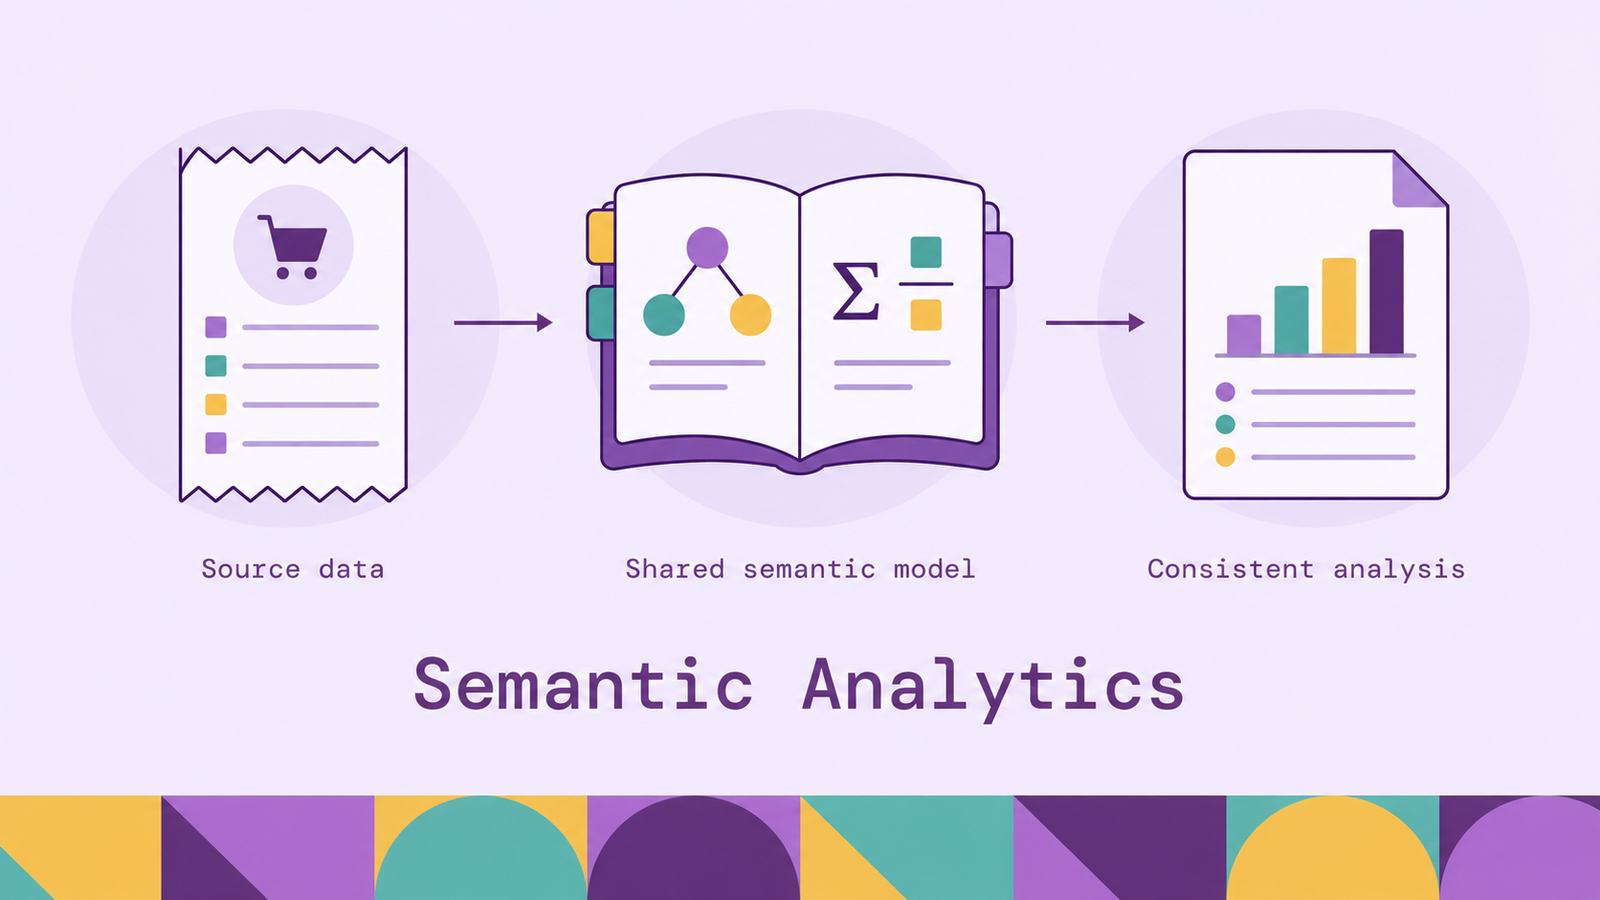
Shared business definitions make results comparable across dashboards, analysts, and AI assistants. A request for revenue by customer requires decisions about refunds, account identity, reporting periods, and which transactions count. Semantic analytics makes those decisions explicit and reusable, so each dashboard, analyst, or AI assistant can work from the same definitions.
This guide explains how semantic analytics works, what a semantic layer contributes, and where metric models and relationship models fit. It also covers practical use cases, architecture choices, and an implementation approach that starts with questions your team already needs to answer.
What is semantic analytics?
In this article, semantic analytics means analyzing enterprise data through explicit definitions of business concepts, metrics, and relationships. The defining feature is a shared model of meaning: what a customer represents, how revenue is calculated, and how an order relates to an account.
Consider two valid but different definitions of an active customer. Product teams may count accounts with recent usage; finance may count accounts with a paid subscription. Semantic analytics makes those definitions visible and separately named. Agreement does not require collapsing useful distinctions into one universal number.
The approach applies to both numerical and relationship questions. Monthly sales by region needs a metric definition and dimensions for grouping. Identifying customers affected by a service outage needs definitions of customers, services, and their dependencies. Both require a model that connects domain vocabulary to data.
Here, semantics refers to that modeled meaning. The article focuses on governed data analysis rather than language analysis of documents. Natural-language interfaces can use the model, but a dashboard or a hand-written query can use semantic analytics without an LLM.
How does semantic analytics work?
A semantic analytics workflow resolves a business request against a model, builds an executable query, and returns results with enough context to interpret them. The model supplies decisions that would otherwise be repeated in individual queries.
Suppose an analyst requests net sales by customer region for last month. For this example, the organization defines net sales as completed order value minus refunds attributed to those orders, excluding tax and shipping. It uses the order completion date and the customer's region at purchase time. Those are example business rules, not a universal accounting definition.
Resolve the request. The interface maps net sales and customer region to named model elements. Last month becomes a calendar interval in the reporting time zone. If the request could refer to several approved metrics, the interface should expose the ambiguity before executing.
Choose the relationships and grain. Grain means what one row represents. Imagine an order worth $100 with two refunds of $10 each. Joining the order directly to both refund rows repeats the order value. Summing order value minus refund value after that join produces $180 instead of $80. The query needs a calculation that preserves the order grain, such as aggregating refunds per order before joining.
This is a concrete responsibility of metric-aware planning. dbt's MetricFlow join documentation describes using declared entities as join keys and restricting joins that would create fan-out. The model's relationship declarations must still match the actual data.
Execute and explain. The system runs the query through its execution engine and returns the measure, grouping, and applied filters. A useful result also states the reporting period and data freshness. The analyst can then distinguish a changed business outcome from a changed definition or incomplete input.
What is a semantic layer in analytics?
A semantic layer exposes a business-facing model over physical data. It lets consumers refer to defined concepts while the implementation handles mappings to tables, columns, calculations, and relationships. Semantic analytics is the activity; the semantic layer supplies a reusable interface for that activity.
The model should describe more than readable column names. A metric needs its formula, applicable filters, time basis, and aggregation behavior. An entity needs an identifier and a clear boundary. A relationship needs meaning and cardinality: whether one account can have many subscriptions, for example. Microsoft's star-schema guidance explains how dimensions, facts, grain, and measures support analytical models.
Two useful modeling emphases are metrics and relationships. They overlap, and a platform may support both, but they organize the analyst's work differently.
Use the questions you need to answer to choose the emphasis. A graph can calculate aggregates, and a metric model can describe joins. Neither representation removes the need to define what a result means.
For a concrete implementation, LookML describes dimensions, calculations, aggregates, and relationships; Looker uses that model to construct SQL. A graph-based implementation can instead expose an ontology of entities and relationships for traversal. These are different execution and modeling choices within the broader semantic analytics approach.
How semantic analytics enables AI-powered analytics
An AI interface has to translate a user's wording into a data request. A semantic model can give that translation explicit targets: approved metrics, named relationships, descriptions, and relevant examples. It reduces the amount of business logic the model must infer from physical column names.
A practical design separates language interpretation from calculation. The LLM identifies the intended question and proposes a request. A query service validates supported references and operations, applies authorization, and executes the calculation. The answer then summarizes returned evidence. Numerical results should come from the executed query, with the relevant definitions attached.
Examples help connect wording to intended calculations. Snowflake's Verified Query Repository stores questions paired with reviewed SQL queries for Cortex Analyst to use when answering similar questions. Such examples provide guidance, but their value depends on the queries actually answering the associated questions correctly.
Validation has limits. A request can use valid fields while selecting the wrong time period, overlooking a relevant population, or answering a different question from the one the user intended. An assistant asked why sales fell may identify a regional decline, but that result alone does not establish its cause. The answer should distinguish observed differences from causal explanations.
Evaluate the whole workflow with questions that have reviewed answers, deliberately ambiguous requests, and requests the model cannot support. Correct clarification or refusal belongs in the evaluation alongside correct numerical output. This makes the semantic model a testable part of the AI application rather than background documentation.
Examples of semantic analytics
The following scenarios illustrate how semantic definitions change analytical work. They are hypothetical implementations, not customer case studies.
Sales and finance reporting. A retailer needs sales, refunds, and margin reports to agree across regional dashboards. The semantic model defines which order states qualify, how currencies are normalized, and whether returns affect the original sale period or the refund period. Users can compare regions without rebuilding those rules. Finance still owns the accounting interpretation and reconciles the analytical measure to its reporting requirements.
Customer retention analysis. A subscription business wants to compare renewal rates for customers with different onboarding experiences. The model distinguishes a customer account from an individual user and a subscription from an invoice. It also defines the eligible renewal cohort. Joining usage events to subscriptions then requires explicit identity and time rules, so high activity from one user does not accidentally become evidence about several customer accounts.
Supply chain exposure. A manufacturer asks which products depend on a disrupted supplier through components and subassemblies. A relationship model represents supplies, contains, and produced-at links. The analysis can trace indirect dependencies, while quantities, approved substitutions, and effective dates determine whether the connection is operationally relevant. A path identifies possible exposure; inventory and production data are still needed to estimate the impact.
Security investigation. An analyst wants to find identities that can reach a sensitive dataset through group membership and role assignments. The model distinguishes a recorded permission from an observed access event. It can connect identity, resource, and activity records using their identifiers. A candidate path helps prioritize investigation, but effective access may also depend on policy conditions that the model must represent or the analyst must verify separately.
Each scenario turns on a definition that a generic join or text prompt could leave implicit. Making that definition reusable is what allows multiple analyses to build on the same interpretation.
Semantic analytics architecture
A useful architecture separates data preparation, semantic modeling, execution, and consumption. These are responsibilities, not necessarily separate products. A single platform may implement several of them.
Source and preparation. Operational data lands in, or is accessed through, an analytical store. Preparation establishes usable identifiers, types, event timestamps, and quality checks. A semantic model depends on this work: assigning the name customer to a table does not reconcile duplicate customer records.
Semantic definitions. This layer maps entities, relationships, dimensions, and metrics to physical data. Keep definitions versioned and owned. Include descriptions of temporal behavior, such as whether an account hierarchy means its current structure or its structure when a transaction occurred.
Query planning and execution. The service resolves requests, checks model references, and builds a query plan. Execution may occur in a warehouse, a dedicated analytical engine, or a combination. Caching and precomputed results introduce freshness decisions; access control must cover the actual execution and result-serving paths.
Consumption and operations. Dashboards, applications, notebooks, and AI interfaces call the supported query surface. Logs should connect a request to its model version, execution details, and result status. Monitor definition changes as well as latency, errors, and freshness. A fast answer with an obsolete definition is still a bad answer.
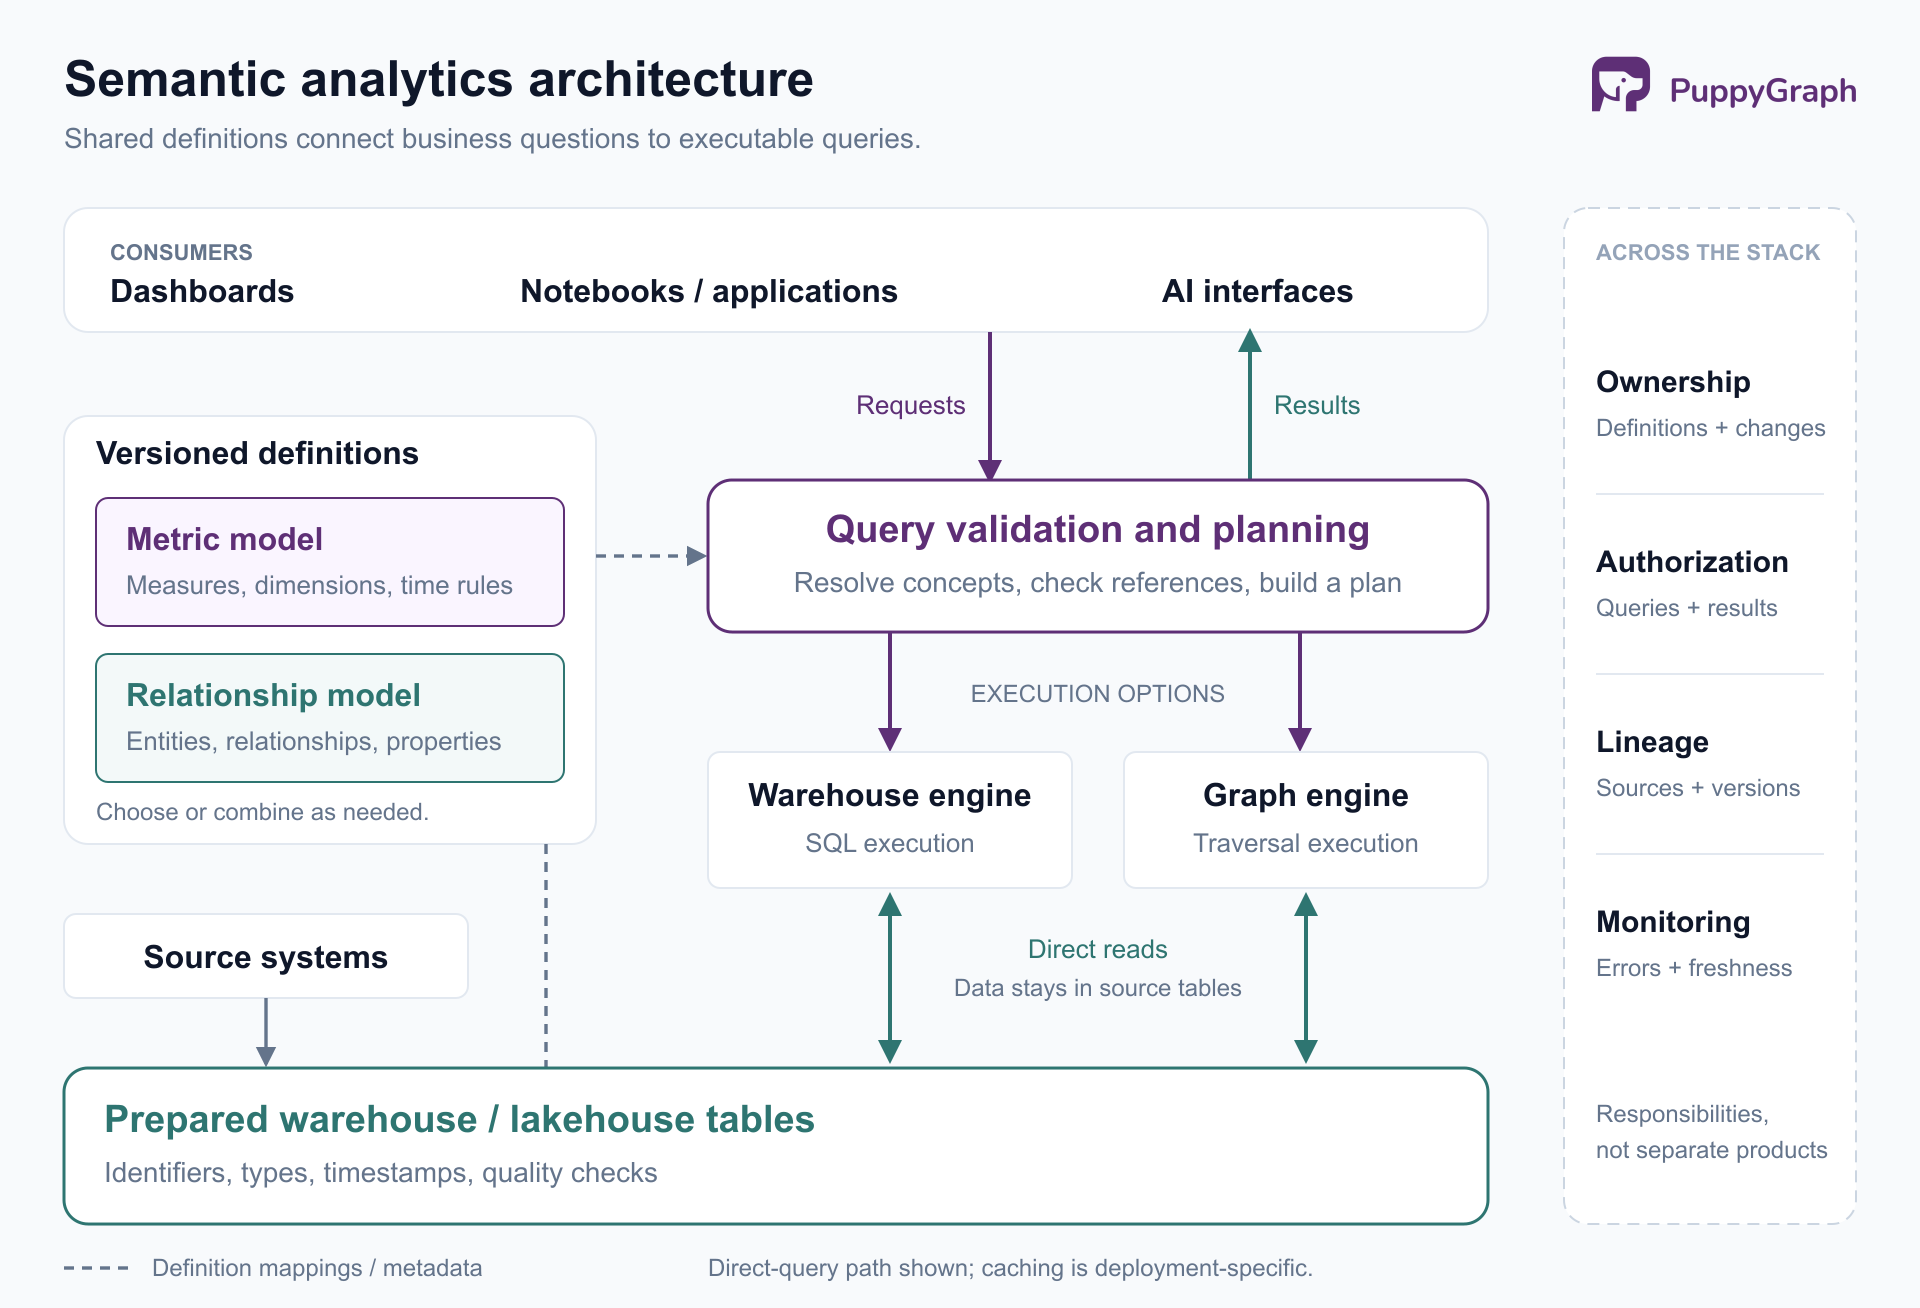
For relationship-oriented analysis, PuppyGraph lets teams define a graph schema over existing data in SQL databases, warehouses, and lakes or lakehouses, including direct reads of open table formats such as Iceberg and Delta Lake. The schema maps tables to nodes, edges, and properties, providing an ontology that analysts and applications can query. Teams define those mappings explicitly, as described in the graph modeling documentation.
PuppyGraph supports openCypher and Gremlin queries. Its default direct-query path reads existing data without requiring a separate graph ingestion pipeline or persistent duplicate dataset. The data-source configuration determines where each node or edge gets its rows. This adds a relationship query path to the analytical estate while leaving source preparation in the existing data workflow.
For AI consumers, PuppyGraph's ontology enforcement validates queries against the model before execution. Invalid entity or relationship references receive structured, LLM-readable feedback that enables a self-correction loop. The team still has to define the ontology correctly and evaluate whether valid queries answer the intended business question.
Benefits of semantic analytics
The benefits come from reusing reviewed definitions and making their behavior inspectable. They depend on consumers actually using the shared model.
Consistent analysis. A defined metric can serve several reports with the same calculation. Differences become easier to investigate because teams can compare filters, data versions, and approved definitions instead of reconstructing each report's hidden logic. Separate definitions remain possible when the business needs them.
Faster follow-up questions. Once a model covers the relevant domain, analysts can change dimensions, filters, or relationship patterns without repeatedly discovering the underlying joins. The time saving comes from prior modeling work. New questions outside that coverage still need engineering and domain review.
Clearer accountability. Named owners and versioned definitions create a place to resolve disagreements. If the business changes its definition of a qualifying subscription, the team can review affected consumers and communicate the change before deploying it.
More inspectable AI answers. An answer can identify the metric, filters, and relationship path behind it. That gives reviewers concrete evidence to check and makes recurring failures easier to diagnose. It also provides a basis for regression tests when either the semantic model or the AI application changes.
The main cost is ongoing stewardship. Shared definitions concentrate responsibility, and an incorrect shared definition can spread an error widely. Start with valuable, bounded coverage and invest in review and tests as usage grows.
How to implement semantic analytics
Begin with a decision and its recurring questions. Choosing a platform before agreeing on those questions makes it difficult to tell whether the implementation has succeeded.
Define a small domain and its owners. Choose a bounded workflow, such as subscription renewal reporting. Collect the questions, existing calculations, and known disagreements. Assign a business owner for meaning and a technical owner for mappings and runtime behavior. Record unresolved definitions before they become interface defaults.
Specify identity, grain, and time. Write down what each entity represents and how records map across systems. For every metric, define the population, formula, dimensions, exclusions, and reporting time basis. Include difficult cases such as merged accounts, partial refunds, missing events, and late-arriving records. Decide whether historical results should change when new information arrives.
Implement the model and query path. Choose a metric-oriented or relationship-oriented interface based on the questions. Map it to prepared data and expose it to an initial consumer. Confirm where calculations execute, which identity authorizes access, and how freshness is reported. If several tools consume the model, verify that their integrations preserve the definitions and filters you rely on.
Test expected answers and failure cases. Build a small reference dataset with outcomes that a domain expert can calculate independently. Include the order with multiple refunds, an account with multiple subscriptions, and a record with a missing relationship. Test totals before and after adding dimensions. For AI, add ambiguous wording and unsupported requests. For access control, verify that permitted and restricted users receive the intended results.
Roll out, observe, and version. Run the first consumer alongside the existing report and reconcile discrepancies. Track repeated definition disputes, unsupported questions, and time spent creating follow-up analyses. Expand coverage when those observations justify it. Review downstream impact before changing a metric or relationship, and preserve a way to explain which definition produced an earlier result.
A successful first release provides a trusted answer to a bounded set of questions. Broader adoption should follow demonstrated reuse, with an owner and maintenance process that can support it.
The future of semantic analytics
A practical direction for semantic analytics is broader reuse across interfaces. A metric used in a dashboard can also serve an embedded application or an AI assistant. The architectural consequence is that definitions increasingly need a stable consumption interface, rather than being tightly coupled to one report.
Existing products show this direction: dbt's Semantic Layer exposes governed metrics to consumers including notebooks, spreadsheets, embedded analytics, and AI systems. That is evidence of a shared-interface approach, not a guarantee that models transfer unchanged between vendors.
AI may also help propose descriptions, mappings, and example queries. Treat those proposals as changes requiring review. A model can suggest that two identifiers represent the same customer, but a domain owner must establish whether that interpretation is valid.
The durable requirement is inspectability. As more software asks questions autonomously, teams need to know which definitions were applied, what evidence was returned, and where uncertainty remains. Semantic analytics provides a place to maintain that context as interfaces evolve.
Conclusion
Semantic analytics makes business meaning explicit in the path from question to result. Metrics require formulas, grain, and time rules; relationship analysis requires identity and meaningful connections. A semantic layer makes those decisions reusable across analytical consumers, including AI applications.
Start with a bounded domain, test answers against reviewed examples, and expand the model as questions demand. The value comes from definitions that teams can use, inspect, and maintain.
Try the forever-free PuppyGraph Developer Edition and book a demo with the team to see how openCypher and Gremlin queries explore relationships across warehouse and lakehouse tables, with no graph-specific ETL, using a semantic model defined over your existing data.

Hao Wu is a Software Engineer with a strong foundation in computer science and algorithms. He earned his Bachelor’s degree in Computer Science from Fudan University and a Master’s degree from George Washington University, where he focused on graph databases.

Get started with PuppyGraph!


Developer Edition
- Forever free
- Single noded
- Designed for proving your ideas
- Available via Docker install
Enterprise Edition
- 30-day free trial with full features
- Everything in developer edition & enterprise features
- Designed for production
- Available via AWS AMI & Docker install