

Agentic Analytics: How It Works, Benefits & Use Cases
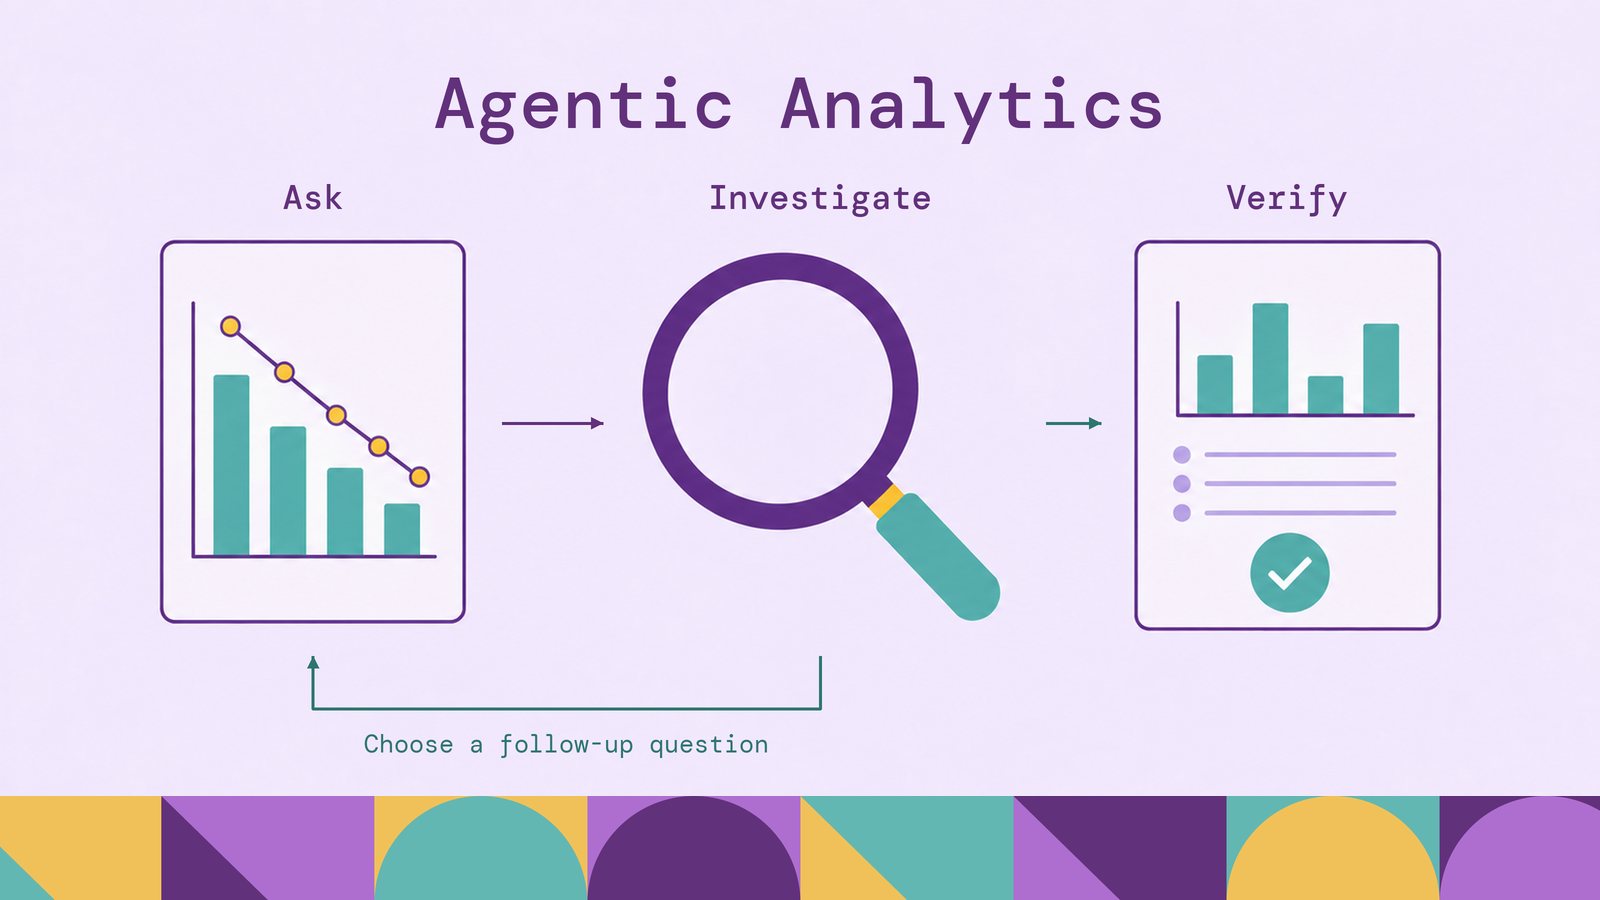
An analytics system becomes more useful when it can investigate the follow-up question its first result creates. A revenue decline might warrant checking discounts, customer segments, or incomplete data. Choosing among those paths requires interpreting evidence, which is the work agentic analytics aims to automate.
The engineering challenge is making that investigation dependable: using agreed metric definitions, querying authorized data, and returning conclusions someone can check. This guide explains the operating loop, its components and trade-offs, practical use cases, and how to evaluate both platform quality and business value.
What is agentic analytics?
Agentic analytics uses AI agents to pursue an analytical goal through a sequence of tool calls, inspect the results, and choose what to investigate next. A large language model typically interprets the request and proposes steps; query engines, calculation tools, and application code execute them.
The defining property is adaptive control over the investigation. A natural-language interface that translates one question into SQL can be useful without being agentic. An agent goes further when it uses the returned data to decide whether to compare another period, inspect a subgroup, retrieve supporting documents, or request clarification. This follows Anthropic's distinction between predefined workflows and agents that dynamically direct their tool use.
Autonomy can remain narrow. An agent might investigate a sales discrepancy and prepare a report while having no permission to change prices or contact customers. Generating an explanation and executing a business action are separate capabilities, with separate authorization requirements.
The goal is a completed, reviewable investigation. Producing more queries or a longer narrative is useful only when it improves that outcome.
How does agentic analytics work?
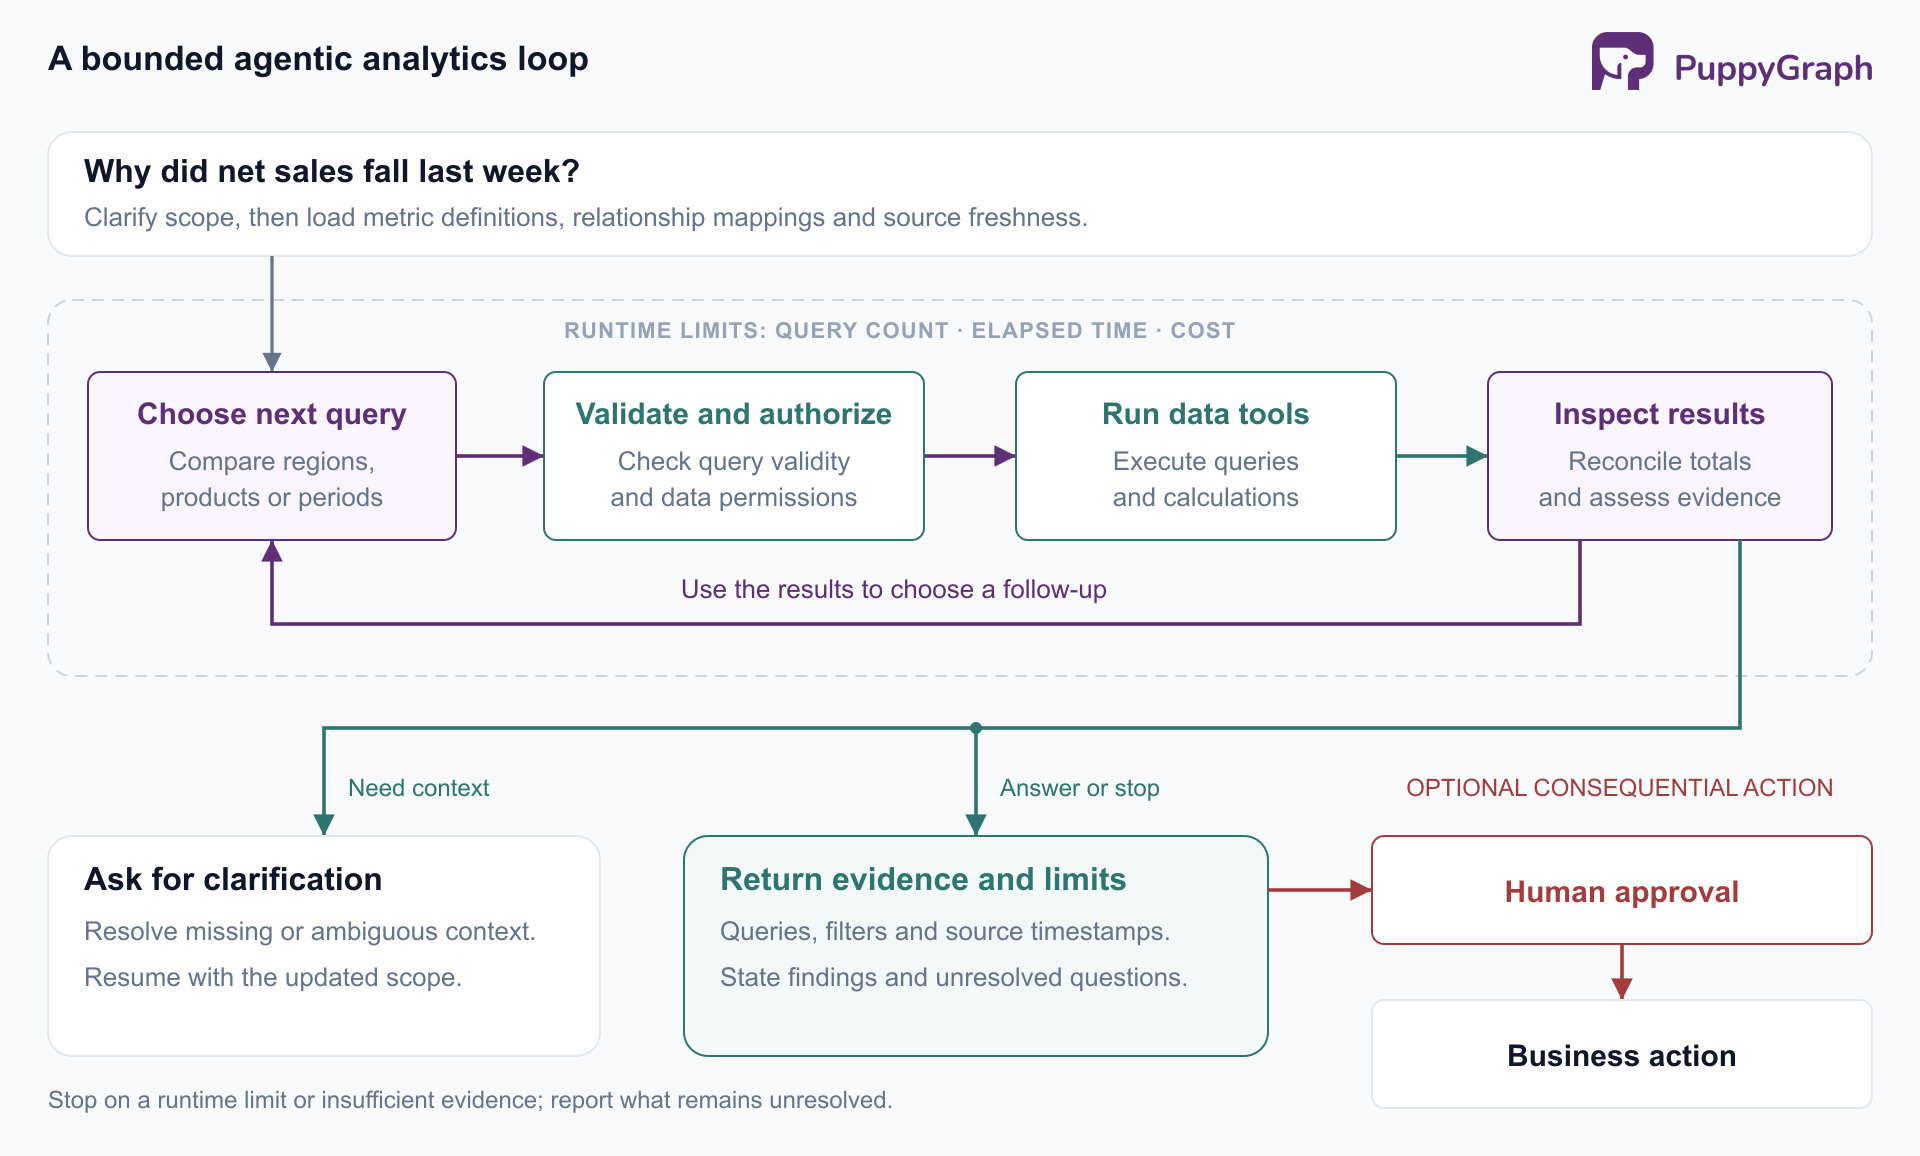
Consider an illustrative request: explain why net sales fell last week. A well-designed implementation follows a bounded loop.
- Establish the question. Resolve the business unit, comparison period, time zone, and definition of net sales. Confirm whether the latest period is complete. If different interpretations would change the answer materially, ask the user before proceeding.
- Retrieve relevant context. Load approved metric definitions, available dimensions, relationship mappings, and source freshness information. The agent needs to know whether returns count on the sale date or the return date before comparing periods.
- Plan and query. Start with totals and then examine contributions by region, product, or channel. Submit tool requests through validation and authorization checks. The database performs aggregation; a calculation tool handles any additional arithmetic.
- Inspect and adapt. Suppose the decline is concentrated in one product line. The agent can compare order volume, unit prices, discounts, and returns for that line. A missing data partition should redirect the investigation toward data completeness, rather than become evidence of falling demand.
- Verify and report. Reconcile subgroup totals with the overall change, identify unsupported hypotheses, and return the relevant queries, filters, source timestamps, and results. Stop when the question is answered, evidence is insufficient, or the configured budget is reached.
Snowflake's Cortex Agents documentation describes a concrete implementation of this plan, use tools, and reflect loop. Its tools include Cortex Analyst for structured data and Cortex Search for unstructured content. That architecture illustrates how an agent can combine numerical results with supporting text without treating the language model itself as the database.
The report should distinguish a measured contribution from a causal explanation. Showing that one product accounts for most of a decline does not establish why customers bought less. The agent may need additional evidence or an experiment before making that stronger claim.
A useful answer might state that lower order volume explains the measured decline, while a promotion change remains an untested explanation. It should also disclose unavailable evidence, such as competitor pricing or incomplete returns data. That boundary tells the reader which decision the analysis can support and what remains unresolved.
Agentic analytics vs traditional analytics
Traditional analytics already includes scheduled reports, anomaly detection, forecasts, and automated alerts. The useful comparison concerns who chooses the next analytical step.
These approaches work together. A finance dashboard can remain the agreed source for monthly reporting while an agent investigates a discrepancy using the same metric definitions. Replacing a reliable scheduled report with a model-directed loop adds little value when the required query is already known.
Key components of agentic analytics
Model and orchestration. The model proposes analytical steps. The surrounding runtime manages tool execution, retries, stop conditions, and escalation. Keep limits on elapsed time, query count, and spending outside the model's discretion. A bounded investigation should still terminate when the model repeatedly proposes unproductive queries.
Data and analytical tools. Expose the capabilities the task requires: SQL queries, metric APIs, document retrieval, graph queries, or statistical functions. Give each tool clear inputs and outputs, including errors and result-size limits. Route numerical work to executable calculations so a reviewer can reproduce the result.
Semantic context. A semantic layer maps business concepts to data and calculations. For example, the dbt Semantic Layer centralizes metric definitions and handles joins. An agent investigating revenue needs those definitions, including aggregation rules and time dimensions, to stay aligned with existing reporting.
Relationship-heavy questions also need explicit entities and connections. An ontology can describe customers, contracts, products, and dependencies. This serves a different need from defining a metric such as net revenue, although one system can expose both. Model the concepts the investigation actually needs and assign owners to maintain them.
For example, a revenue metric might specify how refunds affect an aggregate, while a relationship model distinguishes the customer that pays an invoice from the subsidiary that uses the product. Both distinctions matter when an agent attributes a revenue change to an account. Neither can be safely inferred from similar column names alone.
State and evidence. Retain the request, tool inputs, returned results, query identifiers, and unresolved questions. Record the semantic-model version and relevant data versions where available. Persisting this state makes a run inspectable and helps the agent avoid repeating work. Memory alone does not establish that a remembered conclusion is correct.
Governance and observability. Enforce access in the tool and data layers. Capture failures, denied requests, latency, and cost alongside successful results. Define when a person must review an answer or approve an action. These controls make it possible to investigate both the business question and the system's behavior.
Benefits of agentic analytics
The benefits are clearest in workflows where a person repeatedly moves between questions, queries, and supporting evidence. The following are illustrative use cases, not claims of measured deployment results.
Revenue and margin investigations. An agent can compare sales movements across products, check whether discounts explain lower margins, and retrieve relevant promotion notes. Automating the intermediate lookups can shorten the time an analyst spends assembling evidence. Finance still owns metric definitions and the interpretation of accounting adjustments.
Customer retention analysis. An investigation can combine renewal dates, product usage, unresolved support tickets, and account relationships to identify accounts needing attention. The output should show which signals apply to each account and their dates. A customer-success team can then assess the context before choosing an intervention; a risk signal is not proof that a customer will leave.
Supply-chain exception analysis. Starting from a delayed order, an agent can follow product and supplier relationships, inspect affected inventory, and identify other orders sharing the dependency. This is useful when each result changes the next lookup. Procurement retains responsibility for commercial commitments and substitute-supplier decisions.
Broader access to exploratory analysis. A business user can begin with a question in ordinary language and refine it through clarification. The benefit depends on access to curated definitions and inspectable evidence. A fluent answer without those foundations can merely move the burden of checking correctness to the user.
Across these cases, the practical gain is less manual coordination between analytical steps. Measure it through completed investigations and the work people can do with the findings.
Agentic analytics challenges
Semantic errors and data quality. An executable query can answer the wrong question. Joining order-level revenue to multiple support tickets can inflate totals; comparing a partial week with a complete week can suggest a false decline. Check data grain, join cardinality, completeness, and metric definitions. Schema validation catches only the errors represented in its rules.
Unsupported explanations. An agent may find a correlation and describe it as a cause, or keep searching until it finds a subgroup that supports its first hypothesis. Separate observed facts from interpretations. Require uncertainty estimates and appropriate statistical checks where the analytical method calls for them, and avoid automatic causal claims from descriptive queries.
Prompt injection and access leakage. Retrieved tickets or documents can contain instructions intended to redirect the agent. OWASP's prompt-injection guidance recommends layered controls, including separation of untrusted content and restricted tool access. A valid query can still request information the user should not receive, so semantic validation and authorization must remain separate checks.
Cost, latency, and review burden. Follow-up queries, retries, and model calls consume resources. Anthropic's agent-design guidance identifies cost and latency as trade-offs of agentic systems. Set budgets and track the effort required to verify answers. A fast generated report has limited value if reviewing it takes longer than doing the analysis directly.
Start with bounded, read-only investigations. Extend autonomy when evaluations show the workflow is reliable and the organization can support its operating costs.
How to measure agentic analytics ROI
Choose a workflow with a measurable baseline, such as investigating weekly sales exceptions. Record analyst effort, turnaround time, correction rates, and the number of investigations completed to an agreed quality standard. Compare a pilot with similar work performed through the existing process.
Track three groups of measures:
- Quality: correct metrics, supported conclusions, appropriate abstentions, and authorization compliance. Include failed and abandoned investigations in the denominator.
- Efficiency: human effort per accepted investigation, end-to-end turnaround, and total cost per accepted result. Include review, correction, model calls, and data-platform compute.
- Business outcomes: realized savings, additional useful analytical capacity, or improvements in the operational decision the analysis supports. Avoid attributing an entire revenue change to the agent without a credible comparison.
For a financial calculation, use a consistent period:
ROI = (recognized benefits − total program costs) / total program costs × 100%
As a hypothetical example, suppose a team completes 200 comparable investigations monthly. If net human effort falls by 45 minutes per investigation, including review and rework, that releases 150 hours. At an assumed loaded labor rate of $80 per hour, the capacity value is $12,000. With $7,000 in monthly program costs, the capacity-based return is approximately 71%.
That is not automatically a cash saving. Report released capacity separately unless it reduces expenditure or produces a measured additional outcome. Include integration, semantic modeling, evaluation, maintenance, and allocated setup costs in the program total. Also check that easier access has not increased investigation volume enough to erase the expected savings.
Set acceptance thresholds before the pilot. An apparent productivity gain should not qualify as success if the answers fail the agreed accuracy standard or expose unauthorized data. Compare results by task difficulty so an improvement on simple lookups does not conceal regressions on complex investigations.
How to evaluate an agentic analytics platform
Build the evaluation around your own questions, permission boundaries, and accepted answers. Test ambiguous requests, incomplete periods, misleading correlations, denied data access, and questions the available evidence cannot answer. Anthropic's evaluation guidance recommends repeated trials because agent behavior varies, and distinguishes what an agent reports from the outcome it actually achieves.
Use the same tasks to examine several dimensions:
Check the boundary between analysis and action explicitly. OWASP's excessive-agency guidance recommends minimal tool functionality and permissions, downstream authorization, and approval for high-impact actions. A platform should demonstrate these controls through execution behavior.
For investigations that depend on relationships, evaluate the data-access layer as well. PuppyGraph lets teams define a graph schema over existing SQL databases, warehouses, and lakes or lakehouses, including direct reads of open table formats such as Iceberg and Delta Lake. Its default zero-ETL path queries existing data without requiring ingestion into a separate graph store. Agents can query the modeled relationships through openCypher or Gremlin.
The graph schema functions as an ontology. PuppyGraph's ontology enforcement validates queries against that model before execution and returns structured, LLM-readable feedback for invalid entity or relationship references. An agent can use that feedback to correct its query. The built-in AI assistant applies this loop to natural-language questions. This addresses grounding on modeled relationships; your evaluation still needs to test metric correctness, permissions, and the conclusions drawn from valid results.
The future of agentic analytics
A useful direction for agentic analytics is tighter integration with the definitions, permissions, and review practices already used for business reporting. More autonomous investigation is valuable when the evidence remains inspectable and the system can recognize when it needs clarification or human judgment.
The existing separation between models, orchestration, semantic context, and execution tools gives teams room to improve each component independently. A better model may select more useful questions; clearer metric definitions may prevent an entire class of wrong answers. Both changes should face the same evaluation tasks before rollout.
Adoption should therefore expand by demonstrated task competence. Start with a recurring investigation, measure accepted outcomes, and widen scope when reliability and economics justify it. The durable advantage is an analytical workflow that produces useful evidence with less effort and an explicit account of its limits.
Agentic analytics FAQs
Is agentic analytics the same as conversational BI?
Conversational BI describes how users interact with analytics. Agentic analytics describes how the system conducts an investigation. A conversational interface can provide either a single query response or an adaptive sequence of analytical steps.
Does agentic analytics require multiple agents?
No. One agent with suitable tools can run the investigation loop. Add specialized agents when task separation provides a measurable benefit that justifies the extra coordination and evaluation work.
Do you need a semantic layer?
An agent can query raw tables, but dependable business analysis needs explicit definitions and relationship rules. These may be provided through governed views, metric APIs, or a dedicated semantic layer. The requirement is consistent meaning that execution can honor.
Will agentic analytics replace data analysts?
It can automate parts of investigation and report preparation. Analysts still define metrics, assess evidence, resolve ambiguity, and work with domain owners on consequential decisions. Evaluate changes in task effort before drawing conclusions about staffing.
Try the forever-free PuppyGraph Developer Edition and book a demo with the team to see how openCypher and Gremlin queries connect warehouse and lakehouse tables, with no graph-specific ETL, to provide relationship context for agentic analytics.

Hao Wu is a Software Engineer with a strong foundation in computer science and algorithms. He earned his Bachelor’s degree in Computer Science from Fudan University and a Master’s degree from George Washington University, where he focused on graph databases.


