

What Is Augmented Analytics? Benefits, Uses & Examples
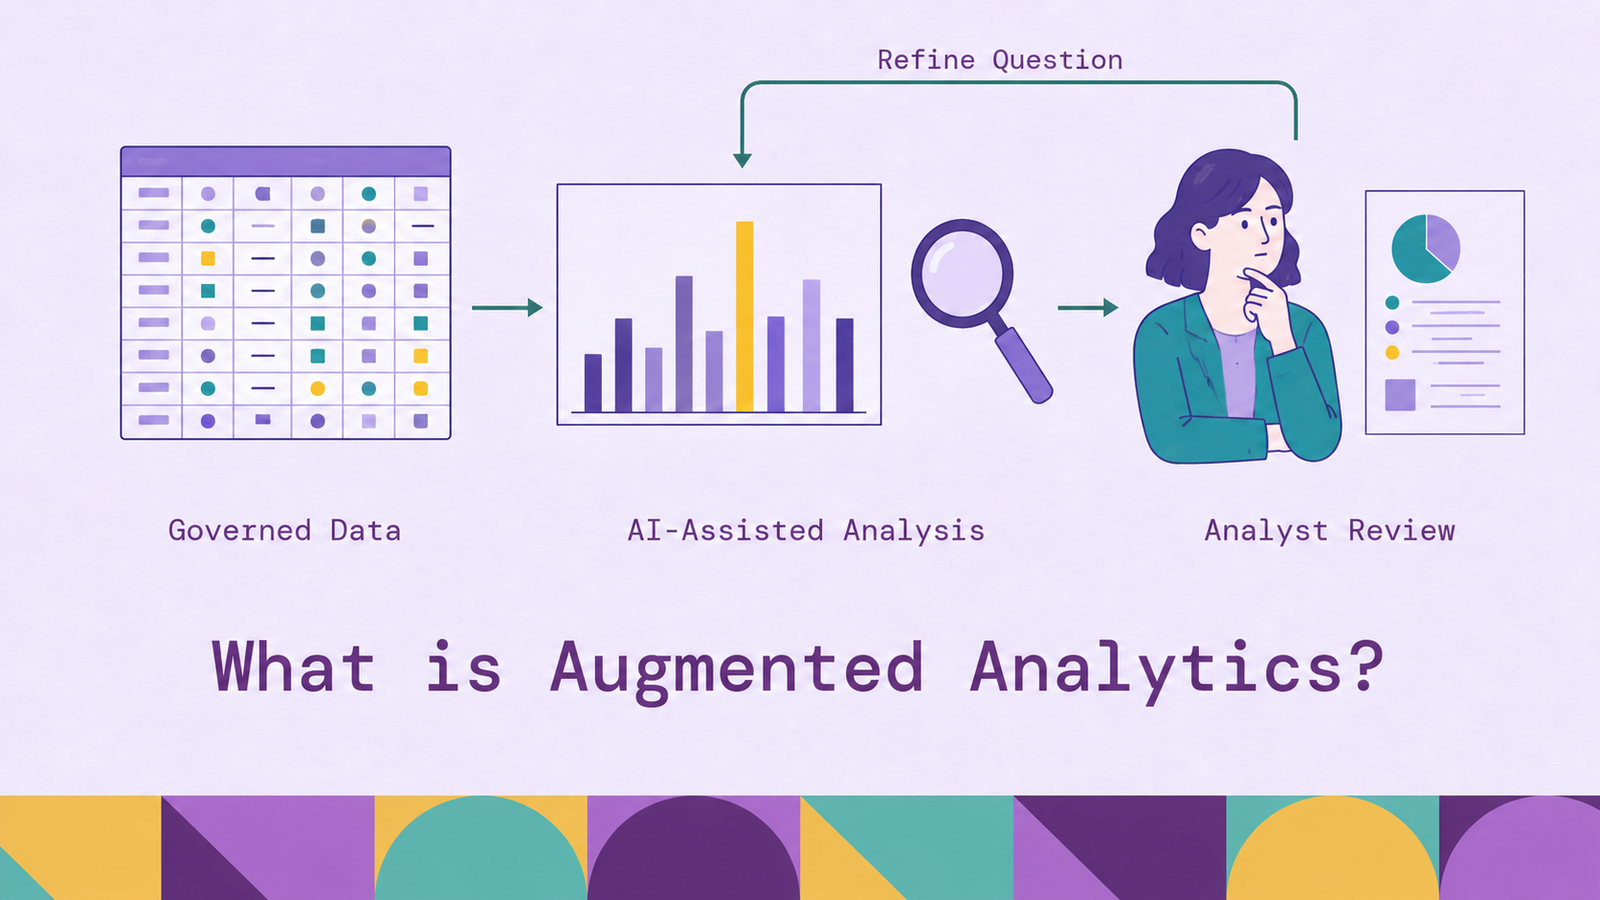
The value of augmented analytics depends on whether automated steps help people reach a defensible answer: which records support a finding, what a metric means, and what still needs investigation.
A conversational interface is one way software supports this work. Other capabilities include automated profiling, statistical analysis, and suggested follow-up questions. This article explains how those capabilities work, where they help, and how to implement them while keeping business definitions and analytical judgment explicit.
What is augmented analytics?
Augmented analytics uses artificial intelligence, machine learning, and language technologies to assist people throughout data analysis. Depending on the platform, it can suggest preparation steps, identify unusual values, rank factors associated with an outcome, or turn query results into a written explanation.
The defining feature is assistance within the analytical workflow. A scheduled data refresh automates updating the data behind a dashboard. A feature that examines a changed metric and proposes relevant segments to investigate augments analysis. Both scheduled refresh and analytical assistance can operate without a chatbot. Retrieving an existing dashboard through chat does not itself add analysis.
Consider a retailer investigating rising returns. An augmented workflow might identify product categories with unusual return rates, compare them with their historical baselines, and suggest examining fulfillment locations. The analyst still determines whether the comparison is fair and whether the finding warrants action.
This assistance already appears inside familiar BI products. Microsoft's Power BI key influencers visual analyzes factors associated with a selected metric. That is a concrete example of augmentation: the software performs a statistical investigation that the report reader can inspect and refine.
How does augmented analytics work?
A useful way to understand the workflow is to follow one question: Why did the return rate increase last month?
Establish the data and meaning. The system needs order lines, returns, product attributes, and relevant dates. It also needs a definition of return rate. Returns received last month divided by orders shipped last month mixes different populations; returns associated with a shipment cohort answers a different question. The metric owner must settle that distinction.
Prepare the inputs. Data profiling can surface missing identifiers, inconsistent categories, and unexpected distributions. Suggested cleaning steps need review. Two similar product names may refer to different items, while a missing return reason may reflect a workflow problem worth investigating.
Run an analysis. The platform executes queries and, where supported, statistical or machine learning methods. It might compare return rates by category, identify an unusually large change, or rank attributes associated with returns. Available fields, filters, and sample sizes constrain what it can find.
Present evidence and support follow-up. The interface returns a chart, ranked findings, or narrative. A useful answer includes the metric definition, comparison period, filters, and supporting records or aggregates. The analyst can then exclude an incomplete period, inspect a segment, or test another explanation.
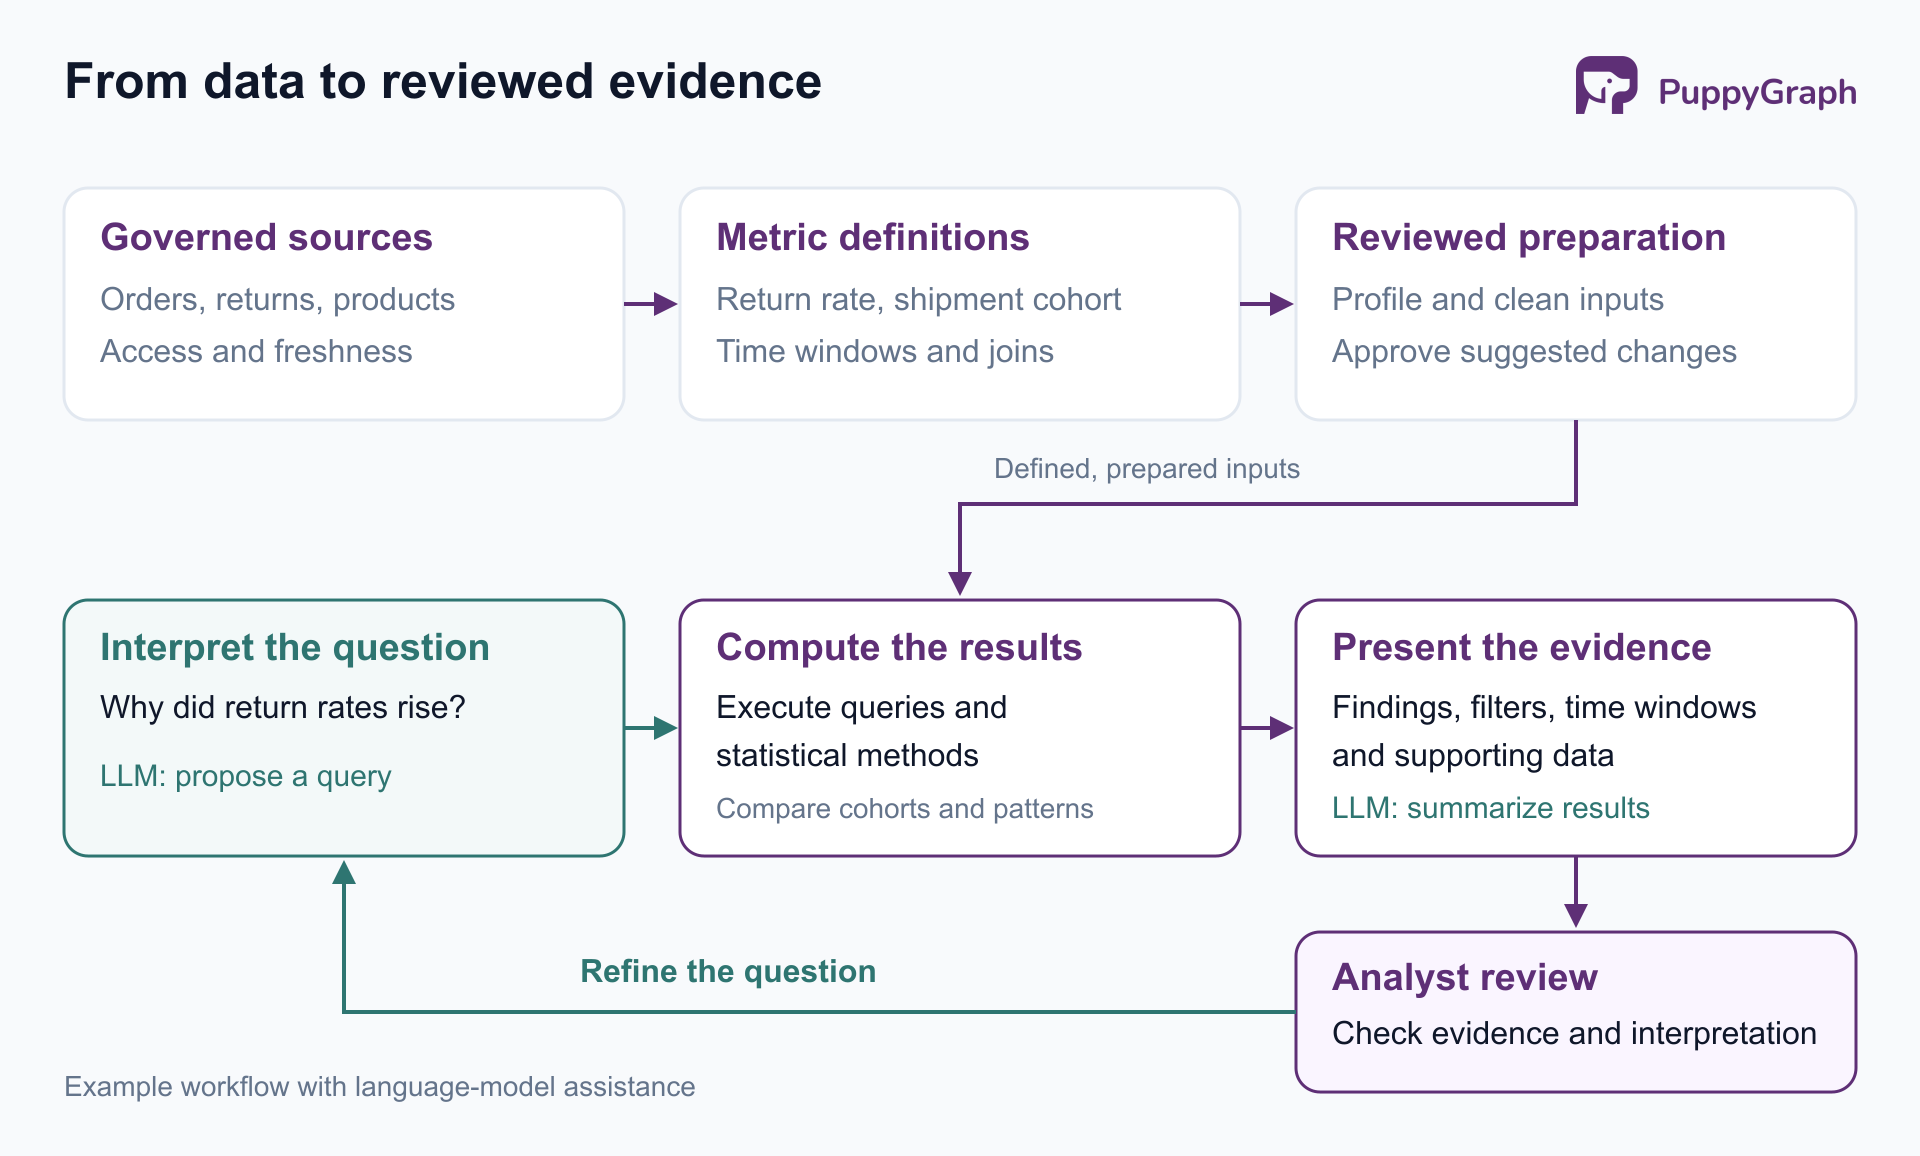
This is an iterative process. A useful initial result often changes the next question, and the system should preserve enough context to make that revision traceable.
For example, the initial increase might disappear after separating recently shipped orders from cohorts with a complete return window. The useful output is then a corrected comparison, not a dramatic explanation. If the increase remains, the analyst can investigate product mix or fulfillment changes using the same cohort definition. That continuity prevents each follow-up from quietly answering a different question.
What technologies power augmented analytics?
Several technologies contribute different capabilities. A product may combine them, but no single component supplies the entire workflow.
Statistical methods and machine learning identify patterns in observed data. Regression can estimate associations with an outcome; clustering can group similar records; anomaly detection can flag observations that depart from a baseline. Their outputs depend on the chosen method and the data available to it.
Natural language processing and large language models help interpret questions, generate candidate queries, and describe results. These functions need access to relevant metadata and controlled execution tools. Fluent text alone provides no evidence that a calculation occurred or used the intended data.
Semantic models and metadata define the vocabulary available to the analysis. Metrics, dimensions, entity relationships, and field descriptions help map a request to an executable query. For example, Looker's Conversational Analytics uses LookML definitions to ground natural-language questions in its semantic model, then analyzes executed query results to answer users.
Automated model development, often called AutoML, can assist with preprocessing, model selection, and parameter tuning. It is relevant when a workflow includes prediction, but is not a requirement for every augmented analytics feature. A natural-language interface to governed aggregates may need no predictive model.
Query engines perform the underlying data access and aggregation. Keeping these responsibilities visible makes it easier to evaluate a platform: language interpretation, computation, and statistical inference each have different failure modes.
How AI and machine learning enhance analytics
AI can expand the set of candidate questions explored during an investigation. Instead of manually building every regional, product, and customer breakdown, an analyst can use automated analysis to surface promising places to look. That reduces repetitive exploration when the candidates are relevant and inspectable.
Machine learning also supports prediction. In the retailer example, a model might estimate return likelihood using information available when an order ships. Evaluating that model requires separating training from evaluation data and excluding information unavailable at prediction time. The scikit-learn guidance on data leakage explains how using unavailable information can produce misleadingly optimistic evaluation results.
Language models add an interaction layer around this work. They can translate a question into a proposed analysis and summarize computed findings for a reader who does not write queries. The generated explanation should preserve qualifications, including missing data and uncertainty.
These capabilities support investigation without establishing causation. Tableau's Explain Data documentation explicitly distinguishes statistical explanations from causal conclusions. A fulfillment location associated with returns may handle a different product mix. Changing that location may have no effect on returns. An automated finding supplies a hypothesis; establishing the effect of an intervention requires an appropriate experimental or causal design.
How augmented analytics changes the data analytics process
Traditional analytics already includes automation, statistical models, and interactive dashboards. The distinction is how much analytical work the user must specify and how much the software proposes. The following comparison describes typical workflows, rather than mutually exclusive product categories.
For a recurring returns review, the analyst's effort can move from creating routine cuts to checking cohort definitions, investigating exceptions, and evaluating proposed explanations. This changes the work allocation, not the standard of evidence.
The handoff also changes. A dashboard alone may no longer capture an investigation involving several conversational follow-ups. Teams should retain the executed queries, filter state, source freshness, and final interpretation so another analyst can reconstruct the answer. That record becomes especially useful when a later question produces a different result.
Augmented analytics use cases
The following scenarios illustrate possible workflows, rather than reported customer outcomes. Each starts with a decision and identifies the analysis that could support it.
Retail returns and inventory. A merchandising team can investigate changes in returns by product, supplier, and fulfillment location. Automated segmentation can identify cohorts for review, while forecasting can support replenishment planning. Analysts need to account for incomplete return windows and stockouts, since recorded sales do not capture purchases that unavailable inventory prevented.
Customer retention. A subscription business can explore relationships between renewal outcomes, product usage, and support history. The system might surface a cohort with falling usage and repeated unresolved tickets. Account teams can use that finding to prioritize investigation, while analysts check that the model uses only information available before renewal.
Operational performance. A service team can examine growing resolution times across ticket categories, routing queues, and escalation paths. An augmented interface can propose useful breakdowns and summarize the records behind a delay. Teams should compare like-for-like workloads before interpreting a queue's longer resolution time as a performance problem.
Sales planning. A revenue operations team can examine changes in pipeline conversion by region, deal stage, and customer segment. Automated comparisons can highlight where a forecast diverges from observed outcomes. Stage-definition changes and incomplete sales cycles need explicit treatment before teams compare periods.
Supply chain investigation. Procurement teams can explore delayed deliveries across orders, suppliers, components, and facilities. Relationship analysis can help trace which orders depend on a shared supplier or part. A flagged dependency identifies where to investigate exposure; it does not establish that disruption will occur.
Benefits of augmented analytics
The benefits depend on the task, data quality, and review burden. They should be measured against the existing workflow.
Less repetitive analysis. Suggested breakdowns and generated queries can reduce the effort required to answer recurring questions. The useful measure is time to a validated answer, including corrections, rather than time to the first chart.
Broader access to governed data. Natural-language questions can let people explore approved metrics without learning a query language. They still need to understand the business question and recognize when the answer requires specialist review.
More systematic exploration. Automated analysis can examine candidate segments that an analyst might otherwise skip. This is useful when the search is bounded by relevant fields and findings include enough evidence to distinguish a meaningful pattern from noise.
More consistent interpretation. When multiple interfaces use shared metric definitions, users have a common basis for comparing results. That benefit comes from the semantic model and its maintenance; adding a language model does not reconcile conflicting definitions by itself.
These gains matter when they improve a real decision. A team that produces more findings but spends longer resolving their inconsistencies may have increased analytical activity without improving its process.
Challenges of augmented analytics
Data quality and ambiguity. Missing records, inconsistent identifiers, and unclear metric definitions propagate into automated results. A query can execute successfully while counting the wrong population. Teams need ownership of both source quality and business meaning.
Statistical validity. Automated exploration can surface chance associations, particularly across many small segments. Predictive models may also perform poorly when operating conditions differ from training data. Review should consider sample size, validation design, and whether a finding survives a reasonable change in the comparison.
Generated errors and misplaced trust. A language model can choose the wrong field, omit a filter, or write a conclusion stronger than the query supports. Google's Conversational Analytics guidance warns that plausible output can be factually incorrect and recommends validation. Show the calculation and evidence alongside the prose, and allow the system to request clarification.
Access control and sensitive data. A conversational interface creates another route to data. Apply the intended user's permissions during execution and review what appears in prompts, results, caches, and logs. A helpful answer must still respect the boundaries of the user's access.
Cost and maintainability. An apparently simple question may trigger multiple queries, model calls, or statistical jobs. Evaluate the whole execution path, including retries. Assign owners to semantic definitions and evaluation cases so schema changes do not silently invalidate working questions.
How to implement augmented analytics
Start with a bounded workflow and expand after measuring its performance. A pilot should test whether users can obtain correct, useful answers under realistic conditions.
1. Choose a decision and baseline. Select a recurring investigation, such as reviewing elevated return rates. Record how long the current process takes, where analysts intervene, and what evidence the decision-maker needs. Specify which outputs require human approval.
2. Prepare governed inputs. Identify authoritative tables, define the analysis grain, and document metrics, joins, time windows, and freshness expectations. Resolve known identifier problems. Make permission checks part of the execution path before exposing a conversational interface.
3. Match capabilities to the workflow. If users struggle to formulate queries, evaluate natural-language access. If they spend time finding unusual segments, evaluate automated statistical exploration. Require the platform to show its supporting calculations. Test it against the actual data model rather than a demonstration dataset.
4. Build an evaluation set. Include common questions with independently checked answers, ambiguous wording that should trigger clarification, and requests that should be denied. For prediction, use evaluation data that reflects the intended deployment. For conversational analysis, check selected metrics, filters, joins, calculations, and narrative fidelity separately.
5. Pilot, monitor, and assign ownership. Measure time to validated answers, correction rates, execution cost, and user adoption. Record failures and rerun relevant evaluations after changes to data, definitions, or models. Keep an analyst responsible for unresolved interpretations and a data owner responsible for the underlying model.
A practical acceptance test is to give the same returns question to the pilot and an experienced analyst, then compare their evidence. Did both choose the shipment cohort? Did they exclude cancelled orders consistently? Did the generated explanation describe the observed association without inventing a cause? A correct total is only one part of a correct answer. Review the intermediate choices before deciding that the workflow is ready for wider use. Save the accepted interpretation with the test case so later evaluations can detect changes in meaning as well as changes in numbers.
For questions involving connected entities, include relationship semantics in that model. A supplier investigation may need to follow supplier-to-component-to-order relationships while preserving what each relationship means. PuppyGraph lets teams define a graph schema over existing SQL databases, data warehouses, and data lakes or lakehouses. On its default direct-query path, data stays in the source without graph-specific ETL.
That schema functions as an ontology of entities, relationships, and properties. PuppyGraph's ontology enforcement validates queries before execution, rejecting invalid references and returning structured feedback that an AI assistant can use to correct its query. Its built-in AI assistant accepts natural-language questions and generates graph queries against that model. This supplies a grounded relationship-query path within an augmented workflow. Analysts still validate source data, metric definitions, and conclusions.
Conclusion
Augmented analytics helps people prepare data, explore patterns, and communicate results with less manual work. Its usefulness rests on explicit definitions, appropriate analytical methods, and evidence that a reader can inspect. Start with one decision, evaluate complete answers, and expand as the workflow demonstrates value.
Try the forever-free PuppyGraph Developer Edition and book a demo with the team to see how openCypher and Gremlin queries connect entities across warehouse and lakehouse tables, with no graph-specific ETL, to support relationship-aware analysis.

Hao Wu is a Software Engineer with a strong foundation in computer science and algorithms. He earned his Bachelor’s degree in Computer Science from Fudan University and a Master’s degree from George Washington University, where he focused on graph databases.


