The article

Query your table as a graph.Petabytes. Subsecond. No data movement.
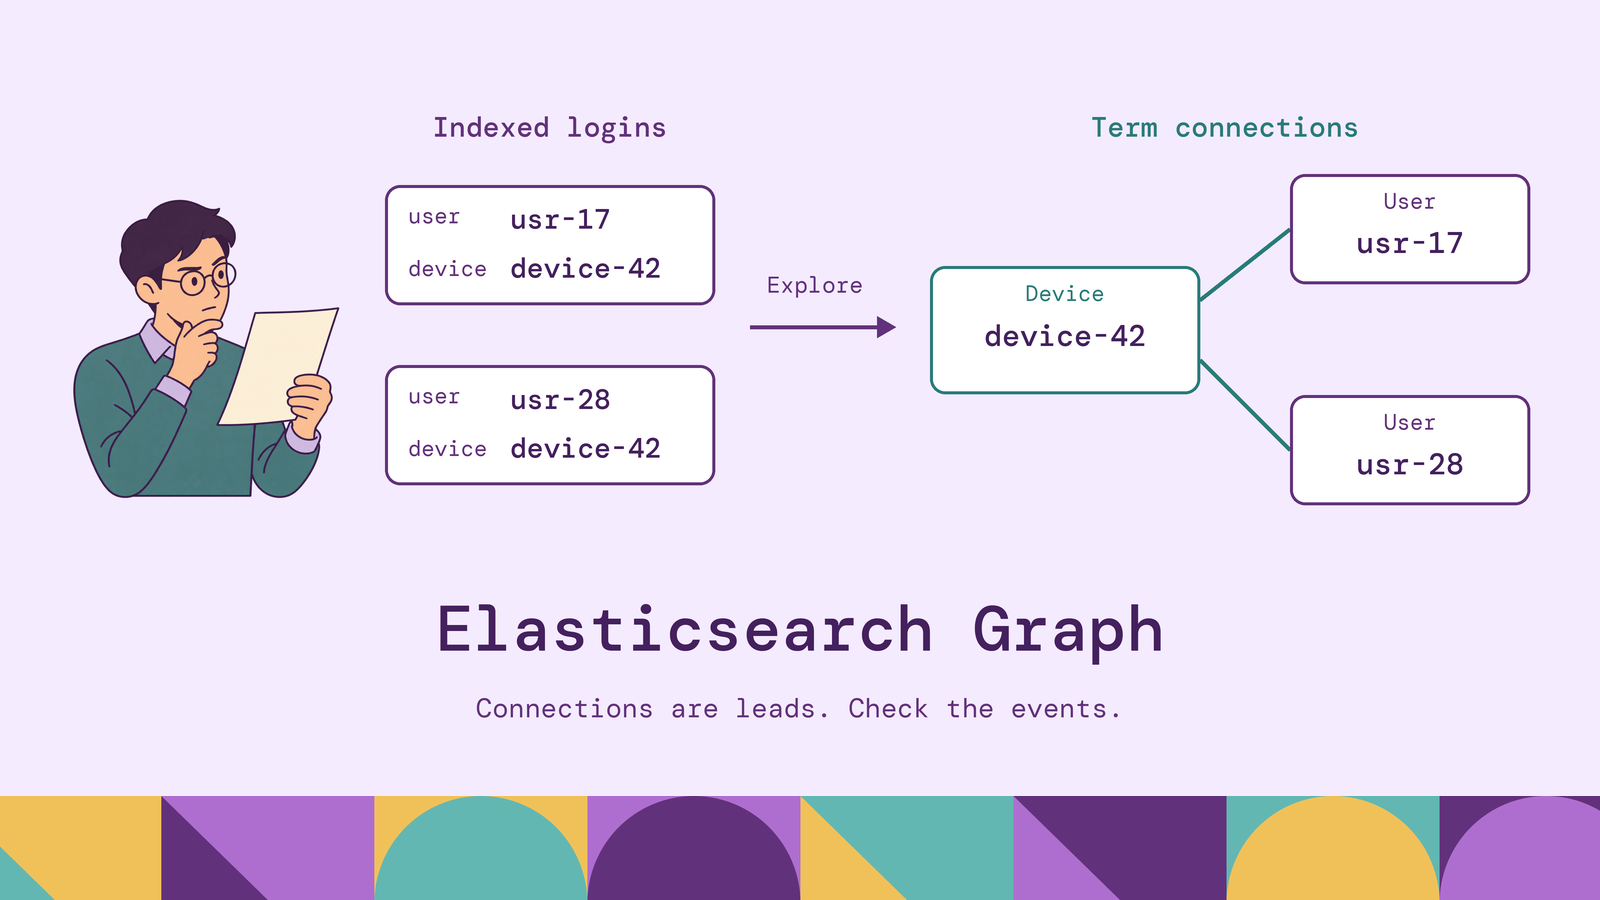
Elasticsearch Graph is useful for finding associations worth investigating, but interpreting those associations requires knowing which documents were sampled and which terms were filtered out. A line between two users and a shared device can suggest a lead; it cannot establish that the users share an identity.
This guide explains the mechanics, API, and architecture, then follows an authentication-event example through exploration and evidence checking. It also shows where explicit graph relationships answer a different question.
What is Elasticsearch Graph?
Elasticsearch Graph combines an Elasticsearch exploration API with Kibana's interactive Graph application. A vertex represents a term in an indexed field. A connection summarizes documents containing both terms. Elastic derives those connections using aggregations over existing indices, without requiring a separately stored graph dataset. See Elastic's Graph overview.
For authentication records, a vertex might be device_id: device-42. A connected user_id: usr-17 vertex means the terms appear together in the documents considered. The field matters: identical strings in different fields represent different vertices.
A property graph database instead models entities and explicit relationships, which can carry types, direction, and properties. The property graph model supports questions expressed as paths through those relationships.
| Question | Elasticsearch Graph | Property graph database |
|---|---|---|
| What is a vertex? | An indexed field/term pair | A modeled entity |
| What is a connection? | A summary of document co-occurrence | An explicitly represented relationship |
| What defines exploration? | Seed queries, fields, sampling, and term selection | Relationship types, properties, and path constraints |
| What needs interpretation? | Whether an association has domain significance | Whether the modeled relationship accurately represents the source |
Both can visualize networks. The useful distinction is what each connection asserts and how that assertion was produced.
For example, discovering that two users appear with the same device is an association question. Asking for login-event paths that meet a specified time window and preserve each event's application is a modeling and traversal question. Choose the representation from the evidence the answer must retain, rather than from whether the interface draws circles and lines.
How does Elasticsearch Graph work?
Graph exploration starts with a seed query, such as events involving usr-17. The selected vertex fields determine which terms to extract. A connection step then finds terms associated with those vertices; nested connection steps extend the exploration.
Co-occurrence provides evidence. If a login document contains a user and a device, it can support a connection between them. The document's meaning determines the relationship's meaning. Successful logins, failed attempts, and device inventory records should not silently become interchangeable evidence.
Significance prioritizes unusual associations. With significance enabled, Graph considers how strongly terms are associated with the selected documents relative to their background frequency. Elastic's significant terms documentation explains the foreground/background comparison. An application used by almost everyone may be less informative than one concentrated among the users under investigation. A significance score is not a probability of fraud or a causal explanation.
Sampling limits the evidence considered. Each exploration hop uses a sample of matching documents per shard. Elasticsearch's sampler aggregation illustrates this focus on top-scoring documents rather than exhaustive enumeration. A larger sample can include more evidence, but it also increases work and can introduce less relevant material.
These choices shape the graph. A missing connection can reflect filtering or sampling, so absence from the visualization does not prove absence from the underlying events.
Document granularity also changes the meaning. One document per login preserves the user/device pairing. A daily summary containing separate arrays of users and devices puts all those values together without recording which user used which device. Elasticsearch's array mapping documentation explains the additional association problems with flattened arrays of objects. Decide what one document represents before treating its co-occurrences as evidence. The examples below deliberately keep each login in its own document.
How to use the Elasticsearch Graph API
Use POST /<index>/_graph/explore with a JSON body. The API reference specifies the required read index privilege. Creating and loading the example index also requires appropriate write and index-creation permissions. Confirm that your deployment's subscription includes Graph exploration.
The following illustrative requests use Kibana Console syntax. Start with a new example index. Map identifiers as keyword fields so exact values remain available for term queries and aggregations:
PUT login-events-example
{
  "mappings": {
    "properties": {
      "@timestamp": { "type": "date" },
      "user_id": { "type": "keyword" },
      "device_id": { "type": "keyword" },
      "app_id": { "type": "keyword" },
      "outcome": { "type": "keyword" }
    }
  }
}
Load a small fictional fixture through the bulk API. Each action line is followed by its document; retain the final newline. refresh=wait_for makes the writes searchable before the request finishes. When security is enabled, using this refresh option also requires the maintenance or manage index privilege.
POST login-events-example/_bulk?refresh=wait_for
{"index":{"_id":"evt-1"}}
{"@timestamp":"2026-01-10T09:00:00Z","user_id":"usr-17","device_id":"device-42","app_id":"portal","outcome":"success"}
{"index":{"_id":"evt-2"}}
{"@timestamp":"2026-01-10T10:00:00Z","user_id":"usr-28","device_id":"device-42","app_id":"ledger","outcome":"success"}
{"index":{"_id":"evt-3"}}
{"@timestamp":"2026-01-11T09:00:00Z","user_id":"usr-28","device_id":"device-58","app_id":"ledger","outcome":"success"}
{"index":{"_id":"evt-4"}}
{"@timestamp":"2026-01-12T09:00:00Z","user_id":"usr-61","device_id":"device-58","app_id":"vault","outcome":"success"}
The fixture is intentionally small enough to inspect by eye. It teaches request structure, not statistical significance. Check the bulk response for item errors before exploring it.
This request starts from usr-17, extracts devices, and looks for other users associated with them:
POST login-events-example/_graph/explore
{
  "query": { "term": { "user_id": "usr-17" } },
  "controls": { "use_significance": false },
  "vertices": [
    { "field": "device_id", "min_doc_count": 1,
      "shard_min_doc_count": 1 }
  ],
  "connections": {
    "vertices": [
      { "field": "user_id", "exclude": ["usr-17"],
        "min_doc_count": 1, "shard_min_doc_count": 1 }
    ]
  }
}
Both thresholds are lowered to admit single-document connections in the fixture, and significance filtering is disabled. Those settings are for understanding sparse evidence; they should not become an unexamined production default.
Read the request as four separate choices:
| Request member | Role in this example |
|---|---|
query | Select the events from which exploration starts |
vertices | Extract device identifiers from that starting set |
connections | Explore user identifiers associated with those devices |
controls | Turn off statistical significance filtering |
The seed user is intentionally excluded from the connected-user field. Without that exclusion, rediscovering the starting user would add little to the investigation. In an application that expands interactively, track already displayed field/term pairs so subsequent requests can focus on new information.
Elasticsearch Graph API architecture
The request travels from Kibana or an HTTP client to Elasticsearch. Elasticsearch distributes search and aggregation work across the targeted shards; each shard holds a subset of the indexed documents. That distribution follows Elasticsearch's existing cluster and shard architecture. Graph shares the search cluster's resources, so broad explorations need the same workload discipline as other analytical requests.
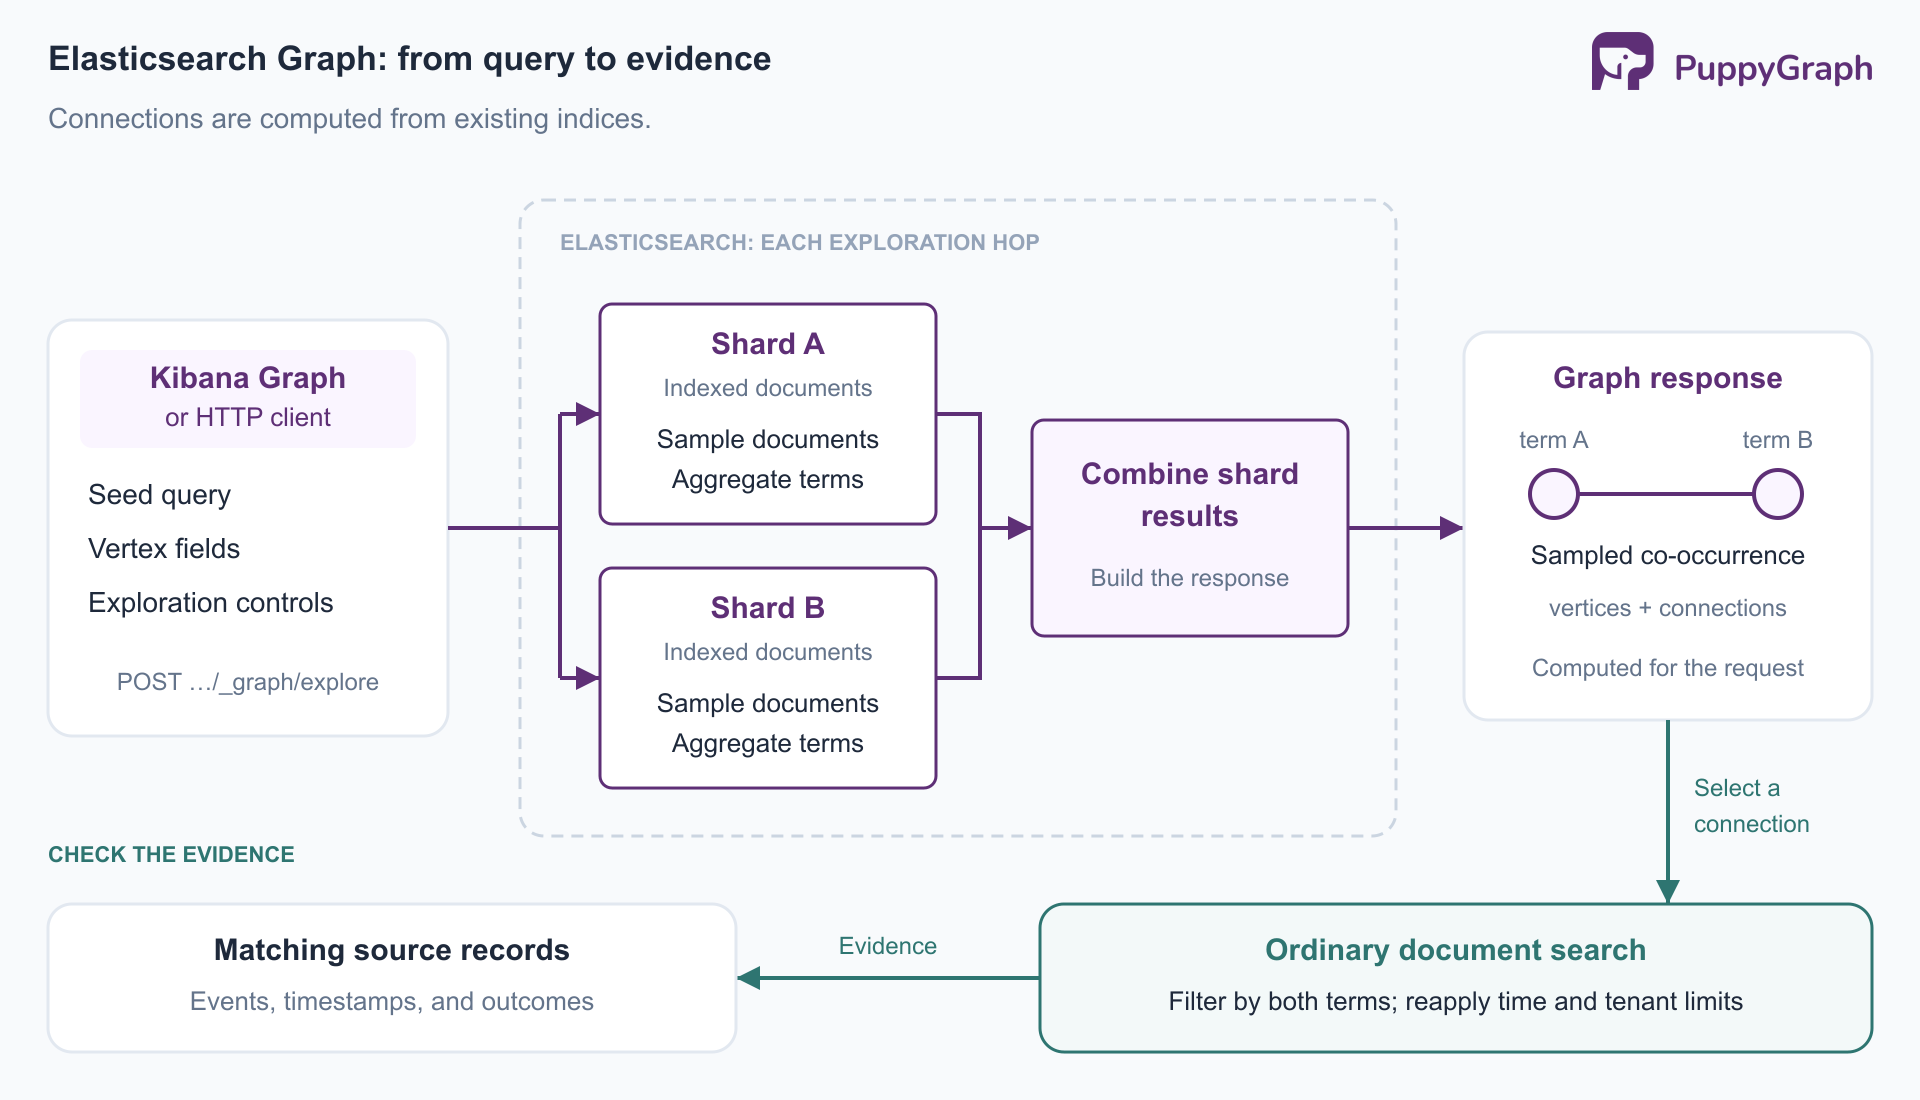
Figure: Elasticsearch Graph computes connections from sampled indexed documents. Treat each connection as a lead and inspect the source events before drawing a conclusion.
The Graph response format separates vertices from connections. Each connection's source and target are positions in the vertex array, not document identifiers. Its doc_count describes sampled documents supporting the pair, not a global event count. A vertex's depth records when exploration first encountered it; it does not express event chronology.
Clients should inspect timed_out and failures before treating the returned graph as a successful exploration. A rendered network alone is insufficient evidence that the request completed normally.
Saving the visualization introduces another storage boundary. Kibana can save both configuration and graph data. Elastic describes that data as a snapshot whose source-document permissions are not subsequently rechecked. Review the Graph save policy when sharing workspaces; configuration-only saves may better fit sensitive investigations.
How to perform graph exploration in Elasticsearch
Begin with a question narrow enough to inspect: which other users appear on devices used by usr-17? In Kibana, open Graph, select the relevant data view, and add device_id and user_id. Seed the search with the user identifier. Expand selected vertices to discover neighbors, or use the link action to reveal connections among vertices already displayed.
For the tiny fixture, adjust the advanced settings to admit sparse connections. For a larger event corpus, begin with the noise-filtering defaults and change one control at a time. Elastic's Graph troubleshooting guide explains why sampling, significance, and minimum document counts can hide individual events.
Treat an expansion as a new investigative choice. Following a device to another user broadens the question from one person's activity to shared infrastructure. A kiosk, test device, or help-desk workstation can legitimately connect many users. The graph needs this operational context before anyone assigns risk.
Time bounds also need deliberate handling. A seed query selecting January events does not automatically impose January on every later hop. Put the corresponding range filter into each guiding query that must stay inside that period. The same principle applies to tenant and outcome filters.
Repeated activity can dominate the sample. If one automated user generates most matching events, consider sample_diversity with a suitable single-valued field and a per-value cap. This changes the evidence being analyzed: balancing user representation may help find shared infrastructure, while suppressing repeated events would be inappropriate when volume itself is the signal. Record that choice alongside the seed query.
Record the selected fields, filters, and controls with the investigation. Then inspect underlying documents for any connection that affects a decision. Reproducibility depends on preserving the question and its evidence scope, not merely saving a graph's layout.
Elasticsearch Graph query examples
The earlier request explores devices and users. The next question is which applications appear in those other users' successful-login records. Add another connections object to explore app_id, and require successful events at each stage:
POST login-events-example/_graph/explore
{
  "query": {
    "bool": {
      "filter": [
        { "term": { "user_id": "usr-17" } },
        { "term": { "outcome": "success" } }
      ]
    }
  },
  "controls": { "use_significance": false },
  "vertices": [
    { "field": "device_id", "min_doc_count": 1,
      "shard_min_doc_count": 1 }
  ],
  "connections": {
    "query": { "term": { "outcome": "success" } },
    "vertices": [
      { "field": "user_id", "exclude": ["usr-17"],
        "min_doc_count": 1, "shard_min_doc_count": 1 }
    ],
    "connections": {
      "query": { "term": { "outcome": "success" } },
      "vertices": [
        { "field": "app_id", "min_doc_count": 1,
          "shard_min_doc_count": 1 }
      ]
    }
  }
}
The final hop asks about applications associated with the discovered users across their matching events. It does not require that those application events used the original shared device. This matters when interpreting a device-user-application chain: its individual links may come from different documents.
These requests use term queries because the inputs are exact identifiers. A free-text field would require different mapping and query choices. The bool.filter clauses require all listed conditions without contributing relevance scores, which fits this fixture's exact-match question.
Inspect the supporting events. To investigate the usr-28 and device-42 pair present in the sample inputs, issue an ordinary search with both values:
POST login-events-example/_search
{
  "size": 20,
  "_source": ["@timestamp", "user_id", "device_id", "app_id", "outcome"],
  "query": {
    "bool": {
      "filter": [
        { "term": { "user_id": "usr-28" } },
        { "term": { "device_id": "device-42" } },
        { "term": { "outcome": "success" } }
      ]
    }
  },
  "sort": [{ "@timestamp": "asc" }]
}
This is a document query with explicit conditions, rather than a connection score. In a larger corpus, the response is only the requested page; paginate when the investigation needs every matching event. Reapply the same time and tenant constraints used during exploration.
Compare what the records establish with the proposed interpretation. Elastic records successful authentication and access decisions separately. A successful-authentication record alone does not establish resource access, device ownership, the person physically using the device, or the purpose of the attempt. Those questions require additional evidence. Keeping this distinction visible makes the graph useful during investigation without giving the visualization more authority than its source records.
Tune a larger exploration. Restore use_significance: true when unusual associations are the goal. Adjust sample_size to change the per-shard document sample, vertex size to change the number of returned terms, and min_doc_count to change the evidence threshold. Increasing the vertex limit does not increase the document sample. Test each change against known events so a cleaner-looking visualization does not quietly remove the evidence you need.
Benefits of Elasticsearch Graph
Elasticsearch Graph is useful when the immediate task is discovering associations in documents that are already indexed. The analyst can start with a known identifier, follow an unexpected connection, and return to the source records without first designing a complete domain graph.
Security investigation. Shared devices, usernames, and application identifiers can suggest where to look next. The authentication example is a starting point for an analyst's review queue. Device ownership, login outcomes, and timestamps determine whether a connection deserves escalation; co-occurrence alone does not.
Recommendation discovery. Shopping-session documents can associate products that people view or purchase together. Those associations can supply recommendation candidates. Product availability, eligibility, and recommendation quality still need separate evaluation before presenting suggestions to customers.
Document exploration. Tags, named entities, or curated topics can expose clusters in a publication or support corpus. Consistent entity identifiers matter: merging two organizations with similar names can manufacture a bridge between otherwise unrelated document groups.
Across these uses, the benefit is a way to identify questions and evidence worth examining. It is strongest when relevance and summarization are useful parts of the answer.
An authentication investigation may then need a more explicit question: which identities connect to usr-17 through successive shared-device logins, and which events and applications support each path? Modeling the events themselves preserves their timestamps and outcomes along those paths. Shared infrastructure still needs interpretation, but the query can specify the relationships it is following.
PuppyGraph is the first and only zero-ETL graph query engine that queries existing data as a graph without loading it into a separate graph database. Its distributed engine queries tables in place in SQL databases, data warehouses, and data lakes or lakehouses, including direct reads of Iceberg and Delta Lake. Connect the sources, define a graph schema mapping tables to nodes and edges, and query with openCypher or Gremlin while the same tables remain available to SQL.
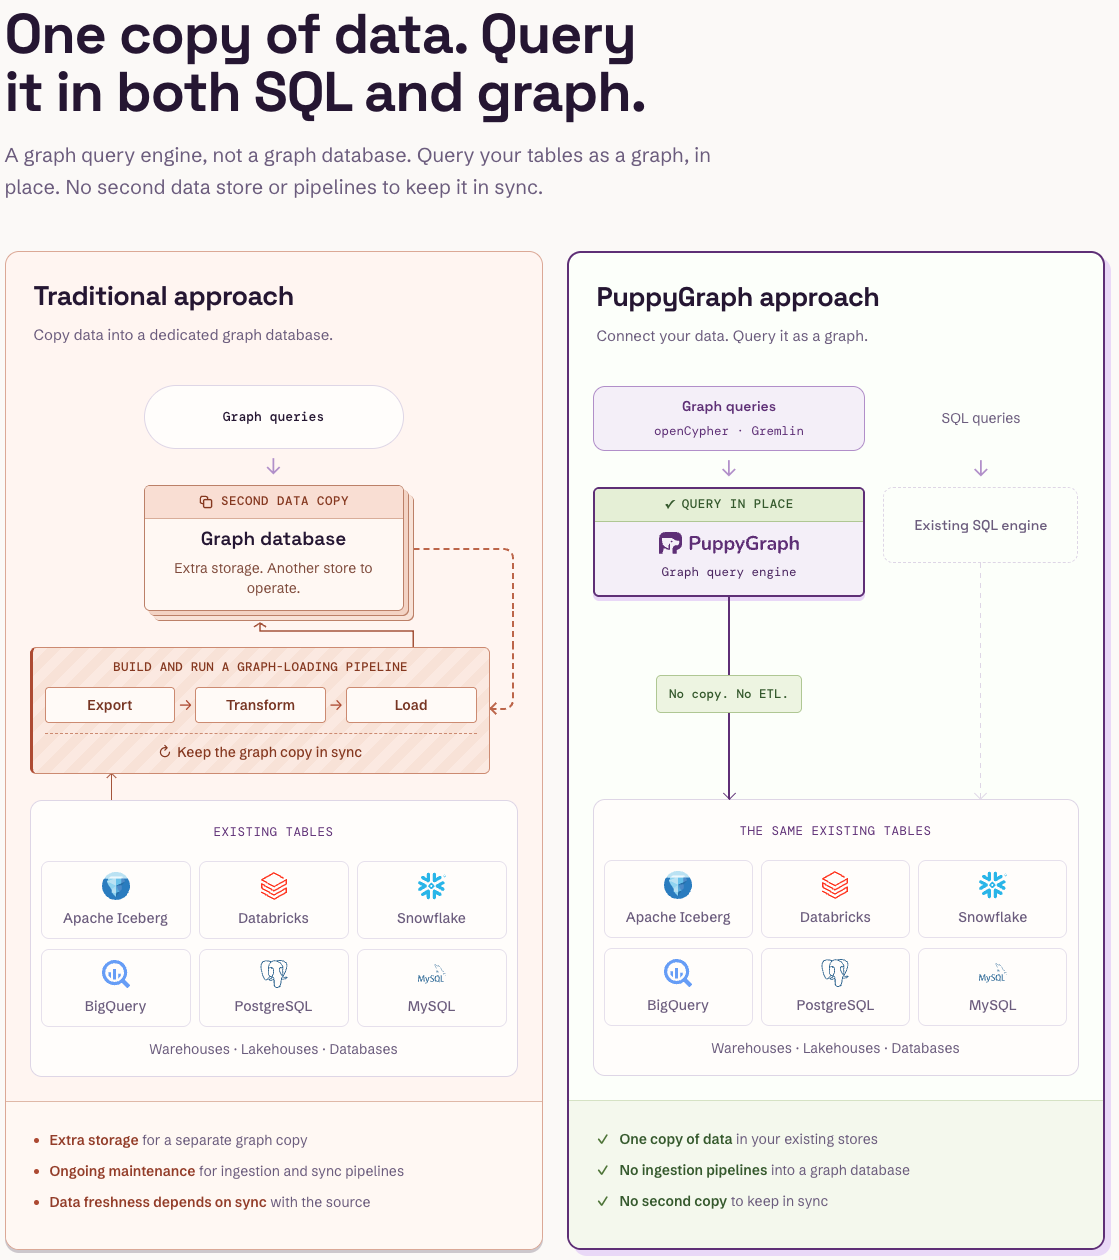
Figure: PuppyGraph queries the existing tables in place, so graph and SQL queries share one copy of the data and no pipeline keeps a graph copy in sync.
For this article's source system, its Elasticsearch connector presents indices as tables, documents as rows, and mapped fields as columns. That supplies data for an explicit graph model; the built-in AI assistant can help propose the model from connected data. Elasticsearch remains available for document search while graph queries follow the relationships defined in that model.
Figure: Companies that use PuppyGraph.
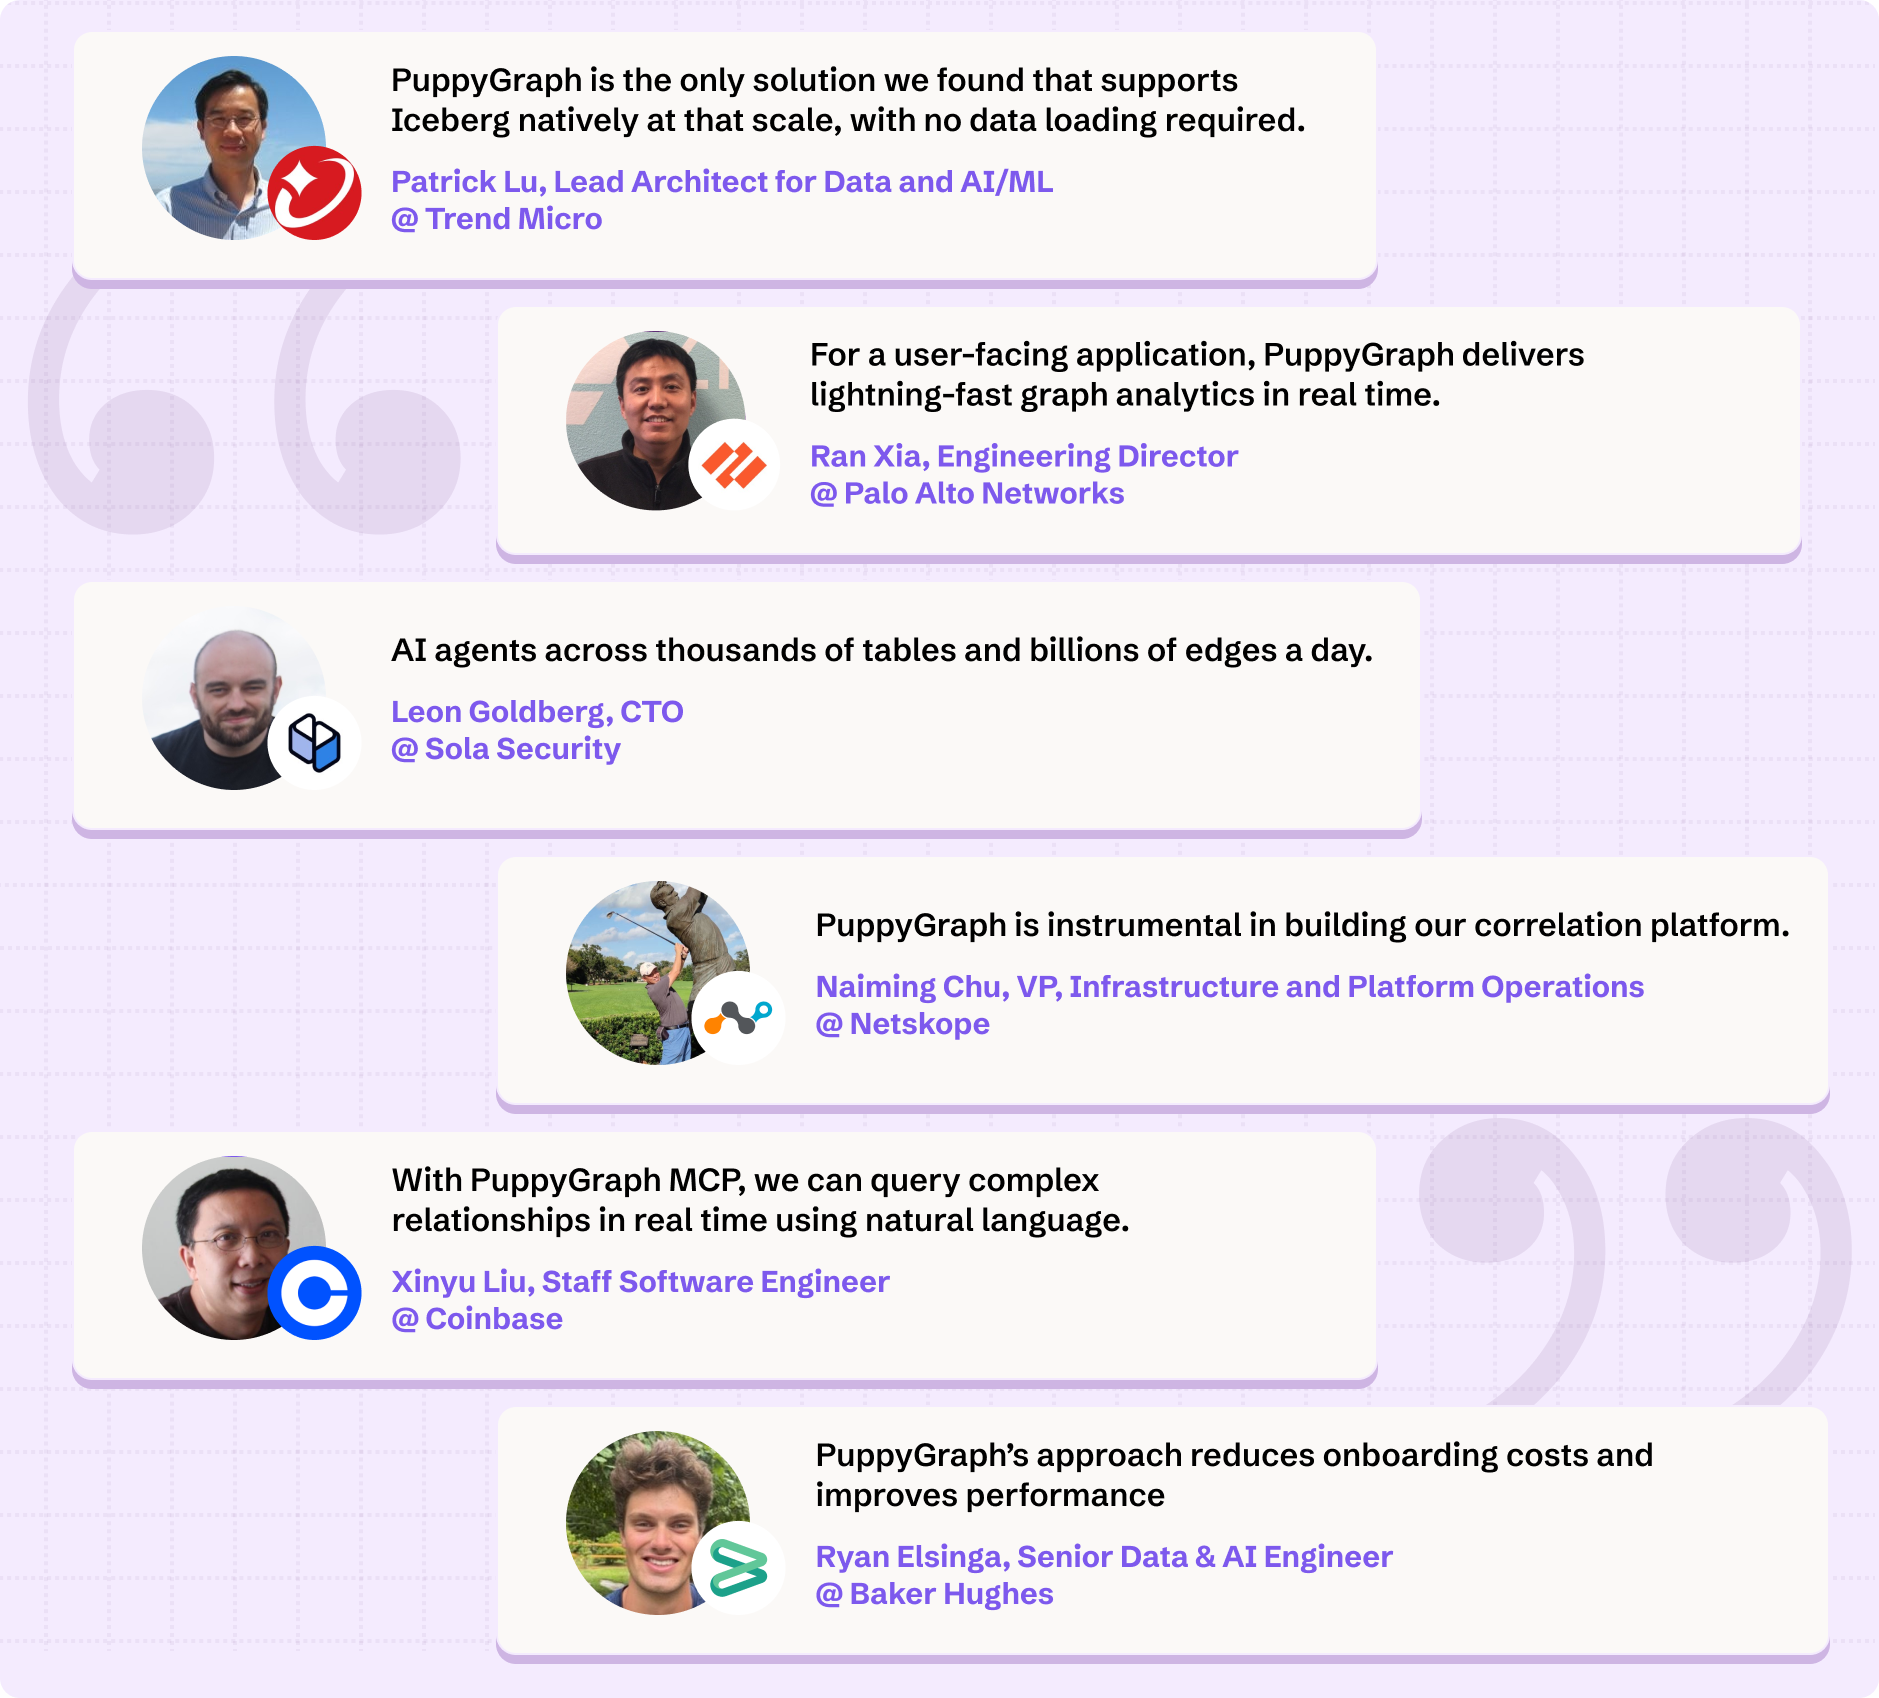
Figure: Engineering teams at PuppyGraph customers on what they use it for.
Frequently asked questions
Is Elasticsearch Graph a graph database? No. It exposes relationships between indexed terms through the Graph explore API and Kibana. Choose an explicit graph model when the question depends on typed relationships and constrained paths.
Why does a known connection not appear? Check the query scope, field mapping, sampling, and term thresholds. Disabling significance or lowering thresholds can reveal sparse associations, but neither change guarantees exhaustive results.
Can Graph explore multiple indices? Yes, but each hop targets the same index set. It does not automatically translate a value from one index's field into a differently named field in another index. That requires separate requests or data preparation, as Elastic's multi-index limitations explain.
Is Graph available in Elastic Cloud Serverless? Elastic currently marks Graph as unavailable in Serverless. Check both deployment support and subscription entitlement before planning around it.
Try the forever-free PuppyGraph Developer Edition and book a demo with the team to see how openCypher and Gremlin queries follow explicit relationships across warehouse and lakehouse tables, with no graph-specific ETL, when an investigation needs the paths behind an association.