

Business Intelligence and Analytics: Complete Guide
.png)
Business intelligence and analytics turn operational data into evidence for decisions. The difficult part is not producing another dashboard. It is building a reliable path from source systems to shared definitions, analysis, and action, while preserving enough context for people to trust what they see.
That path now serves a wider range of consumers than conventional reporting did. Executives still read scorecards, analysts still investigate anomalies, and data scientists still build forecasts. They are joined by business users exploring governed data and AI assistants translating natural-language questions into queries. This guide explains the concepts, architecture, analytical methods, benefits, use cases, and design choices behind that broader system.
What is business intelligence and analytics?
Business intelligence (BI) is the set of processes and technologies used to collect, model, analyze, and present business data. Its familiar outputs are dashboards, reports, scorecards, alerts, and ad hoc queries. A sales dashboard that tracks bookings against quota and lets a manager drill from region to account is a BI application.
Business analytics applies statistical, computational, and quantitative methods to business questions. It ranges from calculating a conversion rate to estimating demand and recommending an inventory policy. The result may appear in a BI dashboard, feed an operational workflow, or remain in an analyst's notebook while a hypothesis is tested.
There is no universal boundary between the terms. Some practitioners use business intelligence for descriptive reporting and business analytics for diagnostic, predictive, and prescriptive work. Others use BI as the umbrella that includes all four. IBM's business intelligence overview, for example, describes business analytics as the forward-looking subset of a broader BI discipline. The labels matter less than the capabilities behind them: consistent metrics, accessible evidence, deeper analysis, and a mechanism for acting on the result.
A working BI and analytics practice therefore combines people, process, and technology. Data engineers make source data usable. Analytics engineers and BI developers define models and metrics. Analysts interpret patterns in business context. Domain owners decide what action follows. Governance teams set access, quality, and accountability rules. Tools support the chain, but they do not replace those responsibilities.
Business intelligence vs. business analytics
The most useful distinction is one of emphasis. BI keeps an organization aware of current and historical performance. Business analytics investigates that performance and evaluates what could happen next. Both work on the same underlying data, and most mature platforms support at least part of both.
Consider declining customer retention. BI establishes the pattern: renewal rate fell in the enterprise segment, with the largest change in two regions. Diagnostic analysis tests explanations such as onboarding delays or support volume. Predictive analysis estimates which accounts are most likely to churn. Prescriptive analysis compares interventions under staffing and budget constraints. The same decision moves back and forth across the boundary.
This overlap is why splitting the organization into a reporting team and an analytics team with no shared model usually creates friction. Analysts spend time reconciling their datasets with dashboards, while business users receive several technically valid versions of the same metric. Shared data definitions are more important than a perfect taxonomy.
How business intelligence and analytics work together
BI and analytics form a feedback loop rather than a one-way reporting pipeline. The process starts with a business decision, not with an available table. A product team may ask why activation fell, an operations team may need to reduce late deliveries, or finance may need a more reliable cash forecast. The question determines the necessary data, grain, latency, and analytical method.
Data then moves or is queried from operational systems, applications, event streams, and third-party sources. Pipelines validate and transform it into reusable models in a data warehouse, lakehouse, or another analytical store. A semantic layer maps physical columns to business terms, calculations, and permitted relationships. This is where definitions such as active customer, gross margin, and on-time delivery become shared logic rather than report-specific formulas.
BI surfaces the modeled data as recurring metrics and alerts. When a metric departs from its expected range, analytics provides the next level of inquiry. An analyst segments the change, tests likely drivers, builds a forecast, or evaluates scenarios. The finding returns to the operating process as a pricing change, outreach list, staffing plan, or automated decision rule. Subsequent BI reporting measures whether the action worked.
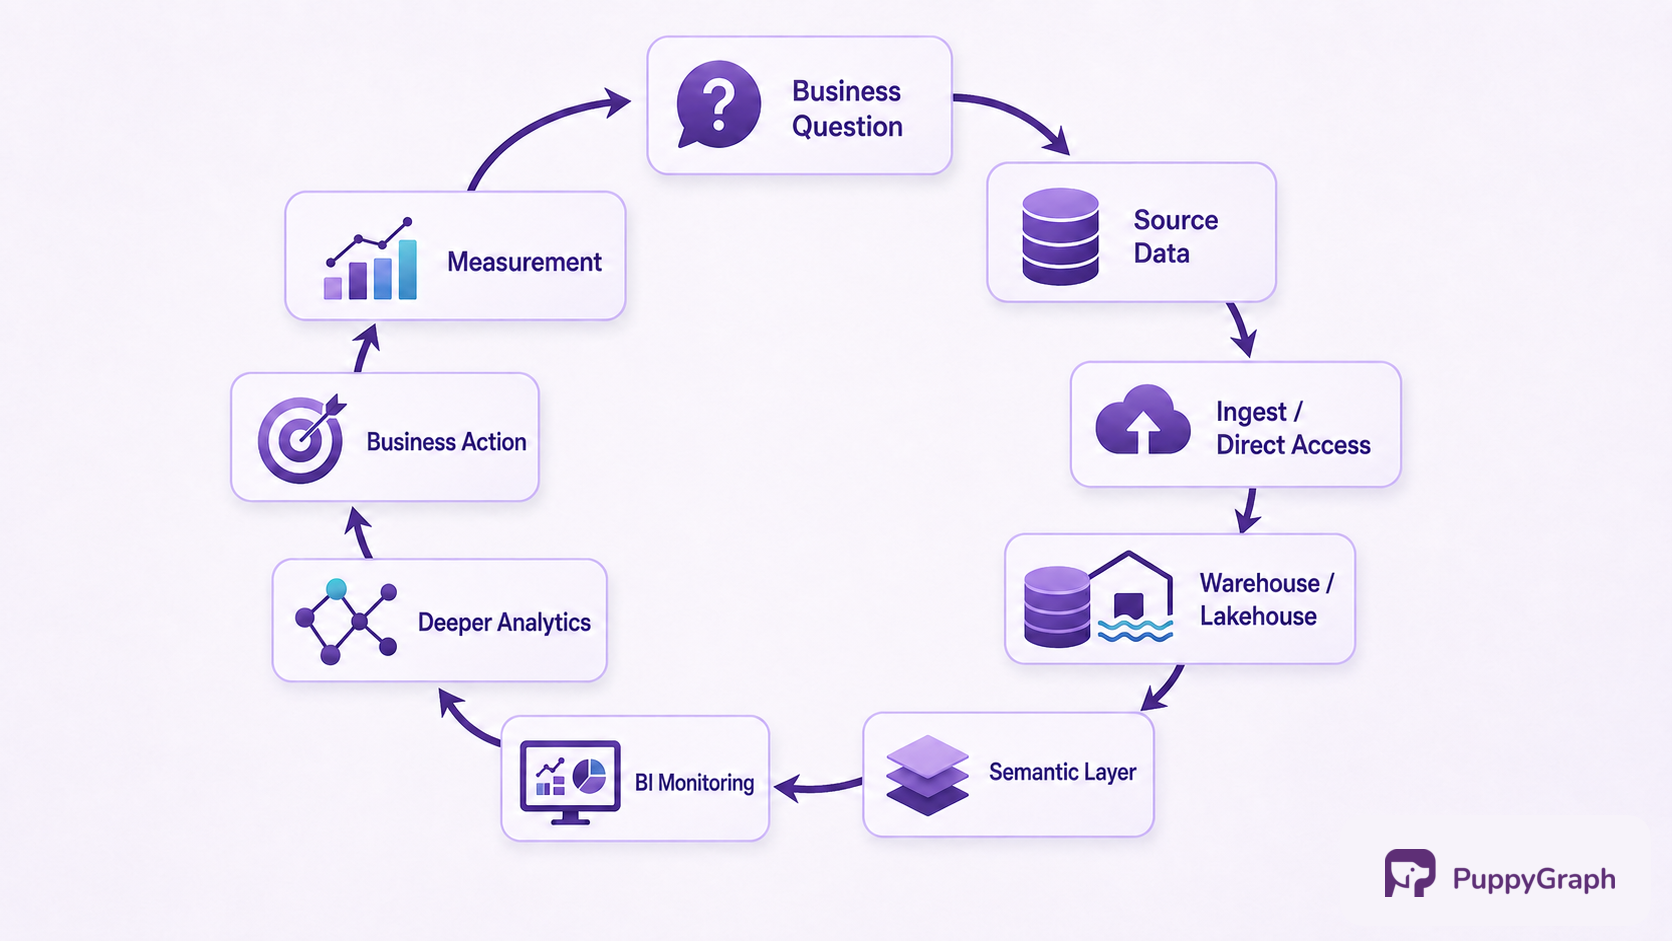
The loop depends on traceability. A decision-maker should be able to move from a KPI to its definition, underlying dimensions, refresh time, and owner. An analyst should be able to reproduce the dataset used for a model. When an automated consumer generates a query, the organization needs to know which governed definitions and access rules constrained it. Without that lineage, BI and analytics may produce answers quickly but cannot establish why two answers differ.
Types of business analytics
A common framework divides business analytics into four types. The questions form a progression, but the methods are complementary rather than maturity levels every problem must climb.
Descriptive analytics: What happened? Descriptive work summarizes observed data through totals, rates, distributions, trends, and comparisons. Monthly recurring revenue, order volume by region, and average resolution time are descriptive measures. The work sounds simple, but it depends on choosing the correct population, time grain, and metric definition. Most dashboards and scheduled reports operate here.
Diagnostic analytics: Why did it happen? Diagnostic analysis investigates drivers and relationships. Common methods include drill-down, cohort analysis, contribution analysis, correlation, controlled experiments, and root-cause investigation. A retailer might separate a revenue decline into traffic, conversion, price, and product-mix effects. The analysis can narrow plausible explanations, but observational data alone does not establish causality.
Predictive analytics: What is likely to happen? Predictive methods estimate future values or the probability of an event. Forecasting, classification, regression, survival analysis, and machine-learning models fall into this category. Examples include demand forecasts, churn scores, and expected payment delays. Predictions need monitored error rates and explicit time horizons. A model can rank risk well without predicting an exact outcome for any one customer.
Prescriptive analytics: What should we do? Prescriptive analysis recommends an action under objectives and constraints. Optimization, simulation, decision rules, and reinforcement learning can support this work. A supply planner may use predicted demand as an input, then choose order quantities subject to lead times, storage limits, and service targets. The recommendation is only as useful as those constraints are realistic.
This four-part taxonomy is also used in IBM's overview of prescriptive analytics. In practice, one workflow may use all four: describe late shipments, diagnose the responsible lanes, predict future delays, and prescribe inventory or carrier changes. The type should match the decision, not the sophistication of the available tool.
Key components of business intelligence and analytics
A BI platform combines data integration, analytical storage, modeling, governance, analysis, and delivery. The first three components make business data usable.
Source systems and integration. Customer relationship management, enterprise resource planning, billing, support, web events, sensors, and external datasets each record a partial view of the business. Batch ETL or ELT, change data capture, streaming pipelines, and direct-query connections make that data available for analysis. The choice controls freshness, cost, and how many copies must be governed.
Analytical storage and compute. Warehouses and lakehouses separate analytical workloads from transaction processing and retain history at queryable grain. Columnar formats, partitioning, distributed execution, and workload management make large scans and aggregations practical. Some BI products import data into an in-memory model; others issue live queries to the source; hybrid approaches use both. Microsoft's Power BI documentation illustrates this trade-off with Import, DirectQuery, and Composite semantic models.
Transformation and data modeling. Raw events rarely match the questions people ask. Transformation standardizes types, resolves keys, handles late-arriving records, and organizes data into reusable facts and dimensions. Tests should cover uniqueness, referential integrity, accepted values, and business invariants. A well-designed warehouse makes the intended grain and joins explicit before a dashboard obscures them.
Governance, analytical methods, and consumption determine how people interpret and act on that data.
Semantic layer and governance. A semantic layer defines metrics, dimensions, hierarchies, joins, and business vocabulary independently of any one chart. Governance adds ownership, documentation, row- and column-level access, certification, retention, and auditability. This combination supports managed self-service: a central team commonly maintains reusable models while domain experts create reports from them. Microsoft's managed self-service guidance describes this separation of model and report responsibilities.
Analysis and decision methods. SQL, notebooks, statistical packages, machine-learning platforms, optimization solvers, and graph tools support different question shapes. Aggregation handles totals and trends. Statistical and machine-learning methods handle uncertainty and prediction. Graph analysis handles paths, communities, dependencies, and other patterns in relationships. The right engine follows from the unit of analysis.
Consumption and action. Dashboards, mobile reports, embedded analytics, APIs, alerts, and natural-language interfaces deliver results. A complete design also specifies the decision that follows: who responds, through which workflow, within what time, and how the outcome is measured. An insight with no owner or operating path is an unused output.
These components can come from one suite or several specialized tools. The practical selection criteria are data location, query latency, semantic governance, deployment model, interoperability, user skill, and the recurring questions the organization needs to answer. Our guide to business analytics tools examines those trade-offs at the product level.
Benefits of business intelligence and analytics
The benefits appear when the system changes a decision or removes repeated analytical work. Dashboard adoption by itself is not an outcome.
Consistent performance visibility. Shared metrics give teams a common view of revenue, cost, service, risk, and operational health. Leaders can compare units on the same basis, and operators can see exceptions early enough to respond. Metric ownership and lineage make disagreements resolvable instead of political.
Faster investigation. Governed self-service lets a domain expert filter, drill, and compare without waiting for a new report. Analysts can start from reusable models instead of cleaning the same source extracts for every question. The result is shorter time from anomaly to a testable explanation.
Better planning under uncertainty. Forecasts and scenarios turn assumptions into explicit inputs. Finance can compare cash positions under several collection rates; operations can model capacity against demand ranges; commercial teams can estimate the effect of price or mix. The goal is a revisable decision that accounts for uncertainty as evidence changes.
Operational efficiency. Analytics can identify process bottlenecks, repeated defects, unnecessary inventory, and service queues. Prescriptive methods can allocate scarce staff, budget, or capacity. When recommendations are integrated into operating systems, the analytical result reaches the point where work is performed.
Governed access to data. A shared semantic layer, catalog, and access model reduce the need for uncontrolled spreadsheet exports and report-specific datasets. This does not eliminate risk, but it gives the organization defined owners, reusable controls, and an auditable path from source to decision.
Each benefit has a corresponding operating requirement. Faster access without shared definitions multiplies conflicting answers. Better forecasts without monitoring decay quietly. Automated recommendations without review paths can scale a bad assumption. BI and analytics create value through disciplined use, not merely through deployment.
Business intelligence and analytics use cases
The same architecture supports use cases across functions. What changes is the decision, analytical grain, and acceptable latency.
Financial planning and performance. Finance combines ledger, billing, sales, and workforce data to monitor budget variance, forecast cash and revenue, analyze margin, and test scenarios. Reconciliation and controlled definitions matter more than visual novelty because the same number may appear in management reporting, board materials, and operating plans.
Customer and commercial analytics. Marketing and sales teams measure acquisition, funnel conversion, retention, account health, price realization, and campaign performance. Cohort analysis separates customer behavior by start period, while propensity and churn models prioritize outreach. Identity resolution is load-bearing because a person, account, device, and transaction may be recorded in several systems.
Supply chain and operations. Teams monitor inventory, throughput, quality, lead times, fulfillment, and supplier performance. Descriptive metrics expose a service problem; diagnostic analysis locates the facility or lane contributing to it; forecasts estimate demand; optimization recommends replenishment or allocation under constraints.
People and workforce planning. Human resources and business leaders analyze hiring funnels, staffing, skills, retention, compensation, and organizational capacity. Small cohorts and sensitive attributes require careful access controls, aggregation thresholds, and review for inappropriate proxies. The analytical question should serve a defined workforce decision rather than invite unbounded monitoring.
Risk, fraud, and relationship analysis. Many risk signals live in connections rather than individual records: accounts sharing devices, suppliers depending on the same sub-tier manufacturer, or identities reaching a resource through nested roles. Relationship analytics models these entities and connections directly, then uses pathfinding, pattern matching, or graph algorithms to examine their structure.
For relationship-heavy risk and fraud work, PuppyGraph maps existing tables in SQL databases, warehouses, and lakehouses, including direct reads of open table formats such as Apache Iceberg and Delta Lake, to node and edge types. Investigators can use openCypher and Gremlin to follow multi-hop paths without requiring graph-specific ETL or a separate graph store, while BI continues to aggregate the source tables.
Across these use cases, the business process supplies the success measure. Forecast accuracy matters only alongside inventory or service outcomes. A churn score matters only if a team can intervene. A fraud pattern matters only if investigators can review it and the cost of false positives is acceptable.
Traditional BI vs. modern BI
A classic enterprise BI pattern centralizes semantic models and report publishing in an IT or BI team, often over warehouse data refreshed in batches. It remains useful for standardized, governed reporting. Traditional BI also included OLAP, ad hoc analysis, and other delivery models, so centralized scheduled reporting is one pattern rather than a complete definition.
Modern BI platforms can combine cloud-native storage and compute with managed self-service, reusable semantic models, interactive exploration, embedded analytics, near-real-time access paths, and APIs. In a common managed self-service pattern, business-unit report creators build reports from certified shared semantic models, while a central IT, BI, or center-of-excellence team maintains the core models and governance controls. The distinction is architectural and organizational, not simply old software versus new software.
AI is changing the consumption and authoring layers fastest. Natural-language interfaces can translate a question into a query, summarize results, draft a visualization, or suggest a follow-up. They lower the skill floor for exploration, but they do not repair ambiguous metrics or poor source data. Google's Conversational Analytics documentation says the feature uses Looker's semantic model as its source of truth and recommends validating all output because it can seem plausible while being factually incorrect. That combination captures the design requirement: give the model governed context, expose how an answer was calculated, and keep human review proportional to the decision's consequence.
AI also increases the importance of machine-readable semantics. A human analyst can ask a colleague what active account means or notice that two tables should not be joined. An automated consumer needs those definitions and relationships encoded in the query path. A semantic model or ontology provides that vocabulary; validation, access controls, lineage, and structured error feedback make it usable as a contract rather than documentation the consumer may ignore.
Modern BI therefore shifts the bottleneck. Creating a chart or query becomes easier, while maintaining trusted definitions, context, and accountability becomes more important. The durable architecture keeps flexibility at the interface and discipline in the data and semantic layers beneath it.
Conclusion
Business intelligence and analytics are parts of one decision system. BI establishes a consistent view of performance. Analytics explains variation, estimates likely outcomes, and evaluates actions. Integration, analytical storage, modeling, a governed semantic layer, appropriate analytical methods, and an operating path turn those capabilities into a repeatable loop.
Modern platforms widen access through self-service, live and hybrid data paths, embedded delivery, and AI-assisted querying. Those interfaces make reliable foundations more valuable, not less. The strongest programs begin with a consequential business question, define the data and semantics needed to answer it, assign ownership for the resulting decision, and measure what happened next.
Try the forever-free PuppyGraph Developer Edition and book a demo with the team to see how openCypher and Gremlin queries traverse warehouse and lakehouse tables, with no graph-specific ETL, alongside the BI workflows that report on the same governed data.

Hao Wu is a Software Engineer with a strong foundation in computer science and algorithms. He earned his Bachelor’s degree in Computer Science from Fudan University and a Master’s degree from George Washington University, where he focused on graph databases.


