

Database Optimization: 7 Techniques To Use
Database performance depends on the production workload: its read and write mix, data distribution, concurrency, latency targets, and cost constraints. A change that makes one lookup faster while slowing every write may be a poor trade for the system as a whole. Effective optimization evaluates work and trade-offs at workload scope.
This guide explains how database optimization works, why performance degrades, and which techniques apply across relational, NoSQL, and cloud databases. It also covers the growing role of automated tuning and the failure modes that turn well-intended changes into regressions.
What is database optimization?
Database optimization is the process of measuring a database workload, locating its limiting resource, and changing queries, data structures, configuration, or architecture to improve a defined outcome. That outcome might be lower tail latency, higher throughput, steadier performance under concurrency, less infrastructure spend, or a shorter recovery window after a traffic spike.
Optimization operates at several layers. Query tuning changes the work requested from the engine. Index and schema design change how the engine can find and organize data. Configuration controls resources such as memory, worker processes, and connection limits. Application changes reduce round trips, duplicate work, and demand on the database. Infrastructure changes affect available CPU, memory, I/O, and network capacity.
These layers interact. A slow endpoint may appear to need a larger database instance, but its actual problem may be an unselective query, a missing composite index, or an application loop that sends hundreds of small requests. Conversely, a well-indexed query can still stall behind a lock or wait on saturated storage. Database performance is therefore a systems property, not a score assigned to SQL text.
Successful optimization starts with a measurable target. A service-level objective such as "99% of checkout reads complete within 150 ms at 800 requests per second" is actionable. "Make the database faster" is not. The target establishes which workload matters and prevents a local improvement from being mistaken for a system-wide one.
How database optimization works
When a database receives a query, it parses and validates the statement, builds candidate execution plans, estimates their costs, chooses a plan, and executes operators against storage and memory. A relational plan may combine index or table scans, joins, sorts, and aggregations. A document database produces a comparable tree of stages, such as collection scans, index scans, fetches, and in-memory sorts. PostgreSQL's EXPLAIN documentation and MongoDB's explain output make this plan structure visible.
The optimizer's decision depends on estimates. It uses table size, value distribution, index metadata, available memory, and cost parameters to predict which plan should require the least work. Execution then meets real data. If the estimate says a filter will return 100 rows and it returns 10 million, the chosen join order or access path may be inappropriate. Comparing estimated and actual row counts is one of the quickest ways to detect this class of problem.
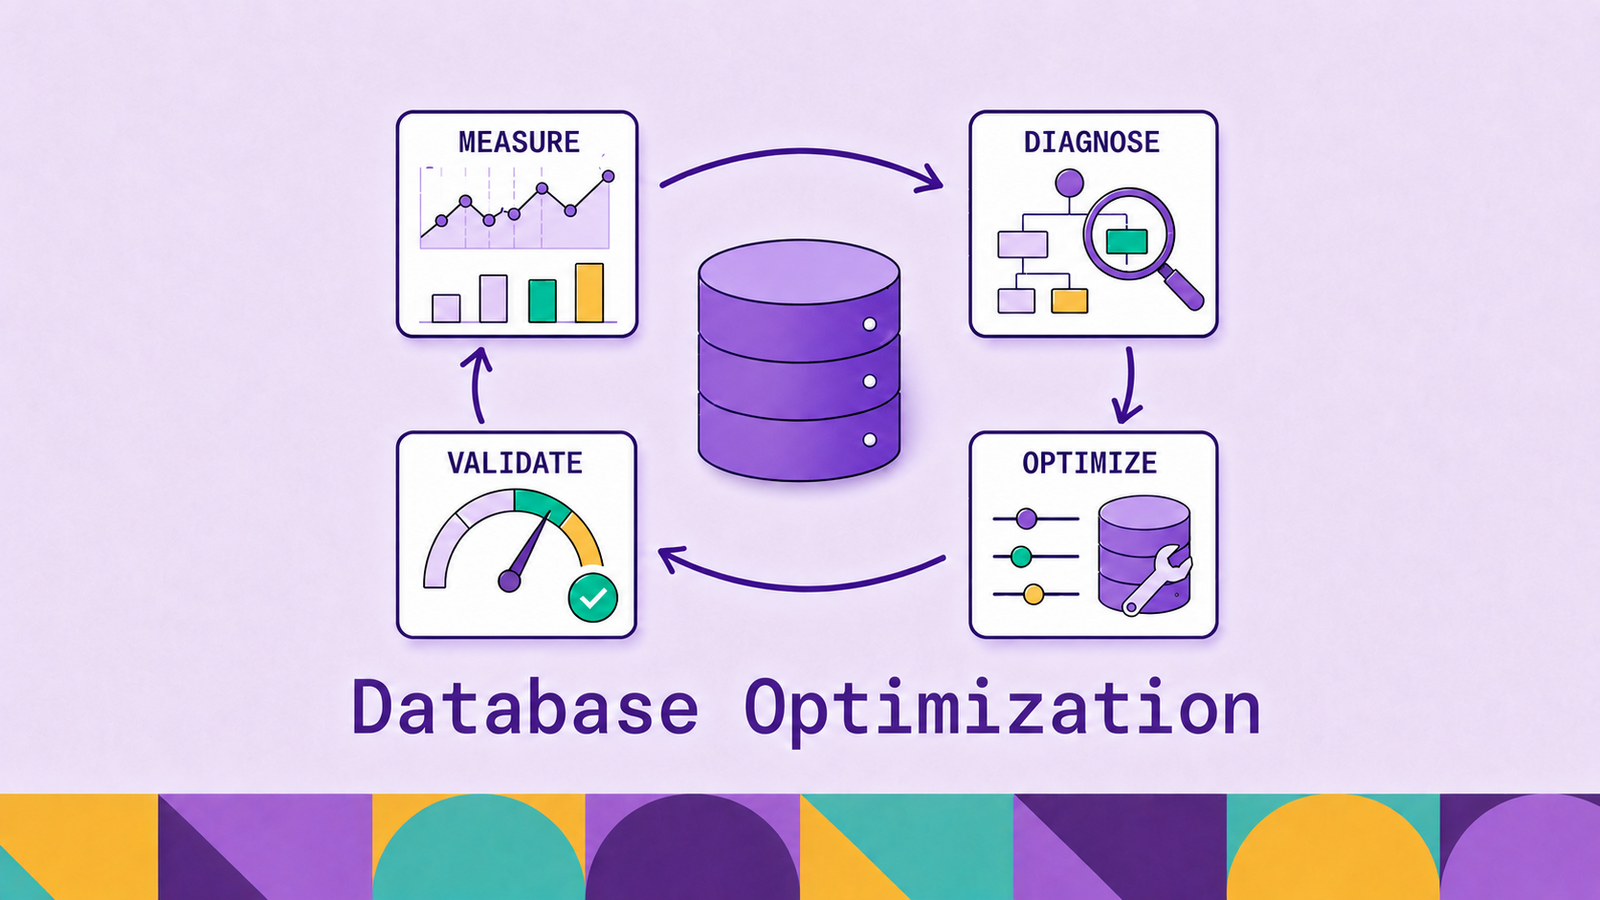
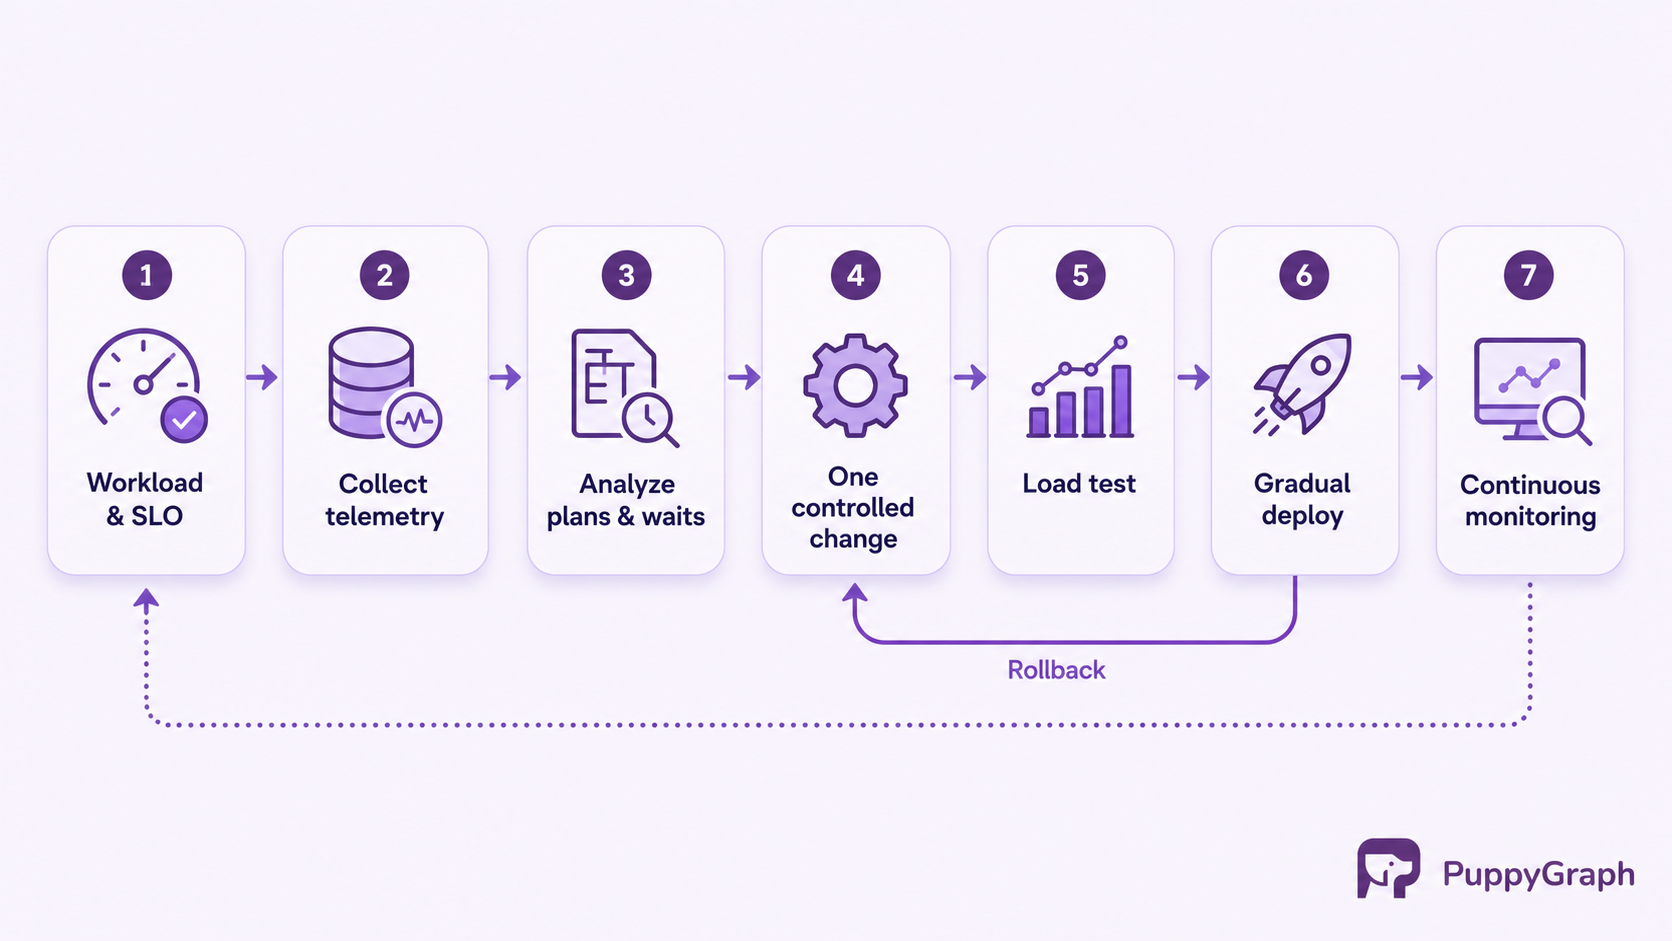
Optimization is a feedback loop:
- Define a latency, throughput, resource, or cost objective.
- Capture a representative workload and a baseline.
- Attribute time to query execution, locks, I/O, CPU, network, or application waits.
- Change one relevant variable.
- Test under realistic data volume and concurrency.
- Deploy gradually, observe the result, and retain a rollback path.
The loop matters because workloads change. Data grows, value distributions shift, releases introduce new query shapes, and concurrency alters lock and cache behavior. An index that pays for itself today may be unused after an endpoint changes. Optimization is continuous workload management rather than a one-time cleanup.
Causes of poor database performance
Most incidents involve more than one symptom, but common causes fall into a small set of categories.
Access paths and query shape. A missing or badly ordered index can force the engine to inspect far more rows than the result requires. Functions or type conversions applied to indexed columns can also prevent a useful index condition. Indexes themselves are not free: every additional index consumes storage and adds work to inserts, updates, and deletes. Returning unused columns, loading unbounded result sets, repeating the same lookup, and issuing one child query per parent also increase database and network work. Large sorts, wide aggregations, and nonselective joins can spill to disk when they exceed memory.
Statistics and data-model fit. Cost-based optimizers choose plans from estimates. After bulk loads, large deletes, or changes in value distribution, stale statistics can produce serious cardinality errors. Correlated columns create another problem because single-column statistics may treat related predicates as independent. PostgreSQL, for example, supports extended statistics for selected column groups. The data model can compound these costs: excessive normalization may require repeated joins for a read-heavy path, while excessive denormalization can amplify writes and make consistency expensive. In a distributed key-value or document store, a poor partition key can concentrate traffic on a small part of the cluster.
Contention and resource saturation. Long transactions retain locks and old row versions. Hot rows, inconsistent update order, and broad isolation requirements can make otherwise fast statements wait. A CPU graph alone will not expose this problem because a blocked session may consume little CPU. CPU pressure, memory exhaustion, storage latency, exhausted IOPS, constrained network bandwidth, and connection storms can add scheduling overhead and memory use even when many connections are idle.
Background work and operational drift. Backups, index builds, compaction, vacuuming, replication lag, and analytical scans compete with foreground traffic. Configuration copied from a different workload may also age poorly as the database grows.
The right diagnosis identifies both the waiting resource and the workload responsible for it. High disk latency is evidence of a bottleneck, but it does not say whether the cause is a necessary scan, a missing index, cache churn, or a maintenance job.
Key database optimization techniques
The following seven techniques form a practical sequence. Teams do not need to apply every technique to every incident, but they should measure before and after each change.
1. Establish a baseline and isolate the bottleneck
Record throughput, median and tail latency, error rate, CPU, memory, I/O latency, database connections, lock waits, and cache behavior. Break the workload down by normalized query shape rather than treating each literal query as unique. A few high-frequency statements often matter more than the single slowest statement.
Correlate database telemetry with application traces. This separates time spent acquiring a connection, crossing the network, waiting on a lock, and executing the statement. Capture a normal period and a degraded period so the comparison reflects the change that users experienced.
2. Tune query shape and data access
Start by reducing work. Select only required columns, filter early, bound result sets, and avoid repeatedly fetching the same rows. Replace application-side N+1 query loops with a set-oriented query, batching, or intentional prefetch. Check whether pagination performs an ever-larger offset scan; keyset pagination can continue from the last ordered key instead.
Read the execution plan with runtime statistics where the engine supports them. Focus on actual versus estimated rows, repeated loops, scan type, sort or hash spills, and the node where most time accumulates. Runtime analysis may execute the statement, so use care with write queries and production systems.
3. Design indexes around real query patterns
An index should support a recurring predicate, join, ordering, or uniqueness requirement. For a composite B-tree index, column order should reflect how the workload constrains and orders data. An index on (tenant_id, created_at) naturally supports a tenant-scoped time range; reversing those columns serves a different access pattern. PostgreSQL's multicolumn-index guidance stresses that effectiveness depends on the index type and how leading columns are constrained.
Use covering or included columns when avoiding table lookups justifies the extra index size. Consider partial indexes for a stable, frequently queried subset. Then account for write amplification and maintenance cost. MySQL's index optimization guide makes the trade-off explicit: unnecessary indexes consume space and add work to data changes.
4. Align the schema with the workload
Normalize transactional data enough to prevent conflicting copies and preserve clear update semantics. Denormalize selectively when a measured read path cannot afford repeated joins and the team can define how duplicate values remain consistent. Use appropriate data types, constraints, and keys. An oversized string used where a compact key would suffice increases index and cache footprint.
Schema design also includes precomputed structures. A materialized view can store an expensive, repeatedly requested aggregate, provided its refresh contract matches the required freshness. Summary tables, generated columns, and search-specific projections solve similar problems at different maintenance costs.
5. Use memory, caching, and connections deliberately
Keep the active working set and frequently used index pages in memory where practical, but do not maximize every memory setting independently. Concurrent sorts, hashes, buffers, and connections can multiply a per-operation allowance into system-wide memory pressure.
Cache data that is expensive to compute, requested often, and stable enough for a clear freshness policy. Define time-to-live, invalidation, stampede protection, and behavior during a cache outage before calling the design complete. Redis's client-side caching guidance recommends favoring frequently requested keys that do not change continuously and documents the invalidation races a client must handle.
Use a bounded connection pool. The pool should absorb normal application concurrency without turning a traffic burst into thousands of database sessions. Measure pool wait time alongside database execution time so an undersized pool is not confused with a slow query.
6. Partition and distribute with a specific goal
Partitioning can let the engine prune old or irrelevant data, simplify retention operations, and isolate maintenance. Choose a partition key that appears in common filters and produces manageable partitions. Partitioning does not automatically accelerate a query that still touches every partition, and too many small partitions add planning and metadata overhead.
Distribution adds network and coordination costs. Shard only after defining how requests route, how cross-shard operations behave, and how rebalancing works. A good distribution key spreads both data and traffic. Replicas can scale eligible reads and improve availability, but applications must decide whether replication lag is acceptable for each read path.
7. Maintain statistics, storage, and continuous monitoring
Refresh optimizer statistics after major data changes and verify that automatic maintenance keeps pace with busy tables. Rebuild or reorganize indexes only when measured fragmentation or bloat warrants the cost. Schedule compaction, vacuuming, backups, and analytical work with awareness of foreground demand. PostgreSQL documents routine vacuuming and planner-statistics updates as related database maintenance tasks.
After deployment, monitor plan changes and latency by query shape. Store enough history to compare releases and seasonal traffic. A performance budget in load tests and release checks catches regressions before users become the monitoring system.
Database optimization for relational databases
Relational optimization centers on giving a cost-based planner good access paths and accurate information while preserving transactional correctness. EXPLAIN reveals the estimated plan; engine-specific runtime options such as PostgreSQL's EXPLAIN ANALYZE add actual timing and row counts.
Consider a common query:
SELECT order_id, created_at, total_amount
FROM orders
WHERE tenant_id = 42
  AND status = 'open'
  AND created_at >= DATE '2026-07-01'
ORDER BY created_at DESC
LIMIT 50;
A useful index candidate is (tenant_id, status, created_at DESC), because equality predicates constrain the leading columns and the final column supports the range and ordering. That is a hypothesis, not a rule to apply blindly. Test it against production-like cardinalities. If nearly every order is open or a tenant owns most of the table, the planner may rationally prefer another path. A partial index on open orders might be better if the predicate is stable and the engine supports it.
Join tuning follows the same principle. Index foreign-key lookup columns used by frequent joins, inspect join order and cardinality estimates, and avoid implicit type casts between join keys. Large estimation errors often point to stale statistics or correlated predicates rather than a need to force a particular join algorithm.
Transaction design is equally important. Keep transactions short, update rows in a consistent order, and choose the weakest isolation level that still satisfies correctness. Batch writes enough to reduce round trips, but not so aggressively that a transaction monopolizes locks, fills logs, or makes retries expensive. Monitor deadlocks, blocked sessions, and long-running transactions as first-class performance signals.
Relational engines also require storage maintenance. PostgreSQL's VACUUM guidance explains that routine vacuuming reuses space from updated or deleted rows, updates planner statistics, maintains visibility information, and prevents transaction ID problems. Other engines have different maintenance mechanisms, but the general lesson holds: an optimizer and storage engine cannot compensate indefinitely for neglected metadata and accumulated background work.
Database optimization for NoSQL databases
NoSQL optimization begins with the database's data model and request API. A document store, wide-column database, and key-value store expose different access paths, consistency choices, and distribution behavior. Treating all three as schema-free systems hides the decisions that matter most.
Design from known access patterns. MongoDB's data-modeling guidance states the core document-model principle directly: data accessed together should be stored together. Embedding can keep a read to one document and make related updates atomic, while references avoid unbounded document growth and duplicated updates. The right choice depends on relationship cardinality, update frequency, and the operations the application actually performs.
Indexes still matter. Use explain to distinguish an index scan from a collection scan and to see whether the engine performs an in-memory sort. Avoid indexing every field simply because documents are flexible. Each secondary index adds write work, storage, cache demand, and, in a distributed system, possible replication traffic.
Partition-key design is often the load-bearing decision. A key should distribute activity, not just records. A timestamp alone may send current writes to the same partition. A low-cardinality status value can create a few hot partitions. Amazon's DynamoDB partition-key guidance recommends uniform activity across partition keys and secondary indexes. The durable principle applies beyond DynamoDB: model for traffic distribution and provide a direct key-based route for frequent requests.
Avoid broad scans when a native keyed query can answer the request. Choose consistency per operation rather than globally when the database permits it. Stronger consistency, multi-document transactions, and cross-partition aggregation are valid requirements, but they consume coordination. Make that cost explicit in the data model instead of discovering it after scale exposes the boundary.
Finally, observe background compaction, tombstones, replication, and rebalancing. These processes differ by engine, but all can compete with foreground requests. A fast point lookup in an idle benchmark says little about tail latency during compaction or a node replacement.
Database optimization in cloud environments
Cloud databases make capacity easier to obtain, but they do not remove workload design. Scaling an instance can hide an inefficient query while raising its recurring cost. Begin with the same query, lock, and wait analysis used on self-managed systems, then decide whether tuning or capacity is the appropriate response.
Cloud optimization has four additional dimensions. First, match compute, memory, and storage characteristics to the bottleneck. A memory-bound working set, CPU-heavy aggregation, and I/O-bound scan need different changes. Second, place applications and databases to limit network latency and cross-zone or cross-region transfer. Third, test autoscaling behavior against bursts, including its reaction time and connection impact. Fourth, include cost per useful transaction or query in the performance dashboard.
Managed observability should expose database load by SQL, wait, host, and user, not just instance CPU. AWS now directs RDS and Aurora users to CloudWatch Database Insights, which provides fleet and instance views of database load. Azure SQL Database automatic tuning can recommend or apply index changes and force a previous good plan when a plan regresses. Feature scope and defaults vary, so review what a service will change before enabling automatic actions.
Separate analytical and transactional workloads when their resource patterns conflict. Read replicas, warehouse ingestion, change data capture, and dedicated analytical engines are possible boundaries. These boundaries keep large scans and graph traversals from destabilizing latency-sensitive transactions without making duplication the default.
For relationship-heavy analytics over warehouse or lakehouse tables, PuppyGraph provides a separate graph compute layer while the tables remain in their existing storage. It compiles openCypher and Gremlin traversals into node and edge operators in its own distributed engine and issues only simple projection / filter SQL to SQL sources. This keeps multi-hop planning out of the source's relational optimizer. The default path reads source tables directly, so there is no graph-specific ETL or persistent graph copy to maintain. When repeated source reads are the bottleneck, local tables can cache selected inputs on PuppyGraph compute nodes. Loading and refresh are explicit, which makes source load and freshness an operational choice rather than a hidden behavior.
That pattern illustrates a broader cloud optimization principle: place each workload in an engine designed for its operators, but keep data movement, cache freshness, and operational ownership visible in the design.
AI-powered database optimization
Automated tuning systems analyze workload history to detect plan regressions, recommend indexes, adjust configuration, or predict resource pressure. Some use statistical models or machine learning; others combine rules, cost models, and controlled experiments. Their value depends on the evidence they observe, the actions they can take, and how they verify and reverse those actions.
Plan correction is a bounded example. A service can detect that a query's new execution plan consumes more resources than a previously successful plan, restore the known plan, and monitor the result. Index recommendation is harder because an index benefits reads while taxing writes and storage. A credible system evaluates the whole observed workload and retains a rollback path.
Generative AI can help explain a plan, group similar queries, or propose a rewritten statement. Treat its output as a hypothesis. Query equivalence is subtle around nulls, duplicates, ordering, time zones, collation, and transaction isolation. A plausible index recommendation may ignore write amplification or a deployment's actual data distribution. Never grant an assistant unsupervised production DDL access simply because its explanation sounds confident.
A safe automation loop has five controls: representative telemetry, a narrow action scope, predeployment validation, gradual rollout, and automatic rollback tied to a defined regression threshold. Keep an audit trail of recommendations, approvals, executed changes, and measured outcomes. Human review remains necessary for changes that alter semantics, consistency, availability, or cost commitments.
AI-assisted optimization is most useful when it shortens diagnosis and makes recurring evidence easier to interpret. It does not replace workload ownership. Teams still decide which latency matters, which trade-offs are acceptable, and whether a faster result is still the correct result.
Database optimization mistakes to avoid
Measuring the wrong workload. A change cannot be judged without comparable workload and resource measurements. Synthetic single-query timing is not enough for a concurrent production system. Plan choice depends on volume, skew, correlations, and parameter values, so evenly distributed staging data may produce a plan that production never should. Median latency can also improve while lock queues or cache misses make the 99th percentile worse. Track percentiles and concurrency, then examine the slow population separately.
Changing access paths reflexively. An index may accelerate one read and slow every write. Check usage, size, cache impact, and overlap with existing indexes. Test removal through an engine's safe visibility mechanism when available before dropping a questionable index. A forced index or join order can stabilize a plan, but it also freezes an assumption about the workload. Fix statistics, predicates, and access paths first. When a hint is necessary, document its evidence and conditions for removal.
Combining changes without a rollback path. A query rewrite, new index, larger instance, and configuration change deployed together make the outcome impossible to attribute. Small, reversible experiments produce reusable knowledge. A faster query that changes results is a defect, so validate result equivalence, transaction behavior, and failure recovery before a staged deployment with a clear reversal procedure.
Treating cache entries as always correct. Every cache needs an explicit freshness and failure contract. Unbounded TTLs, missing invalidation, and stampedes can trade database latency for stale results or synchronized overload.
Scaling hardware before diagnosing demand. More capacity is appropriate when the workload is efficient and genuinely resource-bound. It is an expensive substitute for fixing accidental scans, duplicate queries, or connection storms.
Conclusion
Database optimization works best as a measured loop: define the workload objective, locate the limiting resource, make one controlled change, and verify the result under realistic concurrency. Query tuning and indexing often produce the earliest gains, but schema design, caching, partitioning, maintenance, and application behavior determine whether those gains survive growth.
Relational and NoSQL databases expose different mechanisms, and cloud services add elasticity and automation, but the governing principle stays the same. Optimize the complete workload for an explicit service objective. Keep correctness, write cost, freshness, and operational complexity in the same decision as read latency.
Try the forever-free PuppyGraph Developer Edition and book a demo with the team to see how openCypher and Gremlin queries run relationship-heavy analytics over warehouse and lakehouse tables, with no graph-specific ETL, while keeping graph compute separate from the source database workload.

Hao Wu is a Software Engineer with a strong foundation in computer science and algorithms. He earned his Bachelor’s degree in Computer Science from Fudan University and a Master’s degree from George Washington University, where he focused on graph databases.


