

Data Literacy: Definition, Skills, Benefits
.png)
Easy access to analysis does not make every conclusion reliable. People still have to ask the right question, judge whether the evidence supports an answer, and explain what that answer means for a decision. Those responsibilities extend beyond analyst roles. A product manager interpreting an experiment, an operations lead reviewing a forecast, and an executive challenging a performance metric all need them.
Software can make analysis easier to access, but access alone does not make an organization data-literate. People still need shared definitions, trustworthy data, permission to question results, and enough domain knowledge to connect a number to the process that produced it. This guide covers the skills, culture, training, measurement, and AI practices that turn data into usable evidence.
What is data literacy?
Data literacy combines practical skills with critical judgment. A data-literate person can identify the data needed for a question, locate it, assess its quality and relevance, analyze it at an appropriate level, and communicate a conclusion without hiding uncertainty. The goal is not to turn every employee into a data scientist. It is to give each person the competence their decisions require.
Definitions vary because data literacy spans several disciplines. Statistics Canada's review of data-literacy frameworks describes a common core around reading, writing, and comprehending data, then maps competencies across collection, management, analysis, interpretation, evaluation, and communication. The European Commission's DigComp 3.0 framework likewise treats competence as a combination of knowledge, skills, and attitudes, not tool operation alone.
Data literacy is also contextual. A finance partner may need to reconcile a metric to a ledger and explain variance. A support manager may need to separate a seasonal change from a product issue. A data engineer needs deeper knowledge of lineage, schemas, and transformations. All three need to know what the data represents, what it omits, and how much confidence the evidence warrants.
Why is data literacy important?
Organizations make decisions through data even when they do not call the process analytics. Targets, service-level objectives, forecasts, risk scores, and customer segments encode assumptions about what to count and how. When those assumptions remain invisible, a polished dashboard can make disagreement harder to detect rather than easier to resolve.
Data literacy gives teams a shared way to examine the chain from question to decision. People can ask where a metric came from, whether the population is representative, which definition was used, and what changed between two reporting periods. That scrutiny catches problems before a number becomes a plan.
It also changes the relationship between domain experts and data specialists. A domain expert can state the operational question and test whether the result makes sense. An analyst can explain the method, limitations, and alternatives. Neither side has to pretend that technical skill substitutes for business context or that experience substitutes for evidence.
Data literacy skills
The essential skills follow the data lifecycle. They are related, but proficiency in one does not guarantee proficiency in the others.
Frame and source the question. Translate a business concern into a question that data can answer by defining the decision, unit of analysis, relevant population, time window, and comparison. Then find an appropriate dataset, identify its owner and access restrictions, and distinguish a governed source from an unofficial extract.
Assess and analyze the evidence. Examine completeness, validity, timeliness, consistency, provenance, and lineage before deciding whether the data fits the intended use. Work with distributions, rates, samples, uncertainty, and comparisons at the depth the role requires. Basic competence includes recognizing that correlation does not establish causation, an average can hide important variation, and a percentage needs a denominator.
Interpret, communicate, and govern the result. Read charts critically by checking axes, scales, aggregation levels, and filters, then choose a form that matches the question. Explain the finding, evidence, uncertainty, and recommended next step while separating observation from interpretation. Use the data within its permitted purpose, considering privacy, potential harm, sensitive proxies, and whether the result should be shared at the requested level of detail.
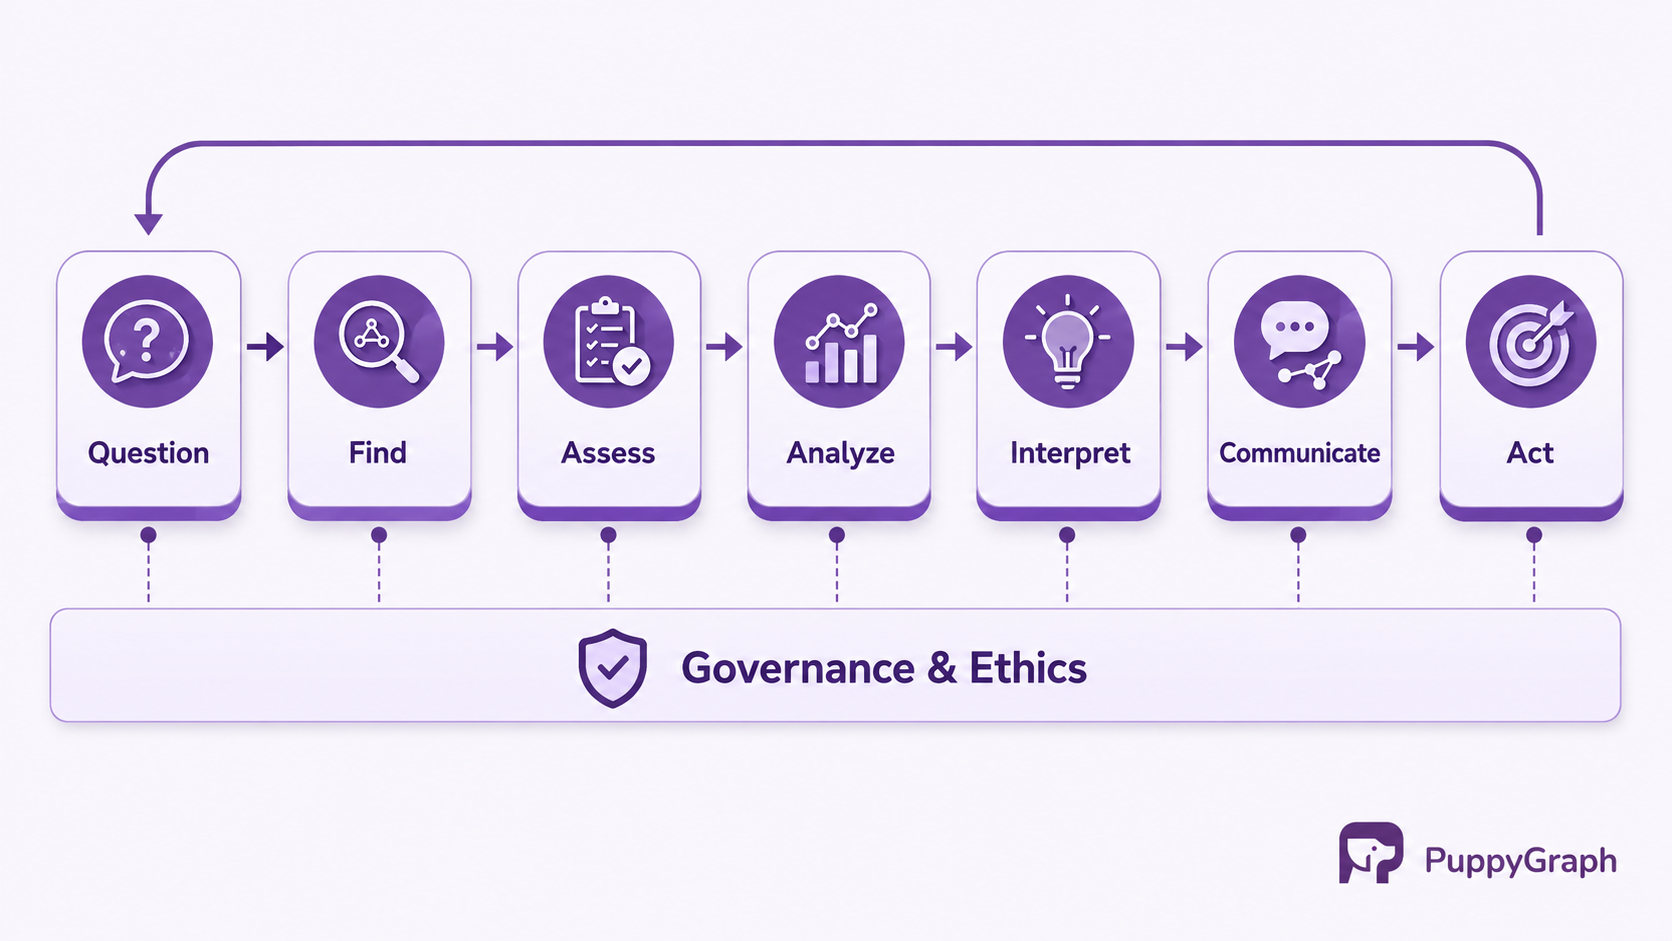
Together, these skills prevent data literacy from collapsing into dashboard fluency. Clicking filters is useful, but it is only one small part of deciding whether the result deserves trust.
Data literacy vs. data literacy culture
Data literacy is an individual capability. A data literacy culture is the organizational environment that lets people apply that capability consistently. Training can improve the first. The second also depends on incentives, leadership behavior, governance, access, and workflow design.
A company can have skilled analysts without a data-literate culture if their conclusions are routinely overridden without examination. It can also have enthusiastic leaders without broad literacy if employees cannot access definitions or interpret the metrics they are expected to use. Capability and culture reinforce each other, but they are not interchangeable.
Benefits of data literacy
Better decisions. Teams can compare evidence, assumptions, and trade-offs instead of debating whose dashboard is authoritative. This does not guarantee agreement. It makes the basis of disagreement inspectable.
Faster collaboration. Shared vocabulary reduces the time analysts spend rediscovering what a stakeholder means by customer, incident, conversion, or revenue. Business users can formulate narrower requests and evaluate intermediate results.
More effective self-service. People can answer routine questions independently while recognizing when a problem requires an analyst, statistician, privacy specialist, or domain owner. Responsible escalation is a mark of literacy, not a failure of it.
Stronger governance. Policies become part of daily work when employees understand why classifications, access rules, lineage, and retention matter. Governance then supports decisions instead of appearing only as an approval gate.
More credible experimentation and AI use. Teams with basic statistical and data-quality judgment are better equipped to define success measures, inspect training or retrieval data, evaluate outputs, and detect when a result does not generalize.
These benefits depend on the surrounding data environment. Literacy cannot compensate for inaccessible sources, conflicting definitions, or consistently poor data. It helps an organization identify and address those conditions instead of silently working around them.
How to build a data-literate organization
Start with decisions, not a generic curriculum. Identify a small set of recurring decisions where better data use would change an outcome. Interview the people who make and support those decisions, observe the artifacts they use, and list the gaps between the current and desired practice.
Next, define role-based competencies. Everyone may need to interpret a metric and question a source, while managers need to evaluate comparisons and analysts need deeper statistical, modeling, and governance skills. A framework should describe observable behaviors at progressive levels. It should not require every role to learn SQL or the same visualization tool.
Establish the enabling layer alongside training. Assign owners to critical metrics and datasets. Publish definitions, lineage, freshness, and access paths in places employees can find. Create office hours or a data-champion network for questions. Require important proposals to state their source, assumptions, uncertainty, and decision threshold.
Then teach through work. Short lessons can introduce a concept, but practice should use realistic tasks: diagnose a drop in conversion, compare two operational regions, or review a forecast with missing inputs. Managers should discuss how evidence changed a decision, including cases where the right conclusion was to collect more data.
Finally, treat the program as a product. Track where learners stall, update examples as systems change, and remove friction in tools and governance. If employees repeatedly misunderstand one metric, the answer may be clearer semantics or a better interface rather than another course.
Data literacy and AI
AI changes how people access analysis, but it does not remove the need for data literacy. Natural-language interfaces can generate a query, summary, or chart without requiring the user to know the underlying syntax. The user still has to judge whether the question was translated correctly, whether the sources are appropriate, and whether the output supports the conclusion.
The NIST Generative AI Profile recommends documenting upstream data dependencies and provenance, testing data and content flows, and evaluating outputs against known ground truth. Those practices are data literacy applied to an AI system. They require people to understand where evidence came from and how transformations affect it.
AI literacy adds model-specific knowledge: probabilistic output, confabulation, evaluation design, human oversight, and appropriate use boundaries. It rests on the same habits as data literacy. A fluent prompt cannot repair an ambiguous metric, an unrepresentative dataset, or a missing relationship in the source model.
A semantic layer can make that foundation clearer for both people and AI. PuppyGraph defines a graph schema of entities, relationships, and properties over existing warehouse and lakehouse tables. That schema acts as an ontology, so a person or AI assistant can ask about domain concepts rather than reconstructing join logic from storage-oriented names. Queries that reference entities or relationships outside the ontology are rejected with structured feedback before execution. The data remains in its existing stores, and analysts can query the model in openCypher or Gremlin without a graph-specific ETL pipeline.
This architecture addresses one part of AI-assisted data access: semantic grounding. People still need to inspect the evidence, understand uncertainty, and decide what action is warranted. Data literacy remains the human side of that contract.
Challenges of improving data literacy
Learner and program barriers. A single course will bore experienced analysts and overwhelm employees who are new to percentages or charts. Baseline assessment and role-based pathways keep training relevant without labeling people as data and non-data workers. Skills also decay when learners cannot apply them soon after a workshop, so each module should connect to a task the learner owns and include feedback on the work product.
Organizational and data barriers. Conflicting metrics and undocumented transformations teach employees that data cannot be trusted. Surface these problems and prioritize fixes by decision impact rather than framing skepticism about broken systems as a literacy deficit. Employees also need governed access to data they can find and use. Leaders set the cultural standard by making assumptions explicit and acknowledging when evidence changes a decision, especially when the finding challenges a preferred plan.
Measurement pressure. Completion rates are easy to report but weak evidence of competence. Overly broad maturity scores can also hide which roles and workflows need attention. Measure applied behavior and outcomes close to the decisions the program targets.
These challenges share one lesson: literacy programs cannot be separated from the environment in which people use data. Training, leadership incentives, accessible tools, and trustworthy data have to improve together.
Data literacy best practices
Adapt the curriculum to the work. Use a framework as a map, not a universal syllabus. The DigComp 3.0 framework includes proficiency levels and learning outcomes, making it useful for describing progression, but the competencies still need to fit the organization's roles, domain, and risks. Teach sampling through a customer survey, data quality through an operational report, and privacy through a dataset employees actually encounter.
Put support and governance next to the data. Publish each metric's meaning, owner, grain, filters, and update cadence beside the data product. Pair self-service with templates, annotated dashboards, office hours, review channels, and clear escalation paths for high-risk decisions. Include privacy, bias, consent, security, and uncertainty in realistic exercises rather than a detached annual compliance module.
Reinforce and maintain the practice. Track corrected definitions and retired reports as improvements so questions and corrections remain safe. Review learning objectives and examples on a regular cadence, updating them when data products, job tasks, regulations, AI capabilities, or risks change.
These practices work when they stay close to decisions. Relevant instruction builds the skill, discoverable definitions and support make it usable, and reinforcement turns it into routine behavior.
How to measure data literacy
Measure literacy at three levels: capability, behavior, and decision outcomes. No single score captures all three.
Capability measures test whether people can perform representative tasks. Use scenario-based assessments, work samples, or structured reviews before and after training. Ask learners to identify a misleading chart, choose an appropriate denominator, explain a dataset's limits, or write a decision summary. Self-assessment can reveal confidence and demand, but it should not stand alone.
Behavior measures show whether skills transfer into work. Examples include the share of important reports with documented owners and definitions, correct use of governed data, appropriate escalation, and the quality of assumptions recorded in decision documents. Interpret query or dashboard activity carefully. More usage does not necessarily mean better judgment.
Outcome measures connect the program to its original purpose. Depending on the workflow, this could mean fewer metric-reconciliation disputes, less rework caused by misunderstood requirements, faster completion of a recurring analysis, or fewer decisions reversed because the underlying data was unsuitable.
Establish a baseline, segment results by role, and combine quantitative measures with interviews or artifact reviews. Set targets for the specific competencies the program teaches. A useful measurement system reveals what to improve next; it does not reduce data literacy to a leaderboard.
Conclusion
Data literacy is the practical ability to turn data into appropriately qualified evidence. It covers finding and managing data, assessing quality and provenance, analyzing and interpreting results, communicating uncertainty, and acting within governance and ethical boundaries. A data-literate organization supports those individual skills with shared semantics, trustworthy data, role-based learning, and leaders who make scrutiny safe.
AI makes this work more urgent because it lowers the cost of producing analysis without lowering the cost of judging it. Build from real decisions, teach through realistic tasks, measure transfer into work, and improve the data environment alongside the people using it.
Try the forever-free PuppyGraph Developer Edition and book a demo with the team to see how openCypher and Gremlin queries connect warehouse and lakehouse tables, with no graph-specific ETL, through a shared semantic model for human and AI-assisted analysis.

Hao Wu is a Software Engineer with a strong foundation in computer science and algorithms. He earned his Bachelor’s degree in Computer Science from Fudan University and a Master’s degree from George Washington University, where he focused on graph databases.


