

What Is a Data Warehouse? Architecture & Benefits
The data warehouse is the oldest architecture in analytics that is still the default one. Three decades after the term was defined, it remains the system most organizations trust to answer what happened, and the data lakes and lakehouses built to challenge it have mostly ended up feeding it or converging with it. The category is still growing: Mordor Intelligence’s 2026 forecast values the cloud data warehouse market at USD 14.94 billion in 2026, growing at 26.86% annually toward USD 49.12 billion by 2031.
This guide covers what a data warehouse is and why organizations run one, how it works, the components and architecture underneath, the types you will encounter, the benefits, concrete examples, and the platforms that dominate the category.
What is a data warehouse?
A data warehouse is a central repository that integrates data from many source systems and stores it, modeled and historized, to serve analytical queries. Operational databases each hold one application’s current state; the warehouse holds the organization’s combined history, shaped for questions that scan and aggregate it: revenue by region by quarter, retention by cohort, inventory turns by store.
Bill Inmon’s definition, from Building the Data Warehouse (first published 1992), still describes the category precisely. A warehouse is subject-oriented (organized around business entities such as customers and orders, not around the applications that produced the data), integrated (data from disparate sources is conformed to consistent keys, units, and encodings), time-variant (it holds history as a series of snapshots, not just current values), and non-volatile (data is loaded and read, not updated in place by transactions).
The property that makes all four work is schema-on-write: data must be transformed into an agreed structure before it lands. That discipline is what buys consistent metrics and fast queries, and it is also the main contrast with the systems the warehouse is most often confused with.
The systems are complements, not rivals. An OLTP database runs the business, a data lake retains everything cheaply in raw form, and the warehouse serves modeled, high-concurrency analytics; the lakehouse is the ongoing convergence of the last two. What distinguishes the warehouse in that lineup is where it spends its discipline: before the data lands, so that every query afterward starts from clean, agreed structure.
Why is a data warehouse important?
The warehouse exists because a handful of organizational problems recur wherever analytics is attempted without one.
Analytics and operations cannot share a database. An operational database is tuned for thousands of small concurrent transactions; an analytical query wants to scan months of history. Run the second on the first and checkout slows while the report runs. Separating the two workloads is the founding reason the warehouse exists, and it still holds.
Every source system holds a partial picture. The CRM knows the customer’s contacts, billing knows their invoices, support knows their tickets. Questions worth asking (does slow support response predict churn?) span systems, and answering them requires integration into one store with consistent identifiers.
Metrics need one definition. Without a shared, modeled layer, each team computes “active customer” and “monthly revenue” its own way, and leadership meetings open by reconciling numbers. The warehouse is where definitions are agreed once and encoded in tables everyone queries.
History is an asset operational systems discard. An orders database overwrites the shipping address on change; the warehouse records that it changed, when, and from what. Trend analysis, forecasting, and audit all depend on that retained history, and regulators increasingly require it to be reproducible.
The downstream stack assumes it. BI tools, ML feature pipelines, and now LLM-based agents all want a governed, consistently modeled source of truth to draw from. The warehouse is the layer the rest of the analytics stack is built against.
None of these problems is about technology preference; they are coordination failures that get worse as an organization grows. The warehouse is the standing answer to them, which is why it has outlived several generations of predicted replacements.
How does a data warehouse work?
Mechanically, a warehouse is a pipeline with three movements: integrating data in, storing it modeled, and serving queries out.
Getting data in. Data arrives from operational databases, SaaS applications, and event streams through batch extracts, change data capture, or streaming ingestion, landing first in staging tables. The classic pattern was ETL (extract, transform, load), where data was transformed before loading; the modern cloud pattern is ELT, where raw data loads first and the warehouse’s own engine runs the transformations. Either way, transformation is mandatory before data reaches the modeled layer: keys are conformed, duplicates resolved, units standardized.
Modeling and storing. Transformed data lands in modeled tables, most commonly dimensional models: fact tables holding measurable events (orders, payments, page views) surrounded by dimension tables holding context (customer, product, date). The modeling disciplines behind those choices are their own topic, covered in our guide to data warehouse design. Physically, storage is columnar and compressed, partitioned so queries touch only relevant slices.
Serving queries. Analysts and BI tools query the modeled tables in SQL, mostly OLAP-shaped work: aggregations, slicing, drill-downs across large scans. The engine makes this affordable through partition pruning, parallel execution across nodes, caching, and materialized views for the hottest aggregates.
The design consequence worth internalizing is the mirror image of the data lake’s: in a warehouse, all the discipline (validation, modeling, quality) sits in front of storage as a gate, so reads are cheap and consistent, at the price of upfront modeling work whenever a new source or question arrives.
Key components of a data warehouse
The pipeline above is built from a recognizable set of parts, whatever the vendor.
Source systems and the integration pipeline. The operational databases, SaaS APIs, and event streams that produce data, plus the ETL/ELT tooling that extracts it, stages it, and transforms it into the modeled layer. This is where most of a warehouse team’s ongoing engineering effort lives.
The storage and query engine. The core database: columnar storage, a massively parallel (MPP) execution engine, and a cost-based optimizer, tuned for scans and aggregations rather than single-row lookups. In cloud platforms this splits further into a storage layer on object storage and elastic compute over it.
Metadata and catalog. The layer that records what tables exist, their schemas, statistics, and lineage. Query planning, governance, and discovery all depend on it; it is the least visible component and the one everything else consults.
Data marts and the semantic layer. Subject-scoped subsets (a finance mart, a marketing mart) and the layer that maps physical tables to business terms, metrics, and hierarchies, so that “revenue” means one thing across every dashboard built on top.
BI and access tools. The consumption surface: dashboarding tools, SQL clients, notebooks, and increasingly APIs serving applications and AI assistants.
Spanning all of these sits governance and security: role-based access control, column masking, encryption, and audit logging. In a warehouse these arrive built in and centrally enforced, which is a large part of what organizations are paying for relative to assembling the same guarantees over a lake.
Data warehouse architecture
Textbook descriptions and modern platforms share the same skeleton: a three-tier architecture, with a data flow that refines data as it moves up.
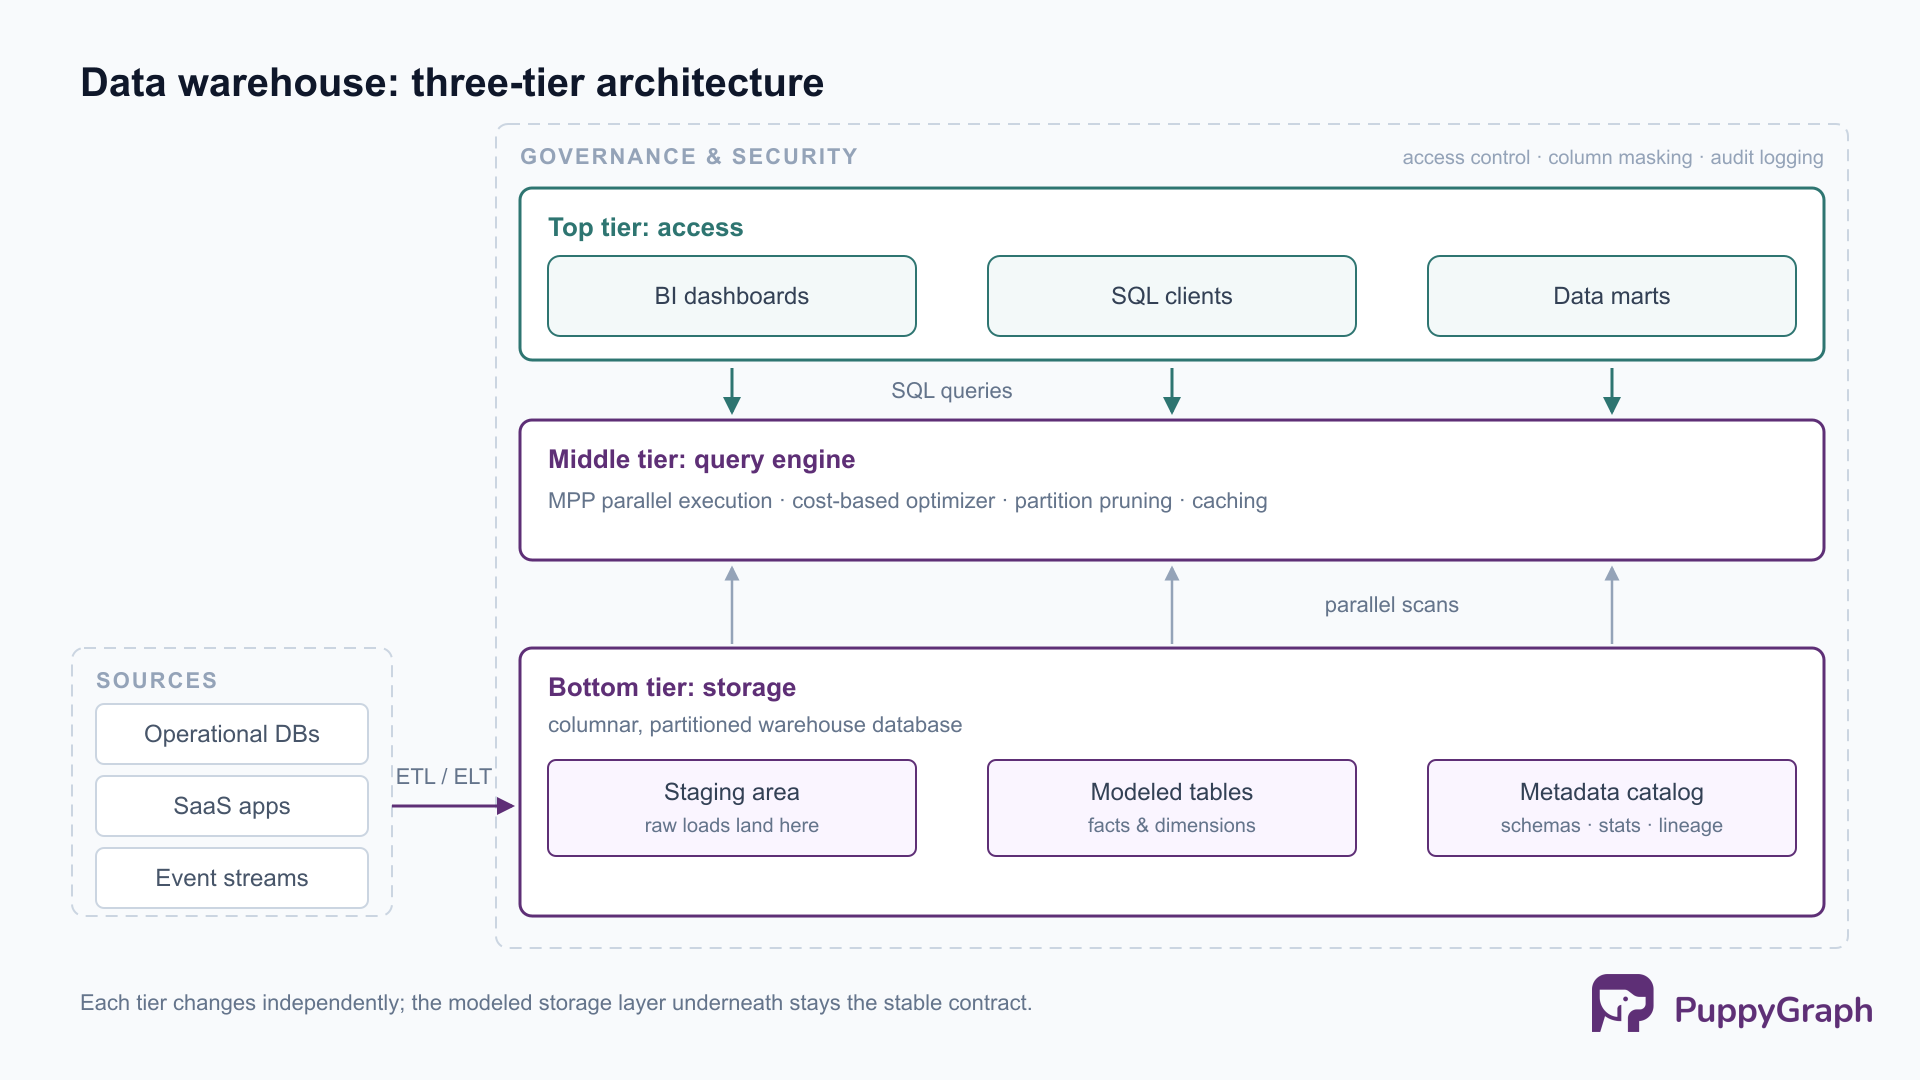
The bottom tier is the warehouse database itself: staging areas where extracted data lands, and the modeled storage layer of partitioned, columnar tables plus the metadata that describes them.
The middle tier is the query engine, historically an OLAP server and today an MPP SQL engine: it parses queries, plans them against the metadata, prunes partitions, and executes scans in parallel. This tier determines the performance characteristics the warehouse is known for.
The top tier is the access layer: BI tools, reporting, ad-hoc SQL, and the data marts that give departments focused views of the shared core.
Within that skeleton, two design philosophies have competed for decades. Inmon’s top-down approach builds a normalized enterprise warehouse first and derives marts from it; Kimball’s bottom-up approach builds dimensional marts around business processes and integrates them through shared, conformed dimensions. Most real systems mix the two, and the argument matters less than it did: cheap cloud storage removed much of the cost pressure that made the choice consequential.
The larger architectural shift is the cloud one: modern platforms separate storage from compute, so data volume and query capacity scale and bill independently, and multiple isolated compute clusters can serve different workloads over the same tables. That shift, and the platform differences it produced, are covered in depth in our cloud data warehouse guide.
Types of data warehouses
Warehouses differ along two axes: what scope they serve, and where they run.
On scope, the enterprise data warehouse (EDW) is the full pattern, a single integrated store spanning the organization’s subject areas. A data mart is a subject-scoped subset (finance, marketing), either derived from the EDW or built standalone; marts trade completeness for simplicity and departmental ownership. An operational data store (ODS) sits closer to the sources, holding current, lightly integrated data for operational reporting at near-real-time freshness, often serving as a staging layer that feeds the warehouse proper.
On deployment, on-premises warehouses (the appliance generation) persist where data residency, latency, or sunk investment demands them, with capacity fixed by hardware. Cloud data warehouses are the current default: managed services with elastic, separately billed storage and compute. Hybrid deployments span the two, usually as a long migration or a residency compromise.
The scope axis is about organizational design and the deployment axis about infrastructure economics, and they move independently: a cloud EDW with derived marts is the common modern shape, but every combination exists for a reason somewhere.
Benefits of using a data warehouse
The benefits are the properties the architecture buys, and each traces back to schema-on-write discipline plus an engine built for scans.
Consistent answers. Integration and conformed definitions mean the same question returns the same number regardless of who asks or which tool they use. This is the benefit organizations feel most, because its absence is so visible.
Analytical query performance. Columnar storage, partition pruning, and parallel execution make scanning years of history affordable and fast, at concurrency levels that let hundreds of dashboard users share the system.
Queryable history. Time-variant, non-volatile storage turns history from something reconstructed out of backups into something queried directly: trends, cohorts, point-in-time reproductions for auditors.
Governance built in. Access control, masking, audit logging, and lineage are enforced centrally at the platform level, which is what makes it safe to concentrate sensitive data in one place.
A stable foundation for the stack above. Because the modeled layer changes deliberately rather than with every upstream schema drift, the dashboards, ML pipelines, and applications built on it inherit that stability.
The trade is equally clear: every benefit is purchased with upfront modeling work, and data whose structure or use is not yet known fits the model poorly. That is the gap the data lake fills, and why most organizations run both rather than choosing one.
Data warehouse examples
Concrete workloads make the pattern less abstract. These are among the most common shapes in production.
Retail and e-commerce. Sales, inventory, and promotion data integrated across stores and channels, serving daily merchandising decisions: which products to reorder, which promotions lifted margin rather than just volume, how demand shifts by region and season.
Financial services. Risk aggregation and regulatory reporting, where the non-volatile, time-variant properties are the point: a regulator asking for a position as of a past date needs a warehouse that can reproduce it, with an audit trail of how the number was derived.
SaaS product analytics. Product events, subscriptions, and support data modeled into funnels, retention cohorts, and churn indicators, feeding both executive metrics and the features that score accounts for expansion or risk.
Healthcare. Claims, clinical, and operational data integrated for outcome analysis and cost reporting, under governance requirements that make the warehouse’s built-in access control and audit the deciding factor.
One question shape recurs across all of these and fits the warehouse poorly: questions that traverse relationships. Which accounts connect to a flagged one through shared devices or payment methods; which suppliers a disruption reaches through multi-tier dependencies; which services transitively depend on a failing component. In SQL each becomes a chain of self-joins whose depth must be guessed in advance, with cost climbing steeply per hop; the data is relational, but the question is a graph traversal expressed against SQL tables. The historical answer, a separate graph database fed by ETL, reintroduces the silo the warehouse was built to end. PuppyGraph removes that step: it is a graph query engine that connects directly to SQL databases, warehouses, and lakehouses (Snowflake, Databricks, PostgreSQL, MySQL), including direct reads of open table formats like Apache Iceberg and Delta Lake, lets you define a graph schema over existing tables, and queries them as a graph in openCypher and Gremlin, with no ETL and no second copy of the data. Customers include Coinbase, eBay, and AMD; AMD builds a graph layer over Apache Iceberg spanning tickets, code, logs, and telemetry.
Popular data warehouse platforms
Five platforms dominate current evaluations, differing less in SQL capability than in compute packaging, pricing shape, and ecosystem.
The structural differences matter more than benchmark claims. Snowflake runs identically across the three major clouds, which makes it the neutral choice when cloud strategy is unsettled. BigQuery removes cluster management entirely and bills by data scanned or reserved capacity. Redshift rewards steady, well-utilized workloads inside an AWS stack, at the cost of more capacity management. Databricks approaches the category from the lakehouse side, with the warehouse as a SQL surface over Delta Lake tables. Fabric bundles warehousing into one capacity shared with the rest of the Microsoft analytics estate. Choosing among them is mostly a matter of matching pricing shape and ecosystem to the workloads you actually run; our cloud data warehouse guide covers the evaluation in detail.
Conclusion
A data warehouse is a bet on structure: integrate data once, model it deliberately, and every question afterward starts from clean, consistent, historized tables. The bet has held for thirty years because the problems it solves (workload separation, integration, shared definitions, retained history) are organizational constants, and the architecture keeps absorbing new economics, most recently the cloud’s separation of storage and compute and the lakehouse’s open formats, without changing that core contract. The durable decisions are less about which platform than about the modeling discipline itself, and about which engines you place over the modeled tables to serve the question shapes, like relationship traversal, that a relational engine handles least well.
Try the forever-free PuppyGraph Developer Edition and book a demo with the team to see how openCypher and Gremlin queries run over warehouse and lakehouse tables, with no graph-specific ETL, turning the tables your warehouse already models into a queryable graph.

Sa Wang is a Software Engineer with exceptional mathematical ability and strong coding skills. He holds a Bachelor's degree in Computer Science and a Master's degree in Philosophy from Fudan University, where he specialized in Mathematical Logic.


