

Data Democratization: Benefits, Challenges & Best Practices
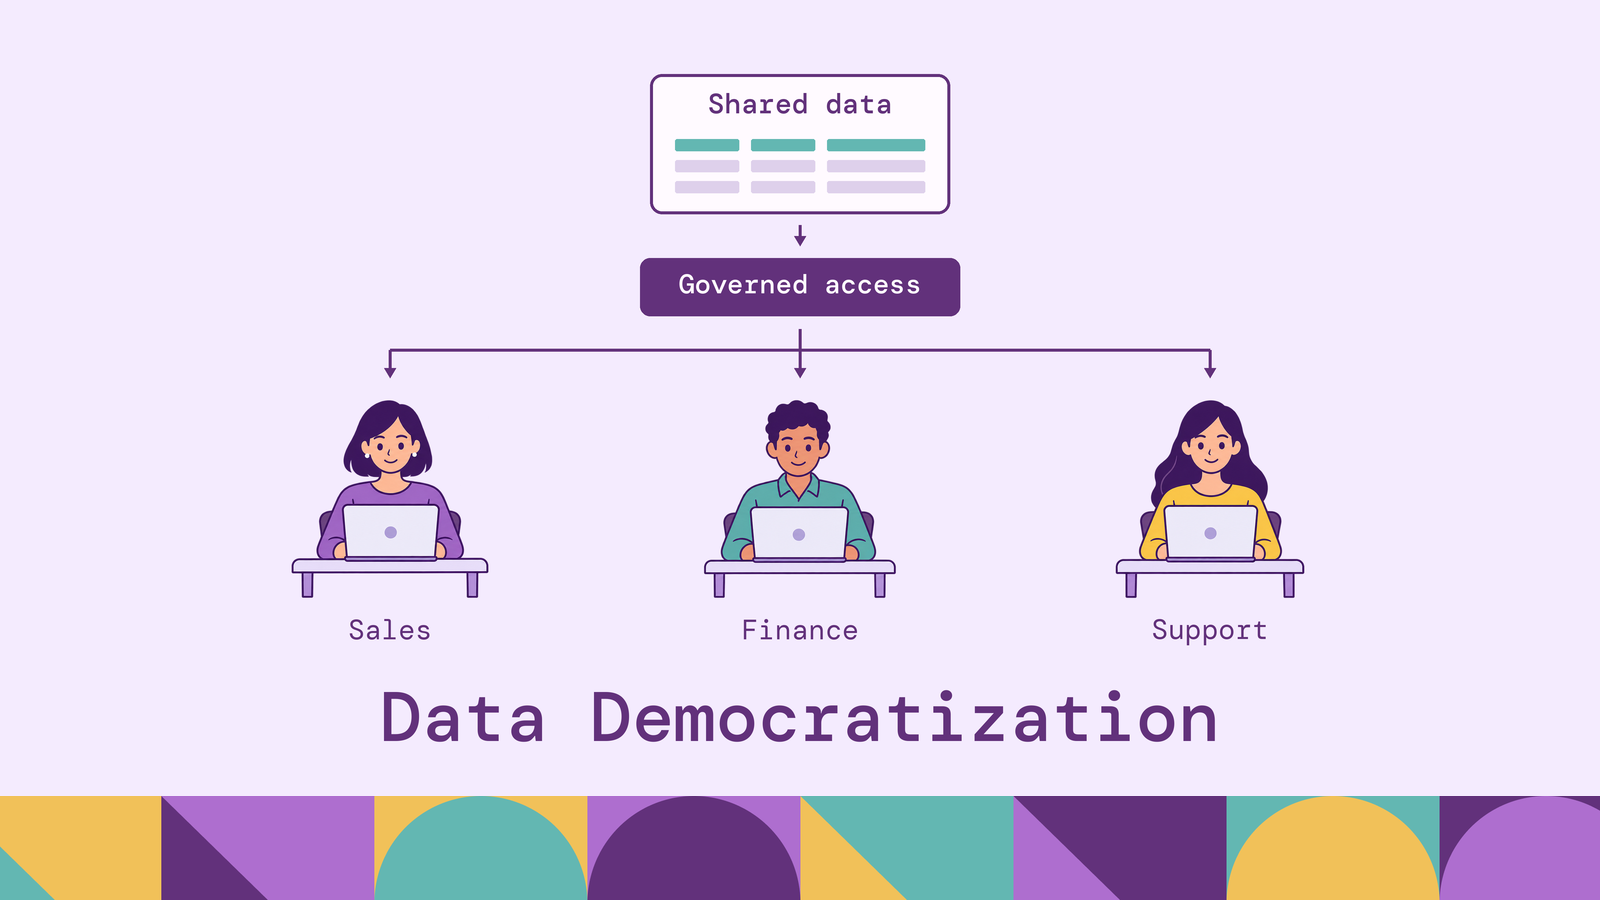
Data democratization succeeds when people can answer questions about their work using data they understand and are authorized to use. Granting warehouse access solves only part of that problem. A sales manager also needs to know which revenue definition applies, whether the latest transactions have arrived, and which customer records belong in the analysis.
The practical task is to make those conditions repeatable across teams. This guide explains how data democratization works, the benefits and risks it creates, and how to implement self-service access with shared definitions, accountable ownership, and enforceable controls.
What is data democratization?
Data democratization is the practice of making relevant data accessible and usable across an organization, including for people without specialist data skills. It combines access, understandable information, appropriate tools, and the ability to interpret results. IBM's overview of data democratization similarly connects access with data literacy and organization-wide governance.
A useful example is a customer success manager investigating renewals. The manager should be able to find an approved account dataset, understand how renewal dates and contract values are defined, and explore accounts within their remit. Preparing every result should not require a new request to a data engineer.
The scope remains tied to the job. The manager might see account health and support activity while payment credentials remain inaccessible. Broader participation does not require identical access for every employee.
Self-service business intelligence is one way to support this practice through dashboards and exploration tools. Data democratization also covers the work around those tools: documenting definitions, assigning owners, teaching interpretation, and providing a route to resolve problems. A dashboard is useful only if the intended audience can find it, trust its contents, and apply them appropriately.
Why is data democratization important?
When every question enters a central reporting queue, the people making decisions depend on someone else to translate their needs into queries. That arrangement can work for specialist analysis. It becomes cumbersome when routine follow-up questions, such as filtering renewals by region or examining a particular cohort, require another handoff.
The handoff also separates technical knowledge from operational context. A support lead may recognize a recurring service issue that a central analyst would not know to investigate. Giving that lead access to documented support and account data makes it possible to test the observation directly.
Central expertise still matters. Data teams design reliable models, investigate difficult questions, and maintain shared infrastructure. Democratization changes where that effort goes: reusable datasets and interfaces can support many investigations, while specialists concentrate on questions that require deeper analysis.
This makes data democratization an operating decision as much as a technology decision. Its value depends on whether people can use evidence at the point where they have the context and authority to act.
How does data democratization work?
A practical workflow connects discovery, interpretation, authorization, and analysis. Consider the renewal investigation from earlier.
Discover the relevant data. The manager searches a catalog or analytics workspace for upcoming renewals. The dataset entry identifies its owner, intended uses, update schedule, and known limitations. Discovery should make the approved dataset distinguishable from an abandoned experiment or a personal export.
Understand the model. The manager sees what one row represents: an account, a contract, or a subscription. This matters when one account holds several subscriptions. Summing account revenue after joining it to individual support tickets could count the same revenue repeatedly. The published model needs to encode the appropriate relationships and aggregation rules.
Shared metric definitions can be implemented in a semantic layer. For example, the dbt Semantic Layer defines metrics over existing models and handles joins so downstream tools can reuse those definitions. Teams still have to agree on the business meaning and model it correctly.
Suppose an account with $10,000 in annual contract value has three support tickets. A join that produces one row per ticket repeats that contract value three times; summing the joined column returns $30,000. Both source datasets can be accurate while the calculation is wrong. An approved model should preserve the metric's intended grain, for example by aggregating ticket counts per account before joining them to account values.
Apply access policy. The platform authenticates the manager and restricts the query to authorized data. Row-level controls can limit the accounts returned; column controls can protect sensitive attributes. BigQuery's row-level security documentation illustrates how policies filter table rows for specified users and groups. The exact enforcement mechanism depends on the platform and connection.
Analyze and share the result. The manager filters the approved renewal metric, inspects supporting records, and shares a saved view with colleagues who have appropriate permissions. Definitions, filters, and refresh information should remain available with the result. If the manager discovers a missing account, the dataset's issue channel routes that finding to its owner.
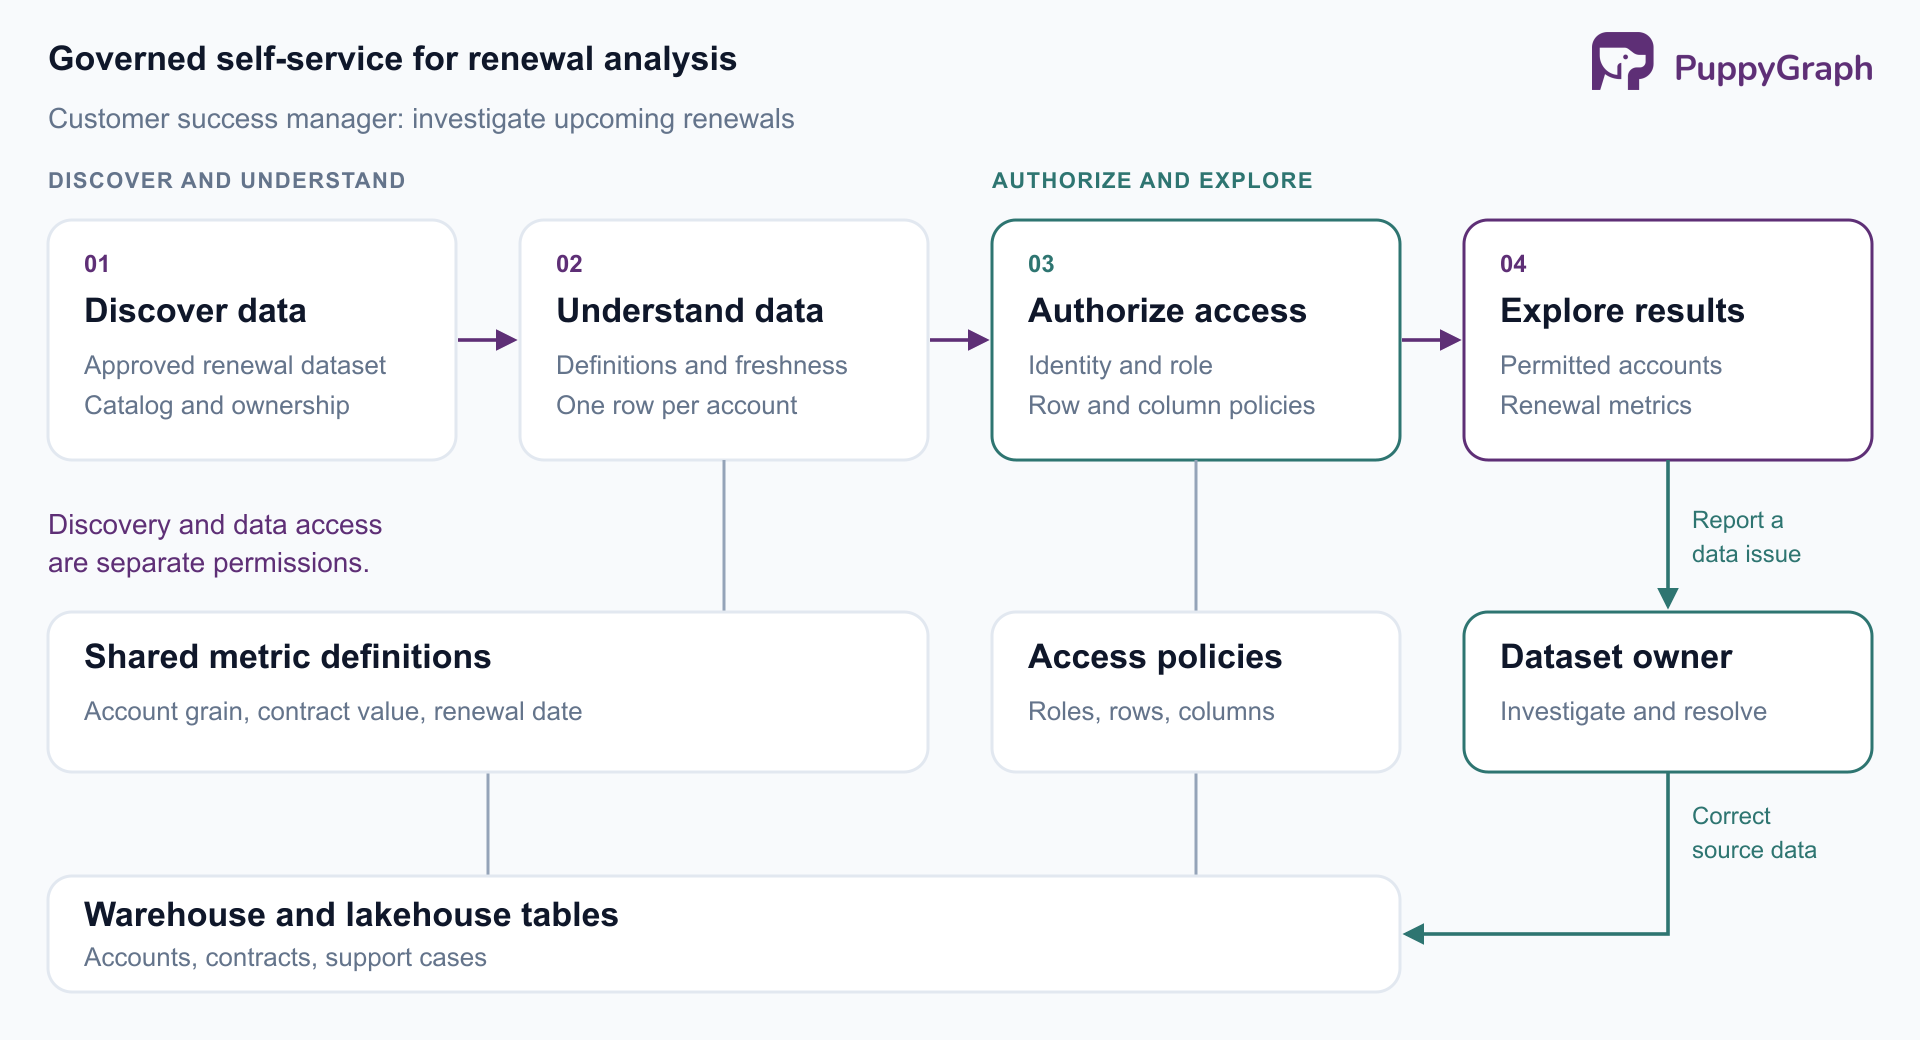
These responsibilities can be implemented with several tools or combined within one platform. The important property is continuity: the meaning and access restrictions established upstream must remain clear and effective when someone uses the result.
Key principles of data democratization
Access should match responsibility. Define access around tasks and roles, with an explicit process for exceptions and revocation. This follows NIST's least-privilege principle: grant only the access needed to perform an assigned function. A useful discovery experience can show that a dataset exists without exposing its restricted contents.
Meaning should be shared and explicit. Publish definitions, units, time zones, inclusion rules, and the level of detail represented by each record. Where departments need different metrics, give those metrics distinct names. Booked revenue and recognized revenue can both be valid; labeling each simply as revenue hides a consequential difference.
Quality should be visible and fit for purpose. The UK Government Data Quality Framework (2020) treats quality as fitness for the intended use and distinguishes dimensions including completeness, timeliness, and accuracy. Apply that reasoning to each dataset. Daily updates may support a planning review while being unsuitable for an operational alert.
Ownership and literacy should accompany access. Assign someone to maintain the dataset and help consumers understand its limits. Teach users how to choose a denominator, interpret missing values, and distinguish a pattern from evidence of causation. Training should use the questions and datasets people encounter in their jobs.
Together, these principles make independence practical. Consumers know what they can use, what it means, where its limitations lie, and who can resolve a problem that exceeds their expertise.
Benefits of data democratization
The benefits follow from reducing repeated handoffs and reusing trustworthy analytical work. Their size depends on adoption and the quality of implementation.
Faster routine decisions. A regional manager can inspect a change in order cancellations during an operating review, follow up by product, and identify cases requiring attention. The saving comes from answering familiar questions through a prepared interface without waiting for a custom extract.
More productive specialist work. When common questions use maintained datasets, data engineers and analysts can spend less time reproducing extracts. Their work shifts toward improving models, diagnosing discrepancies, and supporting analyses that need statistical or technical expertise. This shift requires investment in documentation and support; self-service does not eliminate that work.
Better collaboration across functions. Finance and customer success can compare the same renewal population while examining different measures. A shared account identifier, reporting period, and contract definition give them a basis for explaining differences instead of debating which spreadsheet is authoritative.
More opportunities to test ideas. People close to a process can investigate observations that might never become formal analytics requests. A support team can examine whether repeated escalations cluster around a particular product configuration, then bring a specific hypothesis to engineering.
These are capabilities to measure, not guaranteed outcomes. A program should demonstrate that people complete useful analyses more easily and produce results that withstand review.
Challenges of data democratization
Sensitive data can escape its intended audience. An authorized dashboard may expose more detail through exports, drill-downs, or an application connection with broader permissions. Test the complete access path, including the identity used by each service. A control in one interface does not establish that every downstream interface applies it.
For personal or confidential data, define what can be shared and at what level of detail. Aggregation needs care too: a very small group can reveal information about an individual. Security and privacy reviewers should assess the actual use case and output, including what recipients can infer.
Inconsistent definitions produce conflicting answers. Two teams can query accurate records and still disagree because they count different populations or use different dates. A catalog description helps explain the difference, but reusable models and reviewed metric definitions are needed to keep that difference explicit in calculations.
Poor quality becomes more widely distributed. A broken identifier or delayed feed can affect many users of a popular dataset. Monitor the fields and update schedules that matter to its use. When quality falls below the agreed standard, surface the issue where people consume the data and explain which conclusions are affected.
Interpretation skills vary. An easy chart builder does not teach sampling, seasonality, or causal inference. A rise in retention among customers who contact support does not establish that contacting support caused the improvement. Users need examples of misleading analyses and a clear path to specialist review when decisions warrant it.
Ownership and operating costs can be neglected. Expanded usage creates work: maintaining metadata, answering questions, reviewing permissions, and managing query demand. If that work has no owner or budget, interfaces degrade and teams return to personal copies. Set workload limits, observe usage, and retire redundant datasets as part of the program.
The central difficulty is maintaining these responsibilities as participation grows. Opening access is a discrete change; keeping data useful, controlled, and understandable is continuing work.
Data democratization use cases
The following examples illustrate where governed self-service can support specific decisions. Each needs a defined audience, a useful data model, and an appropriate access boundary.
Customer retention. Customer success teams can combine renewal dates, product usage, and support history to identify accounts needing attention. Model the relationship between people, accounts, and subscriptions carefully: a user who stops logging in does not necessarily represent a lost customer. Account permissions should also apply when the analysis expands into supporting records.
Sales and revenue planning. Regional leaders can compare pipeline coverage, closed business, and renewal exposure using agreed reporting periods. Finance retains responsibility for accounting definitions while sales teams explore the operational measures relevant to their territories. Distinguishing contract value from recognized revenue prevents a useful commercial forecast from being mistaken for a financial report.
Supply chain operations. A planner can examine late purchase orders, available inventory, and supplier dependencies when deciding how to handle a shortage. A useful interface makes units, locations, and expected arrival times explicit. If inventory updates lag behind purchasing records, that limitation must be visible before the planner commits to a delivery date.
Product development. Product managers can compare adoption and retention across release cohorts without requesting a new extract for every segment. They need documented event definitions and a way to distinguish missing instrumentation from absent behavior. Analysts can then help design experiments or evaluate whether an observed difference supports a product change.
These use cases have different interfaces and freshness requirements. What they share is a specific decision that becomes easier when the person responsible can inspect the relevant evidence directly.
How to implement data democratization
Start with a bounded workflow and expand after users can complete it reliably. An organization-wide catalog is useful infrastructure, but a successful pilot needs a task someone actually wants to perform.
1. Select a decision and establish a baseline. Choose a recurring question with a known audience, such as identifying renewals requiring review. Record how people answer it today, how long they wait, and which steps require specialist help. Agree on what a correct answer looks like before choosing an interface.
2. Prepare the data and assign ownership. Identify authoritative sources, resolve identifier mismatches, and define the reporting grain and metrics. Publish ownership, freshness expectations, quality checks, and known exclusions alongside the dataset. Assign a domain owner to approve meaning and a technical owner to maintain delivery, with an escalation path between them.
3. Implement and test access controls. Classify sensitive fields and translate policy into roles, filters, masking, or approved views as appropriate. Test allowed and denied cases with representative users. Include exports, shared reports, service identities, and access revocation. Use the broader enterprise data governance framework to establish who approves exceptions and reviews access over time.
4. Build the interface and teach the workflow. Use dashboards for recurring measures, guided exploration for common follow-ups, and query tools for trained analysts. Train users on the actual dataset, including a deliberately misleading example. Ask participants to explain the meaning and limitations of their result; completing a tutorial alone is weak evidence of readiness.
5. Measure use and expand selectively. Track time to a reviewed answer, the share of routine questions completed independently, repeat usage, and recurring data defects. Review query costs and support effort alongside adoption. Before adding another domain, fix the issues that repeatedly block the current users. A falling ticket count is useful only if people are still getting their questions answered.
For the pilot, keep a small set of representative tasks and repeat them after rollout. Count successful self-service completion only when the user reaches a correct, interpretable result. Record abandoned attempts too. This separates improvements in the workflow from changes in the difficulty of questions people happen to ask.
For questions that span business relationships, add a semantic model that exposes those relationships explicitly. An account investigation might need to follow subscriptions to services and then to related support cases. Maintaining that model centrally lets consumers reuse the relationship definitions across investigations.
PuppyGraph defines a graph schema over existing data, mapping tables to entities, relationships, and properties. Its graph modeling workflow makes those mappings explicit. The schema functions as an ontology that analysts can query with openCypher and Gremlin. By default, PuppyGraph queries supported SQL databases, warehouses, and lakehouses in place, without requiring ingestion into a separate graph store.
Its built-in AI assistant also accepts natural-language questions and generates graph queries against the enforced ontology. Invalid entity or relationship references return structured feedback the assistant can use to correct its query. This gives users another way to explore the model, while the team remains responsible for its definitions, data quality, and access configuration. Schema validation helps catch invalid references; interpreting a result still requires the business context established throughout the implementation.
Frequently asked questions about data democratization
Does data democratization mean everyone can access all data?
No. It means people can access and use data appropriate to their responsibilities. Restricted records can remain protected while approved metrics, aggregates, or subsets become easier to discover and use.
How is data democratization different from data governance?
Data democratization concerns participation in using data. Governance establishes ownership, definitions, quality expectations, and rules for access and use. Governance gives broader participation a reliable foundation; the two should be designed together.
Do employees need to learn SQL?
Not every employee does. Dashboards, guided exploration, and natural-language interfaces can support many tasks. Users still need enough data literacy to understand definitions, filters, and limitations, and to recognize when they need an analyst's help.
Does data democratization require centralizing every dataset?
No. Teams can provide governed access through warehouse models, approved views, or query layers over existing sources. Select the architecture around data quality, performance, permissions, and operating needs. A common storage location alone does not make data understandable.
How should success be measured?
Measure whether intended users complete meaningful analyses correctly and with fewer avoidable delays. Combine adoption and time-to-answer measures with result reviews, quality incidents, access-policy violations, and operating costs. More accounts or dashboards alone do not demonstrate useful access.
Try the forever-free PuppyGraph Developer Edition and book a demo with the team to see how openCypher and Gremlin queries connect entities across warehouse and lakehouse tables, with no graph-specific ETL, so teams can explore shared business relationships over existing data.

Hao Wu is a Software Engineer with a strong foundation in computer science and algorithms. He earned his Bachelor’s degree in Computer Science from Fudan University and a Master’s degree from George Washington University, where he focused on graph databases.


